

Influence of fruit and vegetable consumption on blood pressure progression among hypertensive patients in rural China
-
摘要:
目的 基于前瞻性队列研究探讨我国农村地区高血压患者果蔬摄入与血压进展的关系。 方法 中国代谢综合征社区干预研究暨中国家庭健康研究于2007-2008年开展基线调查,收集膳食、体力活动和血压等信息,并于2012-2015年进行随访调查。膳食资料采用食物频率问卷获取,按照研究对象总果蔬、水果和蔬菜摄入量是否达到推荐摄入水平和摄入量的四分位数分别进行分组。根据血压水平将高血压分为1级、2级和3级,随访期间高血压分级升高1级及以上则定义为血压进展。采用Logistic回归模型分析果蔬摄入与血压进展的关系。 结果 本研究纳入25 080例基线高血压患者,平均随访5.8年,共有4 112例高血压患者发生血压进展,进展率为16.4%。总果蔬摄入达标者较未达标者血压进展风险降低17%(OR=0.83,95% CI:0.77~0.90),蔬菜分析结果类似。以总果蔬摄入最低组(Q1)为参照,摄入量位于Q2~Q4组的ORs(95% CIs)值分别为0.86(0.78~0.95)、0.77(0.69~0.86)和0.69(0.61~0.77)(χ2趋势=43.02, P < 0.001),水果和蔬菜分析结果相似。总果蔬和蔬菜摄入量每增加100 g/d血压进展风险分别下降4%(OR=0.96,95%CI:0.94~0.98)和5%(OR=0.95,95% CI:0.93~0.97),而水果与血压进展风险的关联无统计学意义(OR=0.97,95% CI:0.93~1.01)。 结论 增加果蔬摄入能够有效降低血压进展的风险,对高血压患者的健康管理具有积极作用。 Abstract:Objective To evaluate the relationship of fruit and vegetable consumption with blood pressure (BP) progression among hypertensive patients in rural China, using a prospective cohort study. Methods Baseline examination of the Community Intervention of Metabolic Syndrome in China & Chinese Family Health Study (CIMIC) was conducted in 2007-2008 to collect information on diet consumption, physical activity, BP, and so on. Participants were followed up during 2012-2015. Diet consumption was calculated from food frequency questionnaires. Participants were divided into two groups by whether meeting the recommended intake of total fruit and vegetable (total F&V), fruit, or vegetable consumption (Yes or No), and were also classified into four groups according to their quartiles (Q1-Q4), respectively. Three stages of hypertension were ascertained according to BP levels, and BP progression was defined as an increment of ≥1 stage of hypertension from baseline to the follow-up visit. Logistic regression models were used to estimate the odds ratios (ORs) and their corresponding confidence intervals (CIs) for the relationship of fruit and vegetable intake with the risk of BP progression. Results Among 25 080 participants with hypertension at baseline, 4 112 patients had BP progression during the average follow-up of 5.8 years, with the progression rate of 16.4%. Participants who met the recommended total F&V intake had a 17% (OR=0.83, 95% CI: 0.77-0.90) reduction in the risk of BP progression compared with those who did not. Compared with the lowest group of total F&V consumption (Q1), the ORs (95% CIs) of BP progression were 0.86 (0.78-0.95), 0.77 (0.69-0.86) and 0.69 (0.61-0.77) for the Q2, Q3 and Q4 group, respectively (χ2trend=43.02, P < 0.001). Analyses of vegetable and fruit consumption showed similar results. Furthermore, each increment of 100 g/d in total F&V and vegetable intake was associated with a 4% (OR=0.96, 95% CI: 0.94-0.98) and 5% (OR=0.95, 95% CI: 0.93-0.97) lower risk of BP progression, respectively. The association of fruit with BP progression was not significant (OR=0.97, 95% CI: 0.93-1.01). Conclusions Increasing the intake of fruit and vegetable could reduce the risk of BP progression and is beneficial for the management of hypertension patients. -
Key words:
- Fruit /
- Vegetable /
- Blood pressure progression /
- Hypertension /
- Cohort study
-

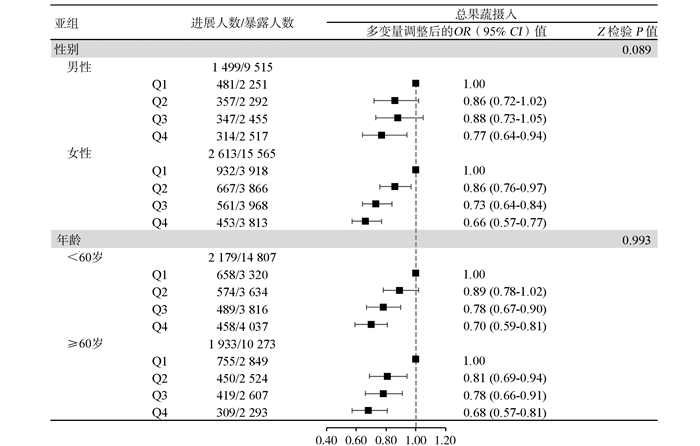
图 1 高血压患者中总果蔬摄入量与血压进展关联关系的亚组分析
Figure 1. Subgroup analyses for the association of total F&V consumption with blood pressure progression among hypertensive patients
表 1 依据总果蔬摄入量分组的高血压患者基线特征[n(%)]
Table 1. Baseline characteristics of hypertensive patients according to total F&V consumption [n(%)]
项目 Q1(< 266.7 g/d) Q2(266.7~435.6 g/d) Q3(435.7~549.9 g/d) Q4(≥550.0 g/d) χ2/F值 P值 人数 6 169(24.6) 6 158(24.6) 6 423(25.6) 6 330(25.2) — — 水果摄入占比(%) 13.3 15.4 15.8 23.0 — — 年龄[(x±s), 岁]a 58.5±10.6 57.0±10.5 57.1±10.3 55.8±10.4 69.68 < 0.001 男性b 2 251(36.5) 2 292(37.2) 2 455(38.2) 2 517(39.8) 15.58 < 0.001 南方b 4 802(77.8) 2 285(37.1) 1 628(25.4) 1 065(16.8) 4 970.15 < 0.001 文化程度高中及以上b 267(4.4) 388(6.3) 391(6.1) 511(8.1) 64.45 < 0.001 BMI [(x±s), kg/m2]a 24.5±3.6 25.3±3.7 25.3±3.7 25.5±3.7 91.01 < 0.001 吸烟b 1 500(24.3) 1 303(21.2) 1 207(18.8) 1 189(18.8) 68.22 < 0.001 饮酒b 1 201(19.5) 1 188(19.3) 1 247(19.4) 1 185(18.7) 0.91 0.341 体力活动达到推荐水平者b 3 350(54.3) 4 029(65.4) 4 513(70.3) 4 509(71.2) 425.93 < 0.001 高血压家族史b 2 240(36.3) 1 997(32.4) 1 734(27.0) 1 798(28.4) 123.98 < 0.001 糖尿病b 644(10.9) 633(10.6) 588(9.5) 569(9.2) 11.97 < 0.001 高胆固醇血症b 180(3.0) 280(4.7) 346(5.6) 297(4.8) 26.94 < 0.001 SBP [(x±s), mm Hg)]a 147.3±17.4 150.2±18.8 151.8±19.6 151.9±19.1 82.56 < 0.001 DBP [(x±s), mm Hg)]a 87.3±10.2 89.3±10.5 89.5±10.8 90.5±10.6 99.73 < 0.001 红肉摄入≥75 g/db 400(6.5) 586(9.5) 655(10.2) 393(6.2) 0.02 0.896 豆类摄入≥125 g/db 175(2.8) 245(4.0) 226(3.5) 479(7.6) 137.86 < 0.001 鱼肉摄入≥200 g/周b 1 799(29.2) 1 684(27.4) 1 426(22.2) 1 207(19.1) 213.04 < 0.001 注:a连续变量用(x±s)表示,采用方差分析检验,统计量为F值;b分类变量用例数(%)表示,采用χ2检验,统计量为χ2值。水果摄入占比(%)=水果摄入量/总果蔬摄入量×100。  下载: 导出CSV
表 2 高血压患者中果蔬摄入量达标与血压进展的关联关系
Table 2. Associations of meeting the recommended level of fruit and vegetable consumption with blood pressure progression among hypertensive patients
变量 摄入量(g/d) 进展例数/暴露例数 进展率(%) OR (95% CI)值 模型1 模型2 模型3 总果蔬 未达标 < 500 2 664/14 296 18.6 1.00 1.00 1.00 达标 ≥500 1 448/10 784 13.4 0.84(0.78~0.90) 0.83(0.77~0.90) 0.83(0.77~0.90) 水果 未达标 < 200 3 703/21 885 16.9 1.00 1.00 1.00 a 达标 ≥200 409/3 195 12.8 0.92(0.82~1.03) 0.92(0.82~1.04) 0.94(0.83~1.06) a 蔬菜 未达标 < 300 2 097/10 323 20.3 1.00 1.00 1.00 b 达标 ≥300 2 015/14 757 13.7 0.79(0.74~0.85) 0.80(0.74~0.87) 0.81(0.75~0.87) b 注:模型1:调整年龄、性别、南北、教育水平、随访时长;模型2:模型1+调整BMI、糖尿病、高胆固醇血症、高血压家族史、基线SBP;模型3:模型2+调整红肉、豆类、鱼类、吸烟、饮酒、体力活动水平;a模型3+调整蔬菜;b模型3+调整水果。
下载: 导出CSV
表 3 高血压患者中果蔬摄入量与血压进展的关联关系
Table 3. Associations of fruit and vegetable consumption with blood pressure progression among hypertensive patients
项目 Q1 Q2 Q3 Q4 χ趋势2值 P值 摄入每增加100 g/d 总果蔬 摄入量(g/d) < 266.7 266.7~435.6 435.7~549.9 ≥550.0 — — — 进展例数/暴露例数 1 413/6 169 1 024/6 158 908/6 423 767/6 330 — — — 进展率(%) 22.9 16.6 14.1 12.1 — — — OR (95% CI)值 模型1 1.00 0.86(0.78~0.95) 0.76(0.69~0.84) 0.68(0.61~0.76) 53.99 < 0.001 0.96(0.94~0.97) 模型2 1.00 0.84(0.76~0.93) 0.76(0.68~0.84) 0.68(0.61~0.76) 47.99 < 0.001 0.95(0.94~0.97) 模型3 1.00 0.86(0.78~0.95) 0.77(0.69~0.86) 0.69(0.61~0.77) 43.02 < 0.001 0.96(0.94~0.98) 水果 摄入量(g/d) < 16.7 16.7~42.8 42.9~99.9 ≥100.0 — — — 进展例数/暴露例数 1 324/5 827 1 135/6 647 667/5 304 986/7 302 — — — 进展率(%) 22.7 17.1 12.6 13.5 — — — OR (95% CI)值 模型1 1.00 0.87(0.79~0.96) 0.68(0.61~0.76) 0.80(0.72~0.88) 16.78 < 0.001 0.96(0.92~1.00) 模型2 1.00 0.88(0.79~0.97) 0.69(0.61~0.77) 0.80(0.72~0.89) 13.66 < 0.001 0.96(0.92~1.00) 模型3a 1.00 0.90(0.82~1.00) 0.72(0.64~0.81) 0.84(0.76~0.94) 7.51 0.006 0.97(0.93~1.01) 蔬菜 摄入量(g/d) < 250.0 250.0~349.9 350.0~499.9 ≥500.0 — — — 进展例数/暴露例数 1 211/5 370 1 168/6 841 751/6 070 982/6 799 — — — 进展率(%) 22.6 17.1 12.4 14.4 — — — OR (95% CI)值 模型1 1.00 0.90(0.82~0.99) 0.73(0.65~0.81) 0.77(0.70~0.86) 33.96 < 0.001 0.95(0.93~0.97) 模型2 1.00 0.88(0.80~0.98) 0.75(0.66~0.84) 0.76(0.68~0.84) 31.76 < 0.001 0.95(0.93~0.97) 模型3b 1.00 0.90(0.81~0.99) 0.77(0.68~0.87) 0.76(0.68~0.85) 28.58 < 0.001 0.95(0.93~0.97) 注:模型1:调整年龄、性别、南北、教育水平、随访时长;模型2:模型1+调整BMI、糖尿病、高胆固醇血症、高血压家族史、基线SBP;模型3:模型2+调整红肉、豆类、鱼类、吸烟、饮酒、体力活动水平;a模型3+调整蔬菜;b模型3+调整水果。
下载: 导出CSV
表 4 未服降压药高血压患者中果蔬摄入量与血压进展关联关系的敏感性分析
Table 4. Sensitivity analyses for the associations of fruit and vegetable consumption with blood pressure progression among hypertensive patients without taking anti-hypertensive medications
项目 Q1 Q2 Q3 Q4 χ趋势2值 P值 摄入每增加100 g/d 总果蔬 摄入量(g/d) < 266.7 266.7~435.6 435.7~549.9 ≥550.0 — — — 进展例数/暴露例数 184/1 661 198/2 129 188/2 469 183/2 475 — — — 进展率(%) 11.1 9.3 7.6 7.4 — — — OR (95% CI)值 模型1 1.00 0.81 (0.64~1.02) 0.65 (0.51~0.82) 0.63 (0.49~0.80) 16.89 < 0.001 0.93 (0.89~0.98) 模型2 1.00 0.81 (0.64~1.02) 0.66 (0.52~0.85) 0.62 (0.49~0.80) 16.09 < 0.001 0.94 (0.89~0.98) 模型3 1.00 0.87 (0.69~1.11) 0.74 (0.58~0.95) 0.68 (0.53~0.88) 10.40 0.001 0.95 (0.91~0.99) 水果 摄入量(g/d) < 16.7 16.7~42.8 42.9~99.9 ≥100.0 — — — 进展例数/暴露例数 176/1 607 194/2 192 143/1 955 240/2 980 — — — 进展率(%) 11.0 8.9 7.3 8.1 — — — OR (95% CI)值 模型1 1.00 0.80 (0.64~1.00) 0.66 (0.51~0.85) 0.70 (0.56~0.88) 6.22 0.013 0.92 (0.84~1.02) 模型2 1.00 0.80 (0.64~1.01) 0.66 (0.52~0.85) 0.72 (0.57~0.91) 4.77 0.029 0.94 (0.85~1.03) 模型3a 1.00 0.84 (0.67~1.06) 0.71 (0.55~0.92) 0.81 (0.63~1.03) 1.46 0.228 0.97 (0.89~1.06) 蔬菜 摄入量(g/d) < 250.0 250.0~349.9 350.0~499.9 ≥500.0 — — — 进展例数/暴露例数 171/1 464 205/2 386 201/2 567 176/2 317 — — — 进展率(%) 11.7 8.6 7.8 7.6 — — — OR (95% CI)值 模型1 1.00 0.69 (0.55~0.87) 0.61 (0.48~0.78) 0.63 (0.49~0.80) 11.36 < 0.001 0.93 (0.88~0.98) 模型2 1.00 0.70 (0.56~0.89) 0.61 (0.48~0.79) 0.63 (0.49~0.80) 11.90 < 0.001 0.93 (0.88~0.98) 模型3b 1.00 0.75 (0.59~0.95) 0.69 (0.53~0.89) 0.66 (0.52~0.85) 8.51 0.004 0.94 (0.89~0.99) 注:模型1:调整年龄、性别、南北、教育水平、随访时长;模型2:模型1+调整BMI、糖尿病、高胆固醇血症、高血压家族史和基线SBP;模型3:模型2+调整红肉、豆类、鱼类、吸烟、饮酒和体力活动水平;a模型3+调整蔬菜;b模型3+调整水果。
下载: 导出CSV
-
[1] Global Burden of Disease. GBD Compare[EB/OL]. (2020-10-15)[2020-11-07]. https://vizhub.healthdata.org/gbd-compare/. [2] Wang Z, Chen Z, Zhang L, et al. Status of hypertension in China: results from the China hypertension survey, 2012-2015[J]. Circulation, 2018, 137(22): 2344-2356. DOI: 10.1161/circulationaha.117.032380. [3] 中华人民共和国国家卫生和计划生育委员会. 中国居民营养与慢性病状况报告(2015)[M]. 北京: 人民卫生出版社, 2015.National Health and Family Planning Commission of the People's Republic of China. Report on the Status of Nutrition and Chronic Diseases of Chinese Residents 2015[M]. Beijing: People's Medical Publishing House, 2015. [4] 中国营养学会. 中国居民膳食指南(2016)[M]. 北京: 人民卫生出版社, 2016.The Chinese Nutrition Society. Chinese Dietary Guidelines (2016)[M]. Beijing: People's Medical Publishing House, 2016. [5] He Y, Li Y, Yang X, et al. The dietary transition and its association with cardiometabolic mortality among Chinese adults, 1982-2012: a cross-sectional population-based study[J]. Lancet Diabetes Endocrinol, 2019, 7(7): 540-548. DOI: 10.1016/s2213-8587(19)30152-4. [6] 中国高血压防治指南修订委员会, 高血压联盟(中国), 中华医学会心血管病学分会, 等. 中国高血压防治指南(2018年修订版)[J]. 中国心血管杂志, 2019, 24(1): 24-56. DOI: 10.3969/j.issn.1007-5410.2019.01.002.Writing Group of 2018 Chinese Guidelines for the Management of Hypertension, Chinese Hypertension League, Chinese Society of Cardiology, et al. 2018 Chinese guidelines for the management of hypertension[J]. Chin J Cardiovasc Med, 2019, 24(1): 24-56. DOI: 10.3969/j.issn.1007-5410.2019.01.002. [7] Appel LJ, Moore TJ, Obarzanek E, et al. A clinical trial of the effects of dietary patterns on blood pressure. DASH Collaborative Research Group[J]. N Engl J Med, 1997, 336(16): 1117-1124. DOI: 10.1056/NEJM199704173361601. [8] Appel LJ, Champagne CM, Harsha DW, et al. Effects of comprehensive lifestyle modification on blood pressure control: main results of the PREMIER clinical trial[J]. JAMA, 2003, 289(16): 2083-2093. DOI: 10.1001/jama.289.16.2083. [9] 巩欣媛, 陈纪春, 李建新, 等. 中国农村地区成年人体力活动与高血压发病的关系[J]. 中华预防医学杂志, 2018, 52(6): 615-621. DOI: 10.3760/cma.j.issn.0253-9624.2018.06.010.Gong XY, Chen JC, Li JX, et al. The relationship between physical activity and incident hypertension in rural Chinese[J]. Chin J Prev Med, 2018, 52(6): 615-621. DOI: 10.3760/cma.j.issn.0253-9624.2018.06.010. [10] 中华预防医学会, 中华预防医学会心脏病预防与控制专业委员会, 中华医学会糖尿病学分会, 等. 中国健康生活方式预防心血管代谢疾病指南[J]. 中国循环杂志, 2020, 35(3): 209-230. DOI: 10.3969/j.issn.1000-3614.2020.03.001.Chinese Preventive Medicine Association, Branch of Heart Disease Prevention and Control, Chinese Preventive Medicine Association, Chinese Diabetes Society, et al. Chinese guideline on healthy lifestyle to prevent cardiometabolic diseases[J]. Chin Circ J, 2020, 35(3): 209-230. DOI: 10.3969/j.issn.1000-3614.2020.03.001. [11] Piercy KL, Troiano RP, Ballard RM, et al. The physical activity guidelines for Americans[J]. JAMA, 2018, 320(19): 2020-2028. DOI: 10.1001/jama.2018.14854. [12] Cui JS, Hopper JL, Harrap SB. Antihypertensive treatments obscure familial contributions to blood pressure variation[J]. Hypertension, 2003, 41(2): 207-210. DOI: 10.1161/01.hyp.0000044938.94050.e3. [13] Altman DG, Bland JM. Interaction revisited: the difference between two estimates[J]. BMJ, 2003, 326(7382): 219. DOI: 10.1136/bmj.326.7382.219. [14] Dauchet L, Kesse-Guyot E, Czernichow S, et al. Dietary patterns and blood pressure change over 5-y follow-up in the SU.VI.MAX cohort[J]. Am J Clin Nutr, 2007, 85(6): 1650-1656. DOI: 10.1093/ajcn/85.6.1650. [15] Stefler D, Malyutina S, Nikitin Y, et al. Fruit, vegetable intake and blood pressure trajectories in older age[J]. J Hum Hypertens, 2019, 33(9): 671-678. DOI: 10.1038/s41371-019-0189-8. [16] Conlin PR, Chow D, Miller ER, et al. The effect of dietary patterns on blood pressure control in hypertensive patients: results from the Dietary Approaches to Stop Hypertension (DASH) trial[J]. Am J Hypertens, 2000, 13(9): 949-955. DOI: 10.1016/s0895-7061(99)00284-8. [17] Penton D, Czogalla J, Loffing J. Dietary potassium and the renal control of salt balance and blood pressure[J]. Pflugers Arch, 2015, 467(3): 513-530. DOI: 10.1007/s00424-014-1673-1. [18] Thomas T. Inhibitors of Na+/Mg2+ exchange activity attenuate the development of hypertension in angiotensin Ⅱ-induced hypertensive rats[J]. J Hypertens, 2003, 21(2): 257-258. DOI: 10.1097/00004872-200302000-00011. [19] Lopes HF, Martin KL, Nashar K, et al. DASH diet lowers blood pressure and lipid-induced oxidative stress in obesity[J]. Hypertension, 2003, 41(3): 422-430. DOI: 10.1161/01.hyp.0000053450.19998.11. [20] Grundy SM. Inflammation, hypertension, and the metabolic syndrome[J]. JAMA, 2003, 290(22): 3000-3002. DOI: 10.1001/jama.290.22.3000. [21] Yuan S, Yu HJ, Liu MW, et al. Fat intake and hypertension among adults in China: the modifying effects of fruit and vegetable intake[J]. Am J Prev Med, 2020, 58(2): 294-301. DOI: 10.1016/j.amepre.2019.09.004. -

 点击查看大图
计量
- 文章访问数: 403
- HTML全文浏览量: 298
- PDF下载量: 88
- 被引次数: 0