

Analysis and model prediction of disease burden attributable to various risk factors for colorectal cancer in China from 1990 to 2019
-
摘要:
目的 分析1990—2019年中国结直肠癌(colorectal cancer, CRC)归因于各类危险因素的疾病负担变化趋势并对其未来10年的变化进行预测,为CRC的精准防控提供参考依据。 方法 利用2019年全球疾病负担(Globad Burden of Disease, GBD)研究数据,采用Joinpoint估算年度变化百分比(annual percentage of change, APC)和平均年度变化百分比(average annual percentage of change, AAPC)来反映中国CRC疾病负担的时间变化趋势;描述1990年和2019年中国CRC归因于各类危险因素的疾病负担,比较不同年龄段人群的主要危险因素及其变化速率;通过R 4.0.2软件创建自回归滑动平均混合模型(autoregressive integrated moving average model, ARIMA),预测未来10年中国CRC归因于各类危险因素的疾病负担情况。 结果 1990—2019年中国CRC归因于危险因素的伤残调整寿命年(disability adjusted life years, DALYs)率整体呈上升趋势,各年份男性DALYs率均高于女性,且随着时间的变化,差距逐渐增大。中国CRC归因于各类危险因素的疾病负担随着年龄的增长呈上升趋势。1990年钙摄入不足是造成中国CRC疾病负担的首要危险因素,而2019年是牛奶摄入不足。30年间中国CRC归因于各类危险因素的标化DALYs率上升最快的危险因素是高BMI,而下降最快的是纤维摄入不足。ARIMA预测,未来10年,牛奶摄入不足仍然是造成中国CRC疾病负担的首要危险因素。 结论 1990—2019年中国CRC归因于各类危险因素的疾病负担总体呈上升趋势;牛奶摄入不足是当前及未来10年造成中国CRC疾病负担的首要危险因素;中老年和男性是重点关注人群,建议针对其相关危险因素采取控制措施以降低CRC疾病负担。 Abstract:Objective Provide references basis for the accurate prevention and control of colorectal cancer through the analysis of the change trend of disease burden attributed to various risk factors of colorectal cancer in China from 1990 to 2019 and the prediction of changes in the next 10 years. Methods Based on the Globad Burden of Disease Study 2019 research data, Joinpoint estimated annual percentage of change (APC) and average annual percentage of change (AAPC) were used to reflect the time trend of disease burden of colorectal cancer. To compare the main risk factors and their change rates of different age groups, we described the disease burden attributed to various risk factors of CRC in China in 1990 and 2019. The autoregressive integrated moving average (ARIMA) model was established by R 4.0.2 to predict the disease burden of colorectal cancer attributed to various risk factors in China in the next 10 years. Results The disability adjusted life years (DALYs) rate of colorectal cancer attributed to risk factors in China showed an overall upward trend from 1990 to 2019. The DALYs rate of male was higher than that of female in each year, and the gap increased gradually with the change of time; The burden of disease attributed to various risk factors for colorectal cancer in China basically increased with the increase of age. Diet low in calcium was the primary risk factor for the disease burden of colorectal cancer in China in 1990, while diet low in milk in 2019. During the last 30 years, the corresponding risk factor of the most rapid increase in standardized DALYs rates attributed to various risk factors for colorectal cancer in China was high BMI, while the most rapid decrease was diet low in fiber. The model prediction found that diet low in milk will be still the primary risk factor for the disease burden of colorectal cancer in China in the next 10 years. Conclusions From 1990 to 2019, the disease burden of colorectal cancer attributed to various risk factors in China showed an overall upward trend. Diet low in milk is the most critical risk factor for the disease burden of colorectal cancer in China at present and in the next 10 years. Middle-aged and older adults, as well as male people are the key population for prevention and control. It is suggested that intervention is formulated to control the prevalence of risk factors and further measures should be taken to reduce the disease burden of colorectal cancer. -
Key words:
- Colorectal cancer /
- DALYs /
- Disease burden /
- Risk factors /
- Prediction
-

图 1 1990—2019年中国CRC归因于各类危险因素的DALYs率变化趋势
Figure 1. Trend of DALYs rate of colorectal cancer attributed to various risk factors in China from 1990 to 2019

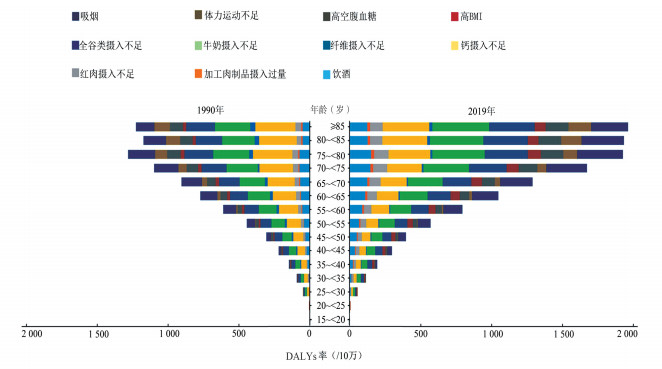
图 2 1990和2019年中国结直肠癌各年龄段人群归因于各类危险因素的DALYs率变化趋势
Figure 2. The change trend of DALYs rate attributed to various risk factors of colorectal cancer in China in 1990 and 2019
表 1 1990—2019年中国CRC归因于各类危险因素DALYs率的Joinpoint结果(/10万)
Table 1. Joinpoint results of DALYs rate attributed to various risk factors for colorectal cancer in China from 1990 to 2019 (/100 000)
性别 粗DALYs率 标化DALYs率 年份(年) APC(95% CI)值 t值 P值 年份(年) APC(95% CI)值 t值 P值 男性 1 1990—1996 1.53(1.31~1.76) 14.71 < 0.001 1990—1996 0.03(-0.26~0.33) 0.24 0.812 2 1996—1999 3.87(2.50~5.25) 6.20 < 0.001 1996—1999 1.77(-0.01~3.58) 2.15 0.051 3 1999—2004 9.03(8.57~9.48) 44.64 < 0.001 1999—2004 6.18(5.59~6.77) 23.26 < 0.001 4 2004—2011 4.34(4.11~4.58) 41.07 < 0.001 2004—2011 1.89(1.59~2.19) 13.60 < 0.001 5 2011—2017 1.49(1.20~1.80) 10.84 < 0.001 2011—2017 -0.65(-1.04~-0.26) -3.58 0.003 6 2017—2019 4.45(3.08~5.84) 7.12 < 0.001 2017—2019 2.32(0.53~4.13) 2.81 0.015 AAPC(95% CI)值 1990—2019 3.91(3.71~4.10) 40.86 < 0.001 1990—2019 1.71(1.46~1.96) 13.59 < 0.001 女性 1 1990—1997 1.06(0.95~1.17) 21.73 < 0.001 1990—1998 -0.75(-0.89~-0.61) -11.48 < 0.001 2 1997—2001 2.92(2.52~3.33) 15.86 < 0.001 1998—2001 1.45(0.14~2.77) 2.40 0.032 3 2001—2004 4.57(3.76~5.40) 12.32 < 0.001 2001—2004 2.68(1.35~4.02) 4.40 0.001 4 2004—2011 1.98(1.85~2.12) 31.97 < 0.001 2004—2010 -0.28(-0.57~0.01) -2.10 0.055 5 2011—2016 0.37(0.12~0.62) 3.19 0.007 2010—2016 -2.03(-2.31~-1.75) -15.27 < 0.001 6 2016—2019 3.83(3.43~4.24) 20.72 < 0.001 2016—2019 1.19(0.53~1.85) 3.94 0.002 AAPC(95% CI)值 1990—2019 2.06(1.95~2.17) 36.41 < 0.001 1990—2019 -0.15 (-0.35~0.06) -1.42 0.156  下载: 导出CSV
表 2 1990—2019年中国CRC归因于各类危险因素的疾病负担
Table 2. Disease burden of colorectal cancer in China attributable to various risk factors from 1990 to 2019
危险因素(TMREL) 1990年 2019年 1990—2019年 DALYs(万人年) 标化DALYs率
(/10万)DALYs(万人年) 标化DALYs率
(/10万)标化DALYs率变化率(%) 全谷物摄入不足(140~160 g/d) 34.54 37.91 101.94 50.71 33.76 牛奶摄入不足(360~500 g/d) 42.09 46.39 122.24 60.81 31.07 红肉摄入过量(140~160 g/d) 7.93 8.53 41.70 20.57 141.03 加工肉制品摄入过量(0~22.5 g/d) 1.65 1.79 8.32 4.11 129.69 纤维摄入不足(21~22 g/d) 5.86 6.25 6.89 3.49 -44.23 体力运动不足(3 000~4 500 min/周) 5.68 7.69 17.09 9.11 18.38 钙摄入不足(1.06~1.10 g/d) 46.20 50.88 97.46 48.65 -4.39 吸烟 26.08 29.71 98.81 47.61 60.23 饮酒 16.97 17.79 66.24 32.51 82.75 高FPG(4.8~5.4 mmol/L) 10.42 12.48 39.53 19.55 56.58 高BMI(20~25 kg/m2) 5.31 5.68 37.61 18.45 225.15
下载: 导出CSV
表 3 2020—2029年中国CRC疾病负担归因于11种危险因素的预测结果
Table 3. Forecast of disease burden of colorectal cancer in China due to 11 risk factors from 2020 to 2029
因素 标化DALYs率(95% CI)值(/10万) 2020年 2021年 2022年 2023年 2024年 2025年 2026年 2027年 2028年 2029年 牛奶摄入不足 61.63
(60.57~62.70)62.23
(59.70~64.76)62.63
(58.43~66.83)62.89
(56.99~68.78)63.04
(55.52~70.57)63.13
(54.08~72.19)63.18
(52.72~73.65)63.21
(51.44~74.)63.22
(50.25~76.19)63.23
(49.14~77.32)钙摄入不足 48.91
(47.94~49.87)49.37
(47.39~51.35)49.98
(46.98~52.98)50.66
(46.73~54.59)51.35
(46.66~56.05)52.00
(46.73~57.28)52.56
(46.89~58.22)52.99
(47.10~58.87)53.27
(47.29~59.25)53.41
(47.41~59.42)全谷物摄入不足 51.42
(50.51~52.34)51.95
(49.79~54.11)52.32
(48.75~55.89)52.57
(47.56~57.57)52.72
(46.33~59.12)52.82
(45.12~60.53)52.89
(43.97~61.80)52.92
(42.87~62.97)52.95
(41.84~64.04)52.96
(40.89~65.03)吸烟 48.56
(47.55~49.56)49.33
(46.92~51.73)49.91
(45.87~53.95)50.34
(44.59~56.09)50.65
(43.20~58.09)50.86
(41.78~59.94)51.01
(40.39~61.64)51.12
(39.03~63.20)51.19
(37.73~64.65)51.24
(36.49~65.98)饮酒 33.42
(32.86~33.98)34.19
(32.89~35.48)34.83
(32.74~36.91)35.39
(32.57~38.21)35.91
(32.44~39.38)36.42
(32.39~40.45)36.93
(32.41~41.45)37.44
(32.49~42.39)37.96
(32.62~43.30)38.48
(32.79~44.18)高BMI 19.46
(19.20~19.71)20.48
(19.82~21.14)21.51
(20.32~22.70)22.54
(20.71~24.37)23.57
(21.01~26.13)24.60
(21.24~27.98)25.63
(21.39~29.88)26.67
(21.47~31.86)27.70
(21.49~33.91)28.73
(21.45~36.01)红肉摄入过量 21.20
(20.93~21.47)21.83
(21.17~22.50)22.46
(21.30~23.62)23.10
(21.36~24.83)23.73
(21.35~26.11)24.36
(21.27~27.46)24.99
(21.13~28.86)25.63
(20.93~30.31)26.26
(20.69~31.83)26.89
(20.40~33.38)高FPG 20.01
(19.44~20.58)20.37
(18.96~21.79)20.60
(18.21~22.99)20.71
(17.34~24.07)20.72
(16.47~24.96)20.68
(15.67~25.69)20.63
(14.97~26.29)20.58
(14.37~26.79)20.54
(13.86~27.22)20.52
(13.42~27.62)体力运动不足 9.28
(9.09~9.48)9.36
(8.89~9.83)9.35
(8.59~10.10)9.29
(8.29~10.30)9.23
(8.04~10.43)9.20
(7.86~10.53)9.18
(7.74~10.63)9.19
(7.66~10.72)9.20
(7.59~10.81)9.21
(7.53~10.90)加工肉制品摄入过量 4.23
(4.18~4.28)4.35
(4.21~4.48)4.46
(4.23~4.70)4.58
(4.22~4.94)4.70
(4.21~5.19)4.82
(4.18~5.46)4.93
(4.13~5.73)5.05
(4.08~6.02)5.17
(4.02~6.32)5.29
(3.94~6.63)纤维摄入不足 3.42
(3.32~3.52)3.35
(3.11~3.59)3.27
(2.87~3.67)3.18
(2.61~3.75)3.09
(2.37~3.81)2.99
(2.13~3.86)2.90
(1.90~3.90)2.80
(1.68~3.92)2.71
(1.48~3.93)2.61
(1.28~3.94)
下载: 导出CSV
-
[1] NCD Countdown 2030 Collaborators. NCD Countdown 2030: worldwide trends in non-communicable disease mortality and progress towards Sustainable Development Goal target 3.4[J]. Lancet, 2018, 392(10152): 1072-1088. DOI: 10.1016/S0140-6736(18)31992-5. [2] 王宁, 刘硕, 杨雷, 等. 2018全球癌症统计报告解读[J]. 肿瘤综合治疗电子杂志, 2019, 5(1): 87-97. https://www.cnki.com.cn/Article/CJFDTOTAL-ZLZD201901013.htmWang N, Liu S, Yang L, et al. Interpretation on the report of global cancer statistics 2018[J]. Journal of Multidisciplinary Cancer Management (Electronic Version), 2019, 5(1): 87-97. https://www.cnki.com.cn/Article/CJFDTOTAL-ZLZD201901013.htm [3] 陈琼, 刘志才, 程兰平, 等. 2003-2007年中国结直肠癌发病与死亡分析[J]. 中国肿瘤, 2012, 21(3): 179-182. DOI: 10.3760/cma.j.issn.0253-3766.2017.09.012.Chen Q, Liu ZC, Cheng LP, et al. An analysis of incidence and mortality of colorectal cancer in China, 2003-2007[J]. Chin Cancer, 2012, 21(3): 179-182. DOI: 10.3760/cma.j.issn.0253-3766.2017.09.012. [4] 杜灵彬, 李辉章, 王悠清, 等. 2013年中国结直肠癌发病与死亡分析[J]. 中华肿瘤杂志, 2017, 39(9): 701-706. DOI: 10.3760/cma.j.issn.0253-3766.2017.09.012.Du LB, Li HZ, Wang YQ, et al. Report of colorectal cancer incidence and mortality in China, 2013[J]. Chin J Oncol, 2017, 39(9): 701-706. DOI: 10.3760/cma.j.issn.0253-3766.2017.09.012. [5] 吴春晓, 顾凯, 龚杨明, 等. 2015年中国结直肠癌发病和死亡情况分析[J]. 中国癌症杂志, 2020, 30(4): 241-245. DOI: 10.19401/j.cnki.1007-3639.2020.04.001.Wu CX, Gu K, Gong YM, et al. Analysis of incidence and mortality of colorectal cancer in China, 2015[J]. China Oncol, 2020, 30(4): 241-245. DOI: 10.19401/j.cnki.1007-3639.2020.04.001. [6] 张玥, 石菊芳, 黄慧瑶, 等. 中国人群结直肠癌疾病负担分析[J]. 中华流行病学杂志, 2015, 36(7): 709-714. DOI: 10.3760/cma.j.issn.0254-6450.2015.07.010.Zhang Y, Shi JF, Huang HY, et al. Burden of colorectal cancer in China[J]. Chin J Epidemiol, 2015, 36(7): 709-714. DOI: 10.3760/cma.j.issn.0254-6450.2015.07.010. [7] Devleesschauwer B, Havelaar AH, Maertens de noordhout C, et al. Calculating disability-adjusted life years to quantify burden of disease[J]. Int J Public Health, 2014, 59(3): 565-569. DOI: 10.1007/s00038-014-0552-z. [8] Murray CJL, Lopez AD. Measuring global health: motivation and evolution of the global burden of disease study[J]. Lancet, 2017, 390(10100): 1460-1464. DOI: 10.1016/S0140-6736(17)32367-X. [9] Global burden of 369 diseases and injuries in 204 countries and territories, 1990-2019: a systematic analysis for the global burden of disease study 2019[J]. Lancet, 2020, 396(10258): 1204-1222. DOI: 10.1016/S0140-6736(20)30925-9. [10] GBD 2019 Risk Factors Collaborators. Global burden of 87 risk factors in 204 countries and territories, 1990-2019: a systematic analysis for the global burden of disease study 2019[J]. Lancet, 2020, 396(10258): 1223-1249. DOI: 10.1016/S0140-6736(20)30752-2. [11] GBD 2017 Disease and Injury Incidence and Prevalence Collaborators. Global, regional, and national incidence, prevalence, and years lived with disability for 354 diseases and injuries for 195 countries and territories, 1990-2017: a systematic analysis for the global burden of disease study 2017[J]. Lancet, 2018, 392(10159): 1789-1858. DOI: 10.1016/S0140-6736(18)32279-7. [12] GBD 2017 Risk Factor Collaborators. Global, regional, and national comparative risk assessment of 84 behavioural, environmental and occupational, and metabolic risks or clusters of risks for 195 countries and territories, 1990-2017: a systematic analysis for the Global Burden of Disease Study 2017[J]. Lancet, 2018, 392(10159): 1923-1994. DOI: 10.1016/S0140-6736(18)32225-6. [13] 田国祥, 孙竹, 武云涛, 等. 1990-2017年中国缺血性心脏病归因于膳食因素的疾病负担分析[J]. 医学新知, 2020, 30(3): 227-232. DOI: 10.12173/j.issn.1004-5511.2020.03.08.Tian GX, Sun Z, Wu YT, et. al. Analysis of the disease burden of ischemic heart disease attributed to dietary factors in China from 1990 to 2017[J]. J New Med, 2020, 30(3): 227-232. DOI: 10.12173/j.issn.1004-5511.2020.03.08. [14] Kim HJ, Fay MP, Feuer EJ, et al. Permutation tests for joinpoint regression with applications to cancer rates[J]. Stat Med, 2000, 19(3): 335-351. DOI:10.1002/(sici)1097-0258(20000215)19:3<335::aid-sim336>3.0.co;2-z. [15] 王维华, 飒日娜, 邱琳, 等. 陕西省慢性病行为危险因素聚类特征分析[J]. 中国慢性病预防与控制, 2021, 29(1): 18-22, 28. DOI: 10.16386/j.cjpccd.issn.1004-6194.2021.01.004.Wang WH, Sa RN, Qiu L, et al. Analysis on clustering pattern of behavioral risk factors of chronic disease in Shanxi Province[J]. Chin J Prevent Control Chronic Dis, 2021, 29(1): 18-22, 28. DOI: 10.16386/j.cjpccd.issn.1004-6194.2021.01.004. [16] 徐海峰, 汤海英, 袁媛, 等. 上海市奉贤区慢性病及其危险因素监测[J]. 职业与健康, 2020, 36(20): 2802-2805, 2810. DOI: 10.13329/j.cnki.zyyjk.2020.0740.Xu HF, Tang HY, Yuan Y, et al. Monitoring of chronic diseases and its risk factors in Fengxian district of Shanghai[J]. Occup Health, 2020, 36(20): 2802-2805, 2810. DOI: 10.13329/j.cnki.zyyjk.2020.0740. [17] Vieira AR, Abar L, Chan DSM, et al. Foods and beverages and colorectal cancer risk: a systematic review and meta-analysis of cohort studies, an update of the evidence of the wcrfaicr continuous update project[J]. Ann Oncol, 2017, 28(8): 1788-1802. DOI: 10.1093/annonc/mdx171. [18] Chen K, Jiang Q, Ma X, et al. Alcohol drinking and colorectal cancer: a population-based prospective cohort study in China[J]. Eur J Epidemiol, 2005, 20(2): 149-154. DOI: 10.1007/s10654-004-2953-4. [19] Shin A, Li H, Shu XO, et al. Dietary intake of calcium, fiber and other micronutrients in relation to colorectal cancer risk: results from the Shanghai women's health study[J]. Int J Cancer, 2006, 119(12): 2938-2942. DOI: 10.1002/ijc.22196. [20] Wang Y, Jia X, Du W, et al. Dairy consumption characteristics among Chinese adult residents from 1989 to 2011[J]. Wei Sheng Yan Jiu, 2017, 46(3): 409-433. [21] Wang ZQ, Zhang L, Guo WB, et al. Burden of colorectal cancer attributable to diet low in milk in China, 1990-2017: findings from the global burden of disease study 2017[J]. Hum Nutr Diet, 2021, 34(1): 233-242. DOI: 10.1111/jhn.12836. [22] Aune D, Lau R, Chan DSM, et al. Dairy products and colorectal cancer risk: a systematic review and meta-analysis of cohort studies[J]. Ann Oncol, 2012, 23(1): 37-45. DOI: 10.1093/annonc/mdr269. [23] Ralston RA, Truby H, Palermo CE, et al. Colorectal cancer and nonfermented milk, solid ch-eese, and fermented milk consumption: a systematic review and meta-analysis of prospective studies[J]. Crit Rev Food Sci Nutr, 2014, 54(9): 1167-1179. DOI: 10.1080/10408398.2011.629353. [24] Barrubés L, Babio N, Becerra-Tomás N, et al. Association between dairy product consumption and colorectal cancer risk in adults: a systematic review and meta-analysis of epidemiologic studies[J]. Adv Nutr, 2019, 10(2): 190-211. DOI: 10.1093/advances/nmy114. [25] Norat T, Riboli E. Dairy products and colorectal cancer. a review of possible mechanisms and epidemiological evidence[J]. Eur J Clin Nutr, 2003, 57(1): 1-17. DOI: 10.1038/sj.ejcn.1601522. [26] Wang XJ, Jiang CQ, Zhang WS, et al. Milk consumption and risk of mortality from all-cause, cardiovascular disease and cancer in older people[J]. Clin Nutr, 2020, 39(11): 3442-3451. DOI: 10.1016/j.clnu.2020.03.003. [27] Alegria-Lertxundi I, Aguirre C, Bujanda L, et al. Food groups, diet quality and colorectal cancer risk in the Basque country[J]. World J Gastroenterol, 2020, 26(28): 4108-4125. DOI: 10.3748/wjg.v26.i28.4108. [28] 朱明胜, 陈莲芬. 2012-2017年三亚市健康管理老年人超重和肥胖流行趋势分析[J]. 中国慢性病预防与控制, 2019, 27(9): 676-679. DOI: 10.16386/j.cjpccd.issn.1004-6194.2019.09.009.Zhu MS, Chen LF. Analysis of the prevalence trend of overweight and obesity among the elderly under health management in Sanya City from 2012 to 2017[J]. Chin J Prev Control Chronic Non-Commun Dis, 2019, 27(9): 676-679. DOI: 10.16386/j.cjpccd.issn.1004-6194.2019.09.009. [29] 王维华, 冯刘欣, 邱琳, 等. 2007-2015年陕西省成年居民BMI的变化情况[J]. 中华疾病控制杂志, 2019, 23(7): 763-768. DOI: 10.16462/j.cnki.zhjbkz.2019.07.005.Wang WH, Feng LX, Qiu L, et al. Analysis on trends in BMI among adults in Shanxi province from 2007 to 2015[J]. Chin J Dis Control Prev, 2019, 23(7): 763-768. DOI: 10.16462/j.cnki.zhjbkz.2019.07.005. [30] Santarelli RL, Pierre F, Corpet DE. Processed meat and colorectal cancer: a review of epide-miologic and experimental evidence[J]. Nutr Cancer, 2008, 60(2): 131-144. DOI: 10.1080/01635580701684872. [31] Jeyakumar A, Dissabandara L, Gopalan V. A critical overview on the biological and molecular features of red and processed meat in colorectal carcinogenesis[J]. Gastroenterol, 2017, 52(4): 407-418. DOI: 10.1007/s00535-016-1294-x. [32] Zhai FY, Du SF, Wang ZH, et al. Dynamics of the Chinese diet and the role of urbanicity, 1991-2011[J]. Obes Rev, 2014, 1(1): 16-26. -

 点击查看大图

计量
- 文章访问数: 595
- HTML全文浏览量: 311
- PDF下载量: 221
- 被引次数: 0