

Evaluation of healthy-adjusted life expectancy in Beijing City, China: A comparative study of three calculating methods
-
摘要:
目的 应用三种方法测算北京市≥15岁居民健康期望寿命(healthy-adjusted life expectancy, HALE),评价北京市人群健康状况。 方法 收集北京市居民死因监测数据、北京市居民死因漏报调查数据、北京市居民自报健康调查数据和全球疾病负担研究(Global Burden of Disease Study, GBD)中北京市因伤残导致的寿命损失(years lived with disability, YLD)数据,计算自评伤残测度、HOPIT模型(Hierarchical ordered probit model)校正伤残测度和GBD伤残测度,通过沙利文(Sullivan)方法分别测算北京市≥15岁居民自评健康寿命年(healthy life years, HLY)、HOPIT模型校正的健康期望寿命(HALE_HOPIT)和GBD健康期望寿命(HALE_GBD)。 结果 北京市2015年,15~<20岁组居民期望寿命(life expectancy, LE)为67.7岁,HLY、HALE_HOPIT和HALE_GBD分别为51.9岁、44.1岁和57.8岁。在不同性别、各个年龄组均为HALE_GBD>HLY>HALE_HOPIT。HLY、HALE_HOPIT和HALE_GBD均随着年龄增长呈下降趋势。所有年龄组女性HLY和HALE_GBD均高于男性, < 80岁女性组HALE_HOPIT也高于男性,但≥80岁女性组HALE_HOPIT略低于男性。 结论 三种HALE测算结果存在较大差异,但性别、年龄趋势一致,均揭示北京市≥15岁居民因伤残损失较多的健康寿命年。三种测算结果的不同与对“健康”测量方法不同有关,仍需持续开展相关调查研究。 -
关键词:
- 健康期望寿命 /
- 自评健康寿命年 /
- HOPIT模型 /
- Sullivan方法
Abstract:Objective To calculate the level of healthy-adjusted life expectancy (HALE) using three calculating methods, and assess the health status of residents aged ≥15 years in Beijing City. Methods This research collected the surveillance data of death causes, missing reports of death causes, data of self-reported health status survey and data of years lived with disability (YLD) from the Global Burden of Disease Study (GBD). These data were used to calculate self-reported disability weight, Hierarchical ordered probit model (HOPIT)-adjusted disability weight and GBD disability weight. And then Sullivan method was used to calculate healthy life years (HLY), HOPIT healthy-adjusted life expectancy (HALE_HOPIT), and GBD healthy-adjusted life expectancy (HALE_GBD) among residents aged ≥15 years in Beijing City. Results The life expectancy (LE) of residents aged 15- < 20 years was 67.7 years, and HLY, HALE_HOPIT, and HALE_GBD were 51.9 years, 44.1 years, and 57.8 years, respectively. The study observed HALE_GBD > HLY > HALE_HOPIT in any gender or age group. HLY, HALE_HOPIT, and HALE_GBD decreased with age. HLY and HALE_GBD in female residents were higher than male residents in all age groups. HALE_HOPIT in females was higher than in males among residents under 80 years of age, and HALE_HOPIT in females was slightly lower than in males among residents aged ≥80 years. Conclusions The calculating values of HALE using three methods were significantly different, but the trends were consistent across other gender and age groups. The results revealed that there were many years of healthy life lost due to disability among residents aged ≥15 years in Beijing City. The different effects across the three methods are related to the differences in health measurement. Thus, we should continuously carry out further investigations and researches. -

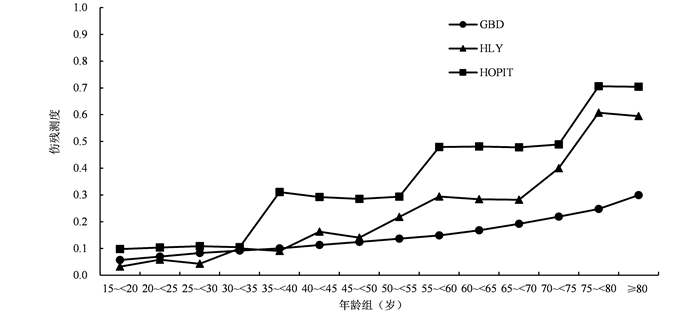
图 1 北京市居民自评伤残测度、HOPIT模型校正伤残测度和GBD伤残测度
Figure 1. Self-reported disability weight, HOPIT model-adjusted disability weight, and GBD disability weight among residents in Beijing City

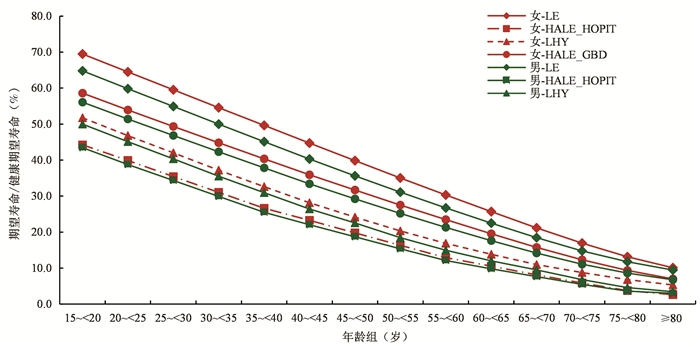
图 2 2015年北京市居民LE、HLY、HALE_HOPIT、HALE_GBD及其性别比较
Figure 2. Healthy life years, HOPIT healthy-adjusted life expectancy, and GBD healthy-adjusted life expectancy by gender and age groups among residents in Beijing City, 2015
表 1 2015年北京市居民HLY及其性别比较
Table 1. Healthy life years by gender and age groups among residents in Beijing City, 2015
年龄组
(岁)全部(岁) LHE/LE(%) 女性(岁) LHE/LE(%) 男性(岁) LHE/LE(%) LE HLY LHE LE HLY LHE LE HLY LHE 15~<20 67.7 51.9 15.8 23.4 69.5 53.2 16.2 23.4 64.8 50.3 14.5 22.3 20~<25 62.7 47.1 15.7 25.0 64.5 48.4 16.1 25.0 59.8 45.6 14.3 23.8 25~<30 57.8 42.4 15.4 26.6 59.5 43.8 15.8 26.5 54.9 40.9 14.1 25.6 30~<35 52.8 37.7 15.2 28.7 54.6 39.0 15.6 28.5 50.0 36.1 13.9 27.7 35~<40 47.9 33.2 14.7 30.7 49.6 34.6 15.1 30.4 45.1 31.7 13.4 29.7 40~<45 43.0 28.8 14.3 33.2 44.7 30.0 14.7 32.8 40.3 27.3 13.0 32.2 45~<50 38.3 24.7 13.5 35.4 39.9 25.8 14.0 35.2 35.6 23.5 12.1 34.1 50~<55 33.6 20.6 13.0 38.6 35.1 21.7 13.3 38.0 31.1 19.4 11.7 37.6 55~<60 29.0 17.0 12.1 41.5 30.3 17.9 12.4 40.8 26.7 15.9 10.8 40.5 60~<65 24.6 13.8 10.8 44.0 25.7 14.5 11.2 43.4 22.5 12.9 9.6 42.6 65~<70 20.3 10.6 9.7 47.9 21.2 11.0 10.2 48.1 18.5 10.1 8.4 45.3 70~<75 16.3 7.5 8.8 54.1 16.9 8.2 8.7 51.3 14.8 6.8 8.0 54.2 75~<80 12.9 5.2 7.7 59.9 13.1 6.3 6.9 52.3 11.8 4.2 7.6 64.6 ≥80 10.1 4.1 6.0 59.5 10.1 5.0 5.0 50.0 9.5 3.3 6.2 65.2  下载: 导出CSV
表 2 2015年北京市居民HALE_HOPIT及其性别比较
Table 2. HOPIT healthy-adjusted life expectancy by gender and age groups among residents in Beijing City, 2015
年龄组
(岁)全部(岁) LHE/LE(%) 女性(岁) LHE/LE(%) 男性(岁) LHE/LE(%) LE HLY LHE LE HLY LHE LE HLY LHE 15~<20 67.7 44.1 23.6 34.9 69.5 44.2 25.3 36.4 64.8 43.4 21.3 33.0 20~<25 62.7 39.6 23.1 36.9 64.5 39.9 24.6 38.1 59.8 38.8 21.1 35.2 25~<30 57.8 35.1 22.6 39.2 59.5 35.4 24.1 40.5 54.9 34.3 20.6 37.5 30~<35 52.8 30.7 22.1 41.9 54.6 31.0 23.6 43.2 50.0 29.9 20.1 40.2 35~<40 47.9 26.3 21.6 45.2 49.6 26.6 23.0 46.4 45.1 25.5 19.6 43.5 40~<45 43.0 22.9 20.1 46.8 44.7 23.3 21.5 48.0 40.3 22.0 18.3 45.3 45~<50 38.3 19.5 18.8 49.1 39.9 19.8 20.1 50.4 35.6 18.7 16.9 47.5 50~<55 33.6 16.1 17.5 52.2 35.1 16.3 18.7 53.4 31.1 15.3 15.8 50.7 55~<60 29.0 12.7 16.3 56.1 30.3 12.9 17.4 57.4 26.7 12.1 14.6 54.7 60~<65 24.6 10.4 14.2 57.8 25.7 10.5 15.2 59.0 22.5 9.8 12.7 56.4 65~<70 20.3 8.1 12.2 60.3 21.2 8.1 13.0 61.6 18.5 7.6 10.8 58.6 70~<75 16.3 5.8 10.5 64.2 16.9 5.9 11.0 65.3 14.8 5.5 9.3 63.0 75~<80 12.9 3.8 9.1 70.5 13.1 3.7 9.4 71.4 11.8 3.6 8.2 69.5 ≥80 10.1 3.0 7.1 70.4 10.1 2.6 7.5 74.3 9.5 3.0 6.5 68.4
下载: 导出CSV
表 3 2015年北京市居民HALE_HOPIT及其性别比较
Table 3. HOPIT healthy-adjusted life expectancy by gender and age groups among residents in Beijing City, 2015
年龄组
(岁)全部(岁) LHE/LE(%) 女性(岁) LHE/LE(%) 男性(岁) LHE/LE(%) LE HLY LHE LE HLY LHE LE HLY LHE 15~<20 67.7 57.8 9.9 14.6 69.5 58.6 10.9 15.7 64.8 56.1 8.7 13.4 20~<25 62.7 53.1 9.6 15.3 64.5 53.9 10.6 16.4 59.8 51.4 8.4 14.1 25~<30 57.8 48.5 9.3 16.1 59.5 49.3 10.2 17.1 54.9 46.8 8.1 14.7 30~<35 52.8 44.0 8.9 16.8 54.6 44.8 9.8 17.9 50.0 42.3 7.7 15.4 35~<40 47.9 39.5 8.4 17.6 49.6 40.3 9.3 18.8 45.1 37.8 7.3 16.2 40~<45 43.0 35.1 8.0 18.5 44.7 35.9 8.8 19.7 40.3 33.4 6.8 17.0 45~<50 38.3 30.8 7.4 19.4 39.9 31.7 8.2 20.6 35.6 29.2 6.4 17.9 50~<55 33.6 26.7 6.9 20.5 35.1 27.5 7.6 21.6 31.1 25.2 5.9 19.0 55~<60 29.0 22.8 6.3 21.6 30.3 23.5 6.9 22.6 26.7 21.3 5.4 20.3 60~<65 24.6 19.0 5.7 23.0 25.7 19.5 6.2 24.0 22.5 17.6 4.9 21.7 65~<70 20.3 15.3 5.0 24.6 21.2 15.8 5.4 25.5 18.5 14.2 4.3 23.3 70~<75 16.3 12.0 4.3 26.3 16.9 12.3 4.6 27.1 14.8 11.1 3.7 25.1 75~<80 12.9 9.3 3.6 28.1 13.1 9.3 3.8 28.8 11.8 8.6 3.2 27.0 ≥80 10.1 7.1 3.0 29.9 10.1 7.0 3.1 30.7 9.5 6.7 2.7 28.8
下载: 导出CSV
-
[1] Murray CJ, Salomon JA, Mathers C. A critical examination of summary measures of population health[J]. Bull World Health Organ, 2000, 78(8): 981-994. [2] World Health Organization. Health systems: improving performance[R]. Geneva: World Health Organization, 2000. [3] World Health Organization. The World Health Report 2001: Mental Health: New Understanding, New Hope[R]. Geneva: World Health Organization, 2001. [4] Mathers CD, Sadana R, Salomon JA, et al. Healthy life expectancy in 191 countries, 1999[J]. Lancet, 2001, 357(9269): 1685-1691. DOI: 10.1016/S0140-6736(00)04824-8. [5] 苏健婷, 杜婧, 王苹, 等. 北京市居民自报健康调查量表的信度效度分析[J]. 中国健康教育, 2017, 33(4): 316-320. DOI: 10.16168/j.cnki.issn.1002-9982.2017.04.007.Su JT, Du J, Wang P, et al. Study on reliability and validity of self-reported health scale for Beijing residents[J]. Chin J Health Education, 2017, 33(4): 316-320. DOI: 10.16168/j.cnki.issn.1002-9982.2017.04.007. [6] 苏健婷, 高燕琳, 韦再华, 等. 2011年北京市居民主要死亡原因对期望寿命的影响[J]. 中国慢性病预防与控制, 2013, 21(6): 755-757. DOI: 10.16386/j.cjpccd.issn.1004-6194.2013.06.010.Su JT, Gao YL, Wei ZH, et al. The impact of major causes of death on life expectancy of Beijing residents in 2011[J]. Chin J Prevent Control Chronic No-Communicable Dis, 2013, 21(6): 755-757. DOI: 10.16386/j.cjpccd.issn.1004-6194.2013.06.010. [7] 刘庆萍, 韦再华, 高燕琳, 等. 死亡监测数据完整性评估方法研究进展[J]. 首都公共卫生, 2017, 11(1): 11-13, 16. DOI: 10.16760/j.cnki.sdggws.2017.01.004.Liu QP, Wei ZH, Gao YL, et al. Research progress on the assessment methods for data integrity in death monitoring[J]. Cap J Public Health, 2017, 11(1): 11-13, 16. DOI: 10.16760/j.cnki.sdggws.2017.01.004. [8] GBD 2017 disease and injury incidence and prevalence collaborators. Global, regional, and national incidence, prevalence, and years lived with disability for 354 diseases and injuries for 195 countries and territories, 1990-2017: a systematic analysis for the global burden of disease study 2017[J]. Lancet, 2018, 392(10159): 1789-1858. DOI: 10.1016/S0140-6736(18)32279-7. [9] 王苹, 刘庆萍, 李刚, 等. 2012年北京市成人健康期望寿命测算及分析[J]. 中国卫生统计, 2016, 33(1): 75-77, 80. https://www.cnki.com.cn/Article/CJFDTOTAL-ZGWT201601022.htmWang P, Liu QP, Li G, et al. Estimation and analysis of healthy life expectancy of adults in Beijing, 2012[J]. Chin J Health Statistics, 2016, 33(1): 75-77, 80. https://www.cnki.com.cn/Article/CJFDTOTAL-ZGWT201601022.htm [10] World Health Organization. WHO methods and data sources for life tables 1990-2016[R]. Geneva: World Health Organization, 2018. [11] OECD/European Union. Health at a Glance: Europe 2016: State of Health in the EU Cycle[R]. Paris: OECD Publishing, 2016. [12] GBD 2017 DALYs and HALE Collaborators. Global, regional, and national disability-adjusted life-years (DALYs) for 359 diseases and injuries and healthy life expectancy (HALE) for 195 countries and territories, 1990-2017: a systematic analysis for the Global Burden of Disease Study 2017[J]. Lancet, 2018, 392(10159): 1859-1922. DOI: 10.1016/S0140-6736(18)32335-3. [13] Tandon A, Murray CJL, Salomon JA, et al. Statistical Models for Enhancing Cross-Population Comparability[EB/OL]. (2002-1-23)[2021-2-27]. https://www.who.int/healthinfo/paper42. [14] King G, Murray CJL Salomon JA, et al. Enhancing the validity and cross-cultural comparability of measurement in survey research[J]. Am Polit Sci Rev, 2003, 97(4): 191-207. DOI: 10.1007/978-3-531-91826-6_16. [15] O'Reilly D, Rosato M, Patterson C. Self reported health and mortality: ecological analysis based on electoral wards across the United Kingdom[J]. BMJ, 2005, 331(7522): 938-939. DOI: 10.1136/bmj.38594.490532.AE. [16] 费方荣, 胡如英, 王旭英, 等. 浙江省2016年成年人健康期望寿命测算研究[J]. 中华流行病学杂志, 2018, 39(9): 1249-1254. DOI: 10.3760/cma.j.issn.0254-6450.2018.09.020.Fei FR, Hu RY, Wang XY, et al. Estimation on the health life expectancy of adults in Zhejiang Province, 2016[J]. Chin J Epidemiol, 2018, 39(9): 1249-1254. DOI: 10.3760/cma.j.issn.0254-6450.2018.09.020. [17] 杨雅平, 刘庆敏, 任艳军, 等. 杭州市成人居民健康期望寿命的测算[J]. 中华疾病控制杂志, 2010, 14(12): 1171-1174. http://zhjbkz.ahmu.edu.cn/article/id/JBKZ201012000Yang YP, Liu QM, Ren YJ, et al. Calculation of adult residents' health-adjusted life expectancy in Hangzhou[J]. Chin J Dis Control Prev, 2010, 14(12): 1171-1174. http://zhjbkz.ahmu.edu.cn/article/id/JBKZ201012000 -

 点击查看大图
计量
- 文章访问数: 1568
- HTML全文浏览量: 218
- PDF下载量: 109
- 被引次数: 0