

-
摘要:
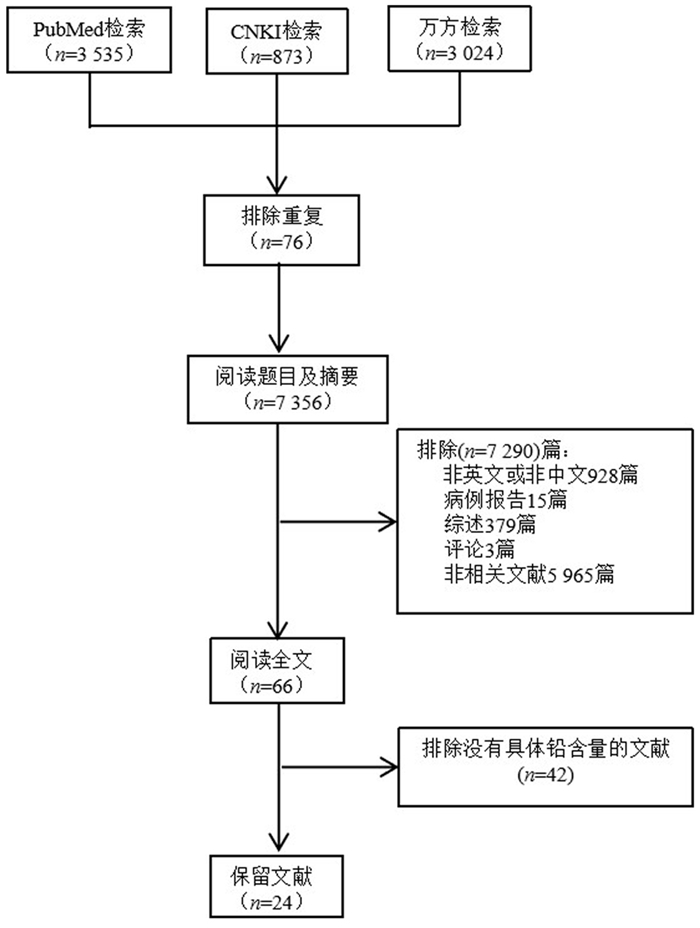
目的 评估中国成人经膳食途径摄入铅的健康风险。 方法 从各类文献数据库中系统搜集2012―2021年中国各个省份的膳食铅含量数据,结合2012年中国居民营养与健康状况监测数据,采用点评估及概率评估法计算中国成人居民经膳食摄入铅的暴露水平,并结合暴露限值(margin of exposure, MOE)和目标危害指数法(target hazard quotient, THQ)对潜在的健康风险进行评估。 结果 本研究共纳入了24篇文献,共收集了19个省的31 008份样本数据。铅浓度排名前3的食物为食用菌类(0.13 mg/kg)、蛋类(0.11 mg/kg)、鱼虾蟹贝类(0.08 mg/kg);中国成人膳食铅的70%以上是来源于谷物及其制品(0.39 μg·kg-1·d-1)、蔬菜类(0.22 μg·kg-1·d-1)、畜禽肉类(0.08 μg·kg-1·d-1);18~ < 60岁和≥60岁人群平均铅暴露量分别为1.07 μg·kg-1·d-1和1.02 μg·kg-1·d-1,各年龄性别组的平均膳食铅暴露均有MOE>1,P95均有MOE<1,各年龄性别组的膳食铅的平均暴露量和P95的THQ均<1。 结论 中国成人膳食铅的暴露风险总体较低,但部分高暴露人群仍面临一定的健康风险,需要继续监测和控制膳食铅暴露的危害。 Abstract:Objective To evaluate the health risk of lead via dietary intake among Chinese adults. Methods The data of dietary lead concentration from different provinces in China collected systematically from literature, combined with the nutrition and health monitoring data of Chinese adults in 2012, were used to evaluate the risk of dietary lead exposure of the adult population in China by point assessment and probability assessment. The margin of exposure (MOE) and target hazard quotient (THQ) were used to estimate dietary lead exposure's health risk. Results A total of 24 studies were included in this study, and 31 008 sample data were collected from 19 provinces. The top three food lead concentrations were edible mushroom (0.13 mg/kg), eggs (0.11 mg/kg), seafood and aquatic products (0.08 mg/kg). More than 70% of the dietary lead of adults in China came from cereal products (0.39 μg·kg-1·d-1), vegetables (0.22 μg·kg-1·d-1), meat (0.08 μg·kg-1·d-1). The mean of dietary lead exposure was respectively 1.07 μg·kg-1·d-1 and 1.02 μg·kg-1·d-1 for 18- < 60 years old and ≥60 years old. The MOE values of mean lead exposure for all age and sex groups were greater than 1, but the MOE values of P95 were less than 1. The THQ values were less than 1 for all age and sex groups at the mean and P95 levels. Conclusion The risk of dietary lead exposure for adults in China is relatively low, but some people with high exposure should be further monitored and controlled. -
Key words:
- Food /
- Lead /
- Risk assessment
-
表 1 文献中搜集的中国19个省份的11类食品中铅含量(mg/kg)
Table 1. Lead concentration in 11 kinds of food from 19 provinces of China collected in studies (mg/kg)
食物类别 样本数 含量均值(mg/kg) 参考文献 食物类别 样本数 含量均值(mg/kg) 参考文献 谷类及其制品 畜禽肉类 谷类 563 0.06 [12] 肉类 855 0.05 [17] 谷类 1 007 0.04 [13] 肉类 61 0.00 [18] 谷类 2 155 0.04 [14] 肉类 501 0.10 [19] 谷类 342 0.02 [15] 肉类 478 0.02 [14] 谷类 247 0.08 [16] 肉类 444 0.06 [13] 谷类 1 863 0.09 [17] 猪肉 41 0.07 [16] 谷类 49 0.06 [18] 内脏 182 0.14 [16] 谷类 1 193 0.06 [19] 内脏 140 0.02 [14] 谷类 80 0.02 [20] 鱼虾蟹贝类 大米 248 0.08 [21] 水产类 529 0.05 [13] 大米 1 406 0.05 [22] 水产类 60 0.03 [18] 大米 936 0.02 [23] 水产类 997 0.05 [14] 大米 292 0.05 [24] 水产类 480 0.09 [19] 糙米 28 0.02 [25] 水产品 561 0.18 [31] 精米 89 0.04 [26] 海产类 50 0.07 [32] 薯类 鱼类 109 0.12 [16] 薯类 70 0.02 [12] 鱼虾类 539 0.05 [17] 豆类 乳类 豆类 81 0.15 [27] 乳类 511 0.03 [17] 豆类 110 0.02 [14] 乳类 353 0.01 [14] 豆类 191 0.04 [19] 乳类 221 0.01 [19] 蔬菜类 乳类 399 0.01 [13] 蔬菜 227 0.08 [16] 蛋类 蔬菜 2 468 0.07 [17] 鸡蛋 37 0.08 [16] 蔬菜 1 175 0.04 [13] 蛋类 202 0.15 [17] 蔬菜 1 450 0.05 [28] 蛋类 120 0.02 [13] 蔬菜 111 0.06 [18] 蛋类 340 0.01 [14] 蔬菜 1 618 0.07 [19] 蛋类 189 0.28 [19] 蔬菜 681 0.03 [14] 坚果类 蔬菜 400 0.04 [29] 坚果类 370 0.08 [17] 蔬菜 397 0.02 [20] 坚果类 209 0.04 [13] 水果类 坚果类 50 0.01 [33] 水果 525 0.05 [17] 食用菌类 水果 364 0.03 [13] 食用菌 111 0.11 [16] 水果 43 0.02 [18] 食用菌 235 0.06 [13] 水果 335 0.02 [19] 食用菌 204 0.11 [34] 水果 223 0.02 [14] 菌类 223 0.33 [14] 水果 152 0.03 [30] 菇类 158 0.01 [35]  下载: 导出CSV
表 2 中国成人经膳食摄入铅的暴露水平(μg·kg-1·d-1)
Table 2. Lead dietary exposure for Chinese adults (μg·kg-1·d-1)
食物类别 浓度(mg/kg) 消费量(g/d) 暴露量(μg·kg-1·d-1) 贡献率(%) (x±s) P50 x P50 谷物及其制品 0.06 382.79±177.44 350.00 0.39 0.35 44.55 薯类 0.02 41.27±63.16 16.67 0.01 0.01 1.60 豆类 0.06 42.34±61.67 16.67 0.04 0.02 4.93 蔬菜类 0.05 256.07±157.13 228.34 0.22 0.19 24.83 食用菌类 0.13 6.31±19.06 0.00 0.01 0.00 1.59 水果类 0.03 55.14±119.67 0.00 0.03 0.00 3.21 坚果类 0.06 4.57±17.30 0.00 0.00 0.00 0.53 畜禽肉类 0.06 77.59±84.79 53.34 0.08 0.05 9.03 乳类 0.02 17.49±53.52 0.00 0.01 0.00 0.68 蛋类 0.11 24.10±30.65 16.67 0.04 0.03 5.14 鱼虾蟹贝类 0.08 25.19±53.60 0.00 0.03 0.00 3.91
下载: 导出CSV
表 3 中国成人不同年龄段居民膳食中铅的概率评估暴露量
Table 3. Probabilistic assessment of lead dietary exposure in different age-sex groups of Chinese adults
变量 暴露量(μg·kg-1·d-1) 最小值 x P50 P95 最大值 18~ < 60岁 男 0.19 1.08 0.99 1.94 4.12 女 0.14 1.05 0.97 1.86 13.26 合计 0.14 1.07 0.99 1.92 4.14 ≥60岁 男 0.18 1.04 0.95 1.91 6.4 女 0.13 1.02 0.93 1.84 18.24 合计 0.13 1.02 0.93 1.85 6.4 合计 男 0.19 1.06 0.97 1.91 4.65 女 0.13 1.05 0.96 1.88 18.24 合计 0.14 1.05 0.97 1.87 5.26
下载: 导出CSV
表 4 中国成人各年龄性别组人群膳食铅暴露的MOE值和THQ值
Table 4. MOE values and THQ values of lead dietary exposure in different age-sex groups of Chinese adults
变量 MOE THQ x P50 P95 x P50 P95 18~ < 60岁 男 1.11 1.21 0.62 0.31 0.28 0.55 女 1.14 1.24 0.65 0.30 0.28 0.53 合计 1.12 1.21 0.63 0.31 0.28 0.55 ≥60岁 男 1.15 1.26 0.63 0.30 0.27 0.55 女 1.18 1.29 0.65 0.29 0.27 0.53 合计 1.18 1.29 0.65 0.29 0.27 0.53 合计 男 1.13 1.24 0.63 0.30 0.28 0.55 女 1.14 1.25 0.64 0.30 0.27 0.54 合计 1.14 1.24 0.64 0.30 0.28 0.53
下载: 导出CSV
-
[1] 乔增运, 李昌泽, 周正, 等. 铅毒性危害及其治疗药物应用的研究进展[J]. 毒理学杂志, 2020, 34(5): 416-420. DOI: 10.16421/j.cnki.1002-3127.2020.05.016.Qiao ZY, Li CZ, Zhou Z, et al. Research progress of lead toxicity and its therapeutic drug application[J]. J Toxicol, 2020, 34(5): 416-420. DOI: 10.16421/j.cnki.1002-3127.2020.05.016. [2] He K, Wang S, Zhang J. Blood lead levels of children and its trend in China[J]. Sci Total Environ, 2009, 407: 3986-3993. DOI: 10.1016/j.scitotenv.2009.03.018. [3] 顾夏阳. 2013年度电动自行车产业浅析[J]. 电动自行车, 2013, (8): 41-42. https://www.cnki.com.cn/Article/CJFDTOTAL-JSQG201308020.htmGu XY. Analysis of electric bicycle industry in 2013[J]. Electric bicycle, 2013, (8): 41-42. https://www.cnki.com.cn/Article/CJFDTOTAL-JSQG201308020.htm [4] 林虹, 曹开颜. 2020年我国电动自行车电池市场现状与展望[J]. 电池工业, 2020, 24(1): 47-49. https://www.cnki.com.cn/Article/CJFDTOTAL-DCGY202001010.htmLin H, Cao KY. The current situation and development of electric bicycle battery market in China in 2020[J]. Chin Battery Indus, 2020, 24(1): 47-49. https://www.cnki.com.cn/Article/CJFDTOTAL-DCGY202001010.htm [5] 李娜, 杨兰芳, 朱有为, 等. 1990-2018年浙江省人为铅排放时空变化解析[J]. 环境科学学报, 2021, 41(10): 4288-4305. DOI: 10.13671/j.hjkxxb.2021.0056.Li N, Yang LF, Zhu YW, et al. Spatiotemporal variations on lead emission in Zhejiang province during 1990-2018[J]. J Environ Sci, 2021, 41(10): 4288-4305. DOI: 10.13671/j.hjkxxb.2021.0056. [6] 王静雅, 杨明, 钱靖. 废铅蓄电池回收利用现状、问题及对策建议[J]. 农业科技与信息, 2016, (17): 42-43. DOI: 10.15979/j.cnki.cn62-1057/s.2016.17.024.Wang JY, Yang M, Qian J. Status quo, problems and countermeasures of recycling and utilization of waste lead battery[J]. Agric Sci-Tech Information, 2016, (17): 42-43. DOI: 10.15979/j.cnki.cn62-1057/s.2016.17.024. [7] 常继乐, 王宇. 中国居民营养与健康状况监测——2010-2013年综合报告[M]. 北京: 北京大学医学出版社, 2016.Chang JL, Wang Y. Monitoring of nutrition and health status of Chinese Residents: comprehensive report 2010-2013[M]. Beijing: Peking University Medical Press, 2016. [8] 毛伟峰, 杨大进, 隋海霞, 等. 我国成人居民膳食中铅暴露风险评估[J]. 中国食品卫生杂志, 2016, 28(1): 107-110. DOI: 10.13590/j.cjfh.2016.01.024.Mao WF, Yang DJ, Sui HX, et al. Risk assessment of dietary lead exposure in Chinese adult population[J]. Chin J Food Hyg, 2016, 28(1): 107-110. DOI: 10.13590/j.cjfh.2016.01.024. [9] 黄飞飞, 王瑛, 张宁. 苏州市地产大米重金属污染状况及人群膳食暴露风险评估[J]. 食品安全质量检测学报, 2020, 11(23): 9039-9045. DOI: 10.19812/j.cnki.jfsq11-5956/ts.2020.23.078.Huang FF, Wang Y, Zhang N. Heavy metal pollution status of local rice and human dietary exposure risk assessment in Suzhou city[J]. J Food Safety and Quality, 2020, 11(23): 9039-9045. DOI: 10.19812/j.cnki.jfsq11-5956/ts.2020.23.078. [10] Vasconcelos Neto M, Quintal APN, Pôrto LBG, et al. Lead in Brazilian food: exposure assessment and risk characterization[J]. Food Addit Contam Part A Chem Anal Control Expo Risk Assess, 2021, 38(2): 315-325. DOI: 10.1080/19440049.2020.1852321 [11] Pipoyan D, Stepanyan S, Beglaryan M, et al. Carcinogenic and non-carcinogenic risk assessment of trace elements and POPs in honey from Shirak and Syunik regions of Armenia[J]. Chemosphere, 2020, 239: 124809. DOI: 10.1016/j.chemosphere.2019.124809. [12] 樊伟, 王晶, 陈理. 绍兴地区粮谷类食品中铅镉和总汞含量的监测及暴露水平评估[J]. 中国预防医学杂志, 2017, 18(3): 209-213. DOI: 10.16506/j.1009-6639.2017.03.011.Fan W, Wang J, Chen L. Assessment on the exposure levels and monitoring on contents of lead cadmium and total mercury in cereals in Shaoxing area[J]. J Chin Prev Med, 2017, 18(3): 209-213. DOI: 10.16506/j.1009-6639.2017.03.011. [13] 程国霞, 李俊龙, 王彩霞, 等. 陕西省食品和饮用水中铅污染状况及风险评估[J]. 卫生研究, 2016, 45(6): 988-992. DOI: 10.19813/j.cnki.weishengyanjiu.2016.06.019.Cheng GX, Li JL, Wang CX, et al. Contamination status and risk assessment of lead in the foods and drinking water in Shaanxi province[J]. J Hyg Res, 2016, 45(6): 988-992. DOI: 10.19813/j.cnki.weishengyanjiu.2016.06.019. [14] Wang M, Liang B, Zhang W, et al. Dietary lead exposure and associated health risks in Guangzhou, China[J]. Int J Environ Res Public Health, 2019, 16(8): 1417. DOI: 10.3390/ijerph16081417. [15] 吴丽珠, 高红梅, 马英. 上海市青浦区主要市售谷物及其制品的铅、镉、汞污染及健康风险评估[J]. 上海预防医学, 2019, 31(6): 451-445. DOI: 10.19428/j.cnki.sjpm.2019.19411.Wu LZ, Gao HM, Ma Y. Lead, cadmium and mercury pollution and health risk assessment for main marketed grain and its products in Qingpu district of Shanghai[J]. Shanghai J Prev Med, 2019, 31(6): 451-445. DOI: 10.19428/j.cnki.sjpm.2019.19411. [16] 彭柟, 李晓辉, 王瑶, 等. 成都市居民膳食中铅镉暴露水平评估[J]. 中国初级卫生保健, 2014, 28(11): 86-88. DOI: 10.3969/j.issn.1001-568x.2014.11.0037.Peng N, Li XH, Wang Y, et al. Assessment on the dietary exposure of lead and cadmium in Chengdu residents[J]. Chin Primary Health Care, 2014, 28(11): 86-88. DOI: 10.3969/j.issn.1001-568x.2014.11.0037. [17] 李杉, 杨丽, 袁蒲, 等. 河南省居民膳食中铅、镉暴露水平评估[J]. 中国健康教育, 2016, 32(9): 791-794. DOI: 10.16168/j.cnki.issn.1002-9982.2016.09.006.Li S, Yang L, Yuan P, et al. The dietary exposure assessment of lead and cadmium in Henan province[J]. Chin J Health Education, 2016, 32(9): 791-794. DOI: 10.16168/j.cnki.issn.1002-9982.2016.09.006. [18] 杨洋. 2013-2016年六安市主要膳食食品中重金属铅、镉、汞、砷的暴露量及风险评估[D]. 合肥: 安徽医科大学, 2019.Yang Y. Exposure and risk assessment of lead, cadmium, and mercury and arsenic in major dietary foods in luan city from 2013 to 2016[D]. Hefei: Anhui Medical University, 2019. [19] 王慧, 王博, 刘思洁. 吉林省居民膳食铅暴露风险评估[J]. 卫生研究, 2019, 48(3): 488-492. DOI: 10.19813/j.cnki.weishengyanjiu.2019.03.022.Wang H, Wang B, Liu SJ. Dietary exposure and risk assessment to lead of the population in Jilin Province[J]. J Hyg Res, 2019, 48(3): 488-492. DOI: 10.19813/j.cnki.weishengyanjiu.2019.03.022. [20] 张小红, 赵青, 路兴乐. 滨州市谷物及蔬菜中铅、镉、总砷暴露量及风险评估[J]. 中国卫生检验杂志, 2021, 31(7): 877-879, 883. https://www.cnki.com.cn/Article/CJFDTOTAL-ZWJZ202107029.htmZhang XH, Zhao Q, Lu XL. The exposure and risk assessment of lead, cadmium an arsenic in cereals and vegetables in Binzhou city[J]. J Chin Health Lab Tec, 2021, 31(7): 877-879, 883. https://www.cnki.com.cn/Article/CJFDTOTAL-ZWJZ202107029.htm [21] Huang Z, Pan XD, Wu PG, et al. Health risk assessment of heavy metals in rice to the population in Zhejiang, China[J]. PLoS One, 2013, 8(9): e75007. DOI: 10.1371/journal.pone.0075007. [22] 张静, 施向东, 庞洁, 等. 2014-2018年南宁市大米重金属含量监测及膳食风险评估[J]. 职业与健康, 2020, 36(19): 2649-2653. DOI: 10.13329/j.cnki.zyyjk.2020.0700.Zhang J, Shi XD, Pang J, et al. Heavy metal content monitoring and dietary risk assessment of rice in Nanning City from 2014-2018[J]. Occup and Health, 2020, 36(19): 2649-2653. DOI: 10.13329/j.cnki.zyyjk.2020.0700. [23] 黄飞飞, 王瑛, 张宁. 苏州市地产大米重金属污染状况及人群膳食暴露风险评估[J]. 食品安全质量检测学报, 2020, 11(23): 9039-9045. DOI: 10.19812/j.cnki.jfsq11-5956/ts.2020.23.078.Huang FF, Wang Y, Zhang N. Heavy metal pollution status of local rice and human dietary exposure risk assessment in Suzhou city[J]. J Food Safety and Quality, 2020, 11(23): 9039-9045. DOI: 10.19812/j.cnki.jfsq11-5956/ts.2020.23.078. [24] 杨建涛, 闲少玲, 黄思聪. 2017-2020年肇庆市售大米重金属污染水平及健康风险评价[J]. 广东化工, 2021, 48(10): 174-176. https://www.cnki.com.cn/Article/CJFDTOTAL-GDHG202110067.htmYang JT, Xian SL, Huang SC. Heavy metal contamination and risk assessment of commercial rice in Zhaoqing City from 2017 to 2020[J]. Guangdong Chem Industry, 2021, 48(10): 174-176. https://www.cnki.com.cn/Article/CJFDTOTAL-GDHG202110067.htm [25] Zeng F, Wei W, Li M, et al. Heavy metal contamination in rice-producing soils of Hunan Province, China and potential health risks[J]. Int J Environ Res Public Health, 2015, 12: 15584-15593. DOI: 10.3390/ijerph121215005. [26] 谢凤婷, 于果, 宋春蕾, 等. 黑龙江不同产区精米中重金属铅、镉、铬含量状况调查[J]. 食品工业, 2018, 39(2): 211-213. https://www.cnki.com.cn/Article/CJFDTOTAL-SPGY201802058.htmXie FT, Yu G, Song CL, et al. An Investigation of heavy metals lead, cadmium and chromium in rice from different areas in Heilongjiang Province[J]. Food Industry, 2018, 39(2): 211-213. https://www.cnki.com.cn/Article/CJFDTOTAL-SPGY201802058.htm [27] Zhang T, Xu W, Lin X, et al. Assessment of heavy metals pollution of soybean grains in North Anhui of China[J]. Sci Total Environ, 2019, 646: 914-922. DOI: 10.1016/j.scitotenv.2018.07.335. [28] 王艳敏, 周鸿, 熊丽, 等. 江西省蔬菜中重金属污染状况调查及评价[J]. 现代预防医学, 2020, 47(7): 1202-1206. https://www.cnki.com.cn/Article/CJFDTOTAL-XDYF202007015.htmWang YM, Zhou H, Xiong L, et al. Heavy metal pollution in vegetables, Jiangxi province[J]. Mod Prev Med, 2020, 47(7): 1202-1206. https://www.cnki.com.cn/Article/CJFDTOTAL-XDYF202007015.htm [29] 闫兆凤, 姜兆刚. 2016-2018年威海市市售蔬菜铅、镉污染及其健康风险分析[J]. 职业与健康, 2020, 36(11): 1485-1487. DOI: 10.13329/j.cnki.zyyjk.2020.0393.Yan ZF, Jiang ZG. Analysis on lead and cadmium pollution and health risk of commercially available vegetables in Weihai City from 2016 to 2018[J]. Occup and Health, 2020, 36(11): 1485-1487. DOI: 10.13329/j.cnki.zyyjk.2020.0393. [30] 刘素芬, 苗思慧, 殷国英, 等. 惠州市成年居民主要膳食镉铅暴露风险评估[J]. 海峡预防医学杂志, 2021, 27(1): 68-71. https://www.cnki.com.cn/Article/CJFDTOTAL-HXYF202101030.htmLiu SF, Miao SH, Yin GY, et al. Risk assessment on exposure of cadmium and lead in major diets of adult residents in Huizhou city[J]. J Straits Prev Med, 2021, 27(1): 68-71. https://www.cnki.com.cn/Article/CJFDTOTAL-HXYF202101030.htm [31] 孙婷, 刘铁诚, 杨丽, 等. 济南市居民水产品中常见重金属含量监测及风险评估[J]. 食品安全质量检测学报, 2020, 11(11): 3720-3725. DOI: 10.19812/j.cnki.jfsq11-5956/ts.2020.11.062.Sun T, Liu TC, Yang L, et al. Monitoring and risk assessment of common heavy metals in aquatic products of residents in Jinan city[J]. J Food Safety and Quality, 2020, 11(11): 3720-3725. DOI: 10.19812/j.cnki.jfsq11-5956/ts.2020.11.062. [32] 王浩然, 伊丽丽, 王红卫, 等. 秦皇岛近海域海产品中铅、镉、汞和无机砷污染状况及食用风险评价[J]. 现代预防医学, 2018, 45(24): 4443-4446. https://www.cnki.com.cn/Article/CJFDTOTAL-XDYF201824007.htmWang HR, Yin LL, Wang HW, et al. Safety evaluation of lead, cadmium, mercury and inorganic arsenic pollution in seafood in the offshore area of Qinhuangdao[J]. Mod Prev Med, 2018, 45(24): 4443-4446. https://www.cnki.com.cn/Article/CJFDTOTAL-XDYF201824007.htm [33] 成娟, 何智宏, 郭明玲, 等. 甘肃省核桃果仁铅、镉含量及膳食暴露评估[J]. 农产品质量与安全, 2019, (5): 58-62. https://www.cnki.com.cn/Article/CJFDTOTAL-NYZL201905013.htmCheng J, He ZH, Guo ML, et al. Lead and cadmium content in walnut kernels and its dietary exposure assessment in Gansu[J]. Quality and Safety of Agro-Products, 2019, (5): 58-62. https://www.cnki.com.cn/Article/CJFDTOTAL-NYZL201905013.htm [34] 闻剑, 杨晓东, 尼珍, 等. 西藏林芝地区野生食用菌重金属污染状况调查及其暴露评估[J]. 中国热带医学, 2018, 18(9): 881-883. DOI: 10.13604/j.cnki.46-1064/r.2018.09.06.Wen J, Yang XD, Ni Z, et al. Survey of heavy metal pollution and potential risks to human health of wild edible mushrooms in Linzhi Prefecture of Tibet[J]. Chin Tropical Med, 2018, 18(9): 881-883. DOI: 10.13604/j.cnki.46-1064/r.2018.09.06. [35] 王国桢, 苏菊萍, 刘俐君, 等. 山西省食用菌中铅、镉含量与膳食暴露评估[J]. 农产品质量与安全, 2020, (3): 68-71. https://www.cnki.com.cn/Article/CJFDTOTAL-NYZL202003012.htmWang GZ, Su JP, Liu LJ, et al. Lead and cadmium content in edible fungi and its dietary exposure assessment in Shanxi province[J]. J Agri Product Quality and Safety, 2020, (3): 68-71. https://www.cnki.com.cn/Article/CJFDTOTAL-NYZL202003012.htm [36] 李筱薇, 刘卿, 刘丽萍, 等. 应用中国总膳食研究评估中国人膳食铅暴露分布状况[J]. 卫生研究, 2012, 41(3): 379-384. DOI: 10.19813/j.cnki.weishengyanjiu.2012.03.006.Li XW, Liu Q, Liu LP, et al. Application of the data from China Total Diet Study to assess the distribution of lead exposure in different age-gender population groups[J]. J Hyg Res, 2012, 41(3): 379-384. DOI: 10.19813/j.cnki.weishengyanjiu.2012.03.006. [37] 刘盛终, 丁一, 曹晓庆, 等. 废旧铅酸蓄电池的回收和再生研究进展[J]. 电源技术, 2020, 44(11): 1701-1704. https://www.cnki.com.cn/Article/CJFDTOTAL-DYJS202011037.htmLiu SZ, Ding Y, Cao XQ, et al. Research progress on recovery and regeneration of waste lead-acid batteries[J]. J Power Sources, 2020, 44(11): 1701-1704. https://www.cnki.com.cn/Article/CJFDTOTAL-DYJS202011037.htm [38] Nawab J, Farooqi S, Xiaoping W, et al. Levels, dietary intake, and health risk of potentially toxic metals in vegetables, fruits, and cereal crops in Pakistan[J]. Environ Sci Pollut Res Int, 2018, 25(6): 5558-5571. DOI: 10.1007/s11356-017-0764-x. [39] Arnich N, V Sirot, G Rivière, et al. Dietary exposure to trace elements and health risk assessment in the 2nd French total diet study[J]. Food Chem Toxicol, 2012, 50: 2432-2449. DOI: 10.1016/j.fct.2012.04.016. -

 点击查看大图
计量
- 文章访问数: 593
- HTML全文浏览量: 176
- PDF下载量: 74
- 被引次数: 0