

-
摘要: 健康指数体系的构建与发展对于推动健康中国目标的实现具有重要的战略意义。从现实世界数据入手,通过一系列的因果推断方法,筛选和确定对健康/疾病结局具有确凿因果关系且可干预的健康指数指标,从而为健康/疾病管理提供更贴近实践、更有价值的现实世界证据是至关重要的。本文针对健康指数构建的循证医学需求,介绍了目前常用的现实世界研究中人群水平评估的因果推断方法,为健康指数指标筛选提供方法支撑。Abstract: The construction and development of the health index system have important strategic significance for promoting the realization of the Healthy China initiative. Starting from the real-world data, it is essential to screen indicators for health indices that are definite causes of diseases and can be prevented through a series of causal inference methods. This can provide valuable real-world evidence that is closer to the practice of health/disease management. According to the need for evidence-based medicine for health index construction, this paper introduces population-level causal effect estimation methods that are widely used in real-world studies, aiming at providing methodological support for the screen of indicators for health index.
-
Key words:
- Real-world data /
- Health index /
- Causal inference /
- Confounding bias
-

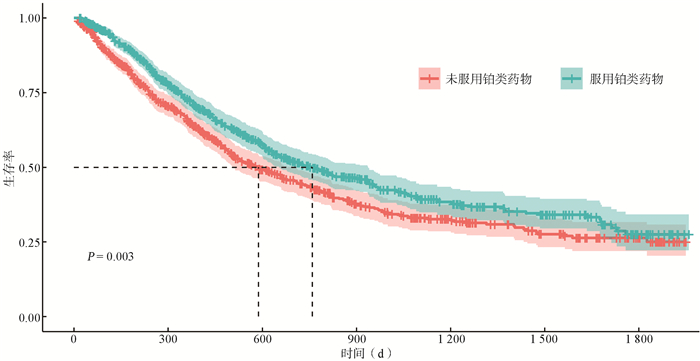
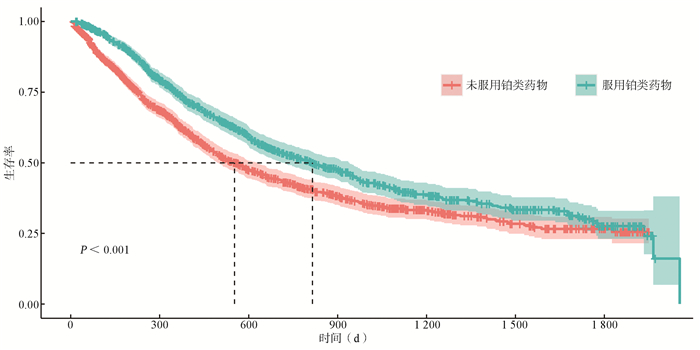
图 1 倾向性评分匹配前肺癌生存K-M曲线图
Figure 1. Kaplan-Meier survival curve for lung cancer before propensity score matching

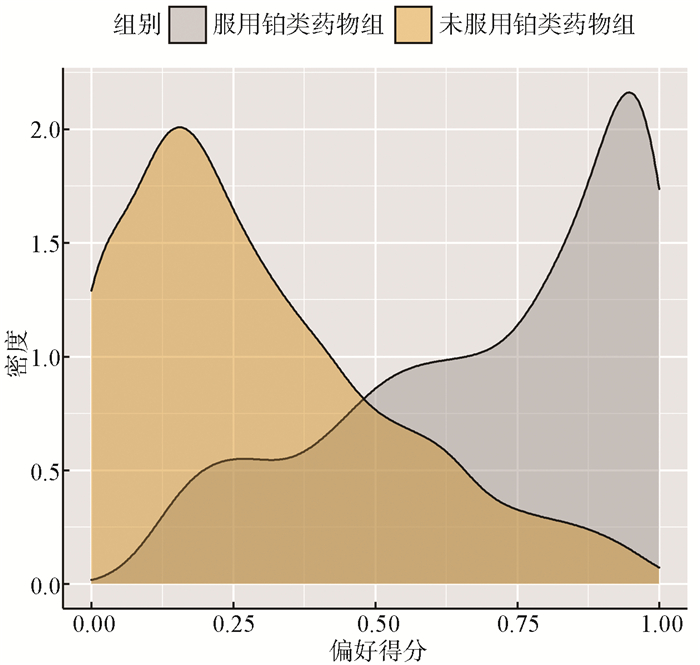
图 2 倾向性评分匹配前服用/未服用铂类药物组偏好得分分布图
Figure 2. The distribution of the preference score grouped by the usage of platinum drugs before propensity score matching

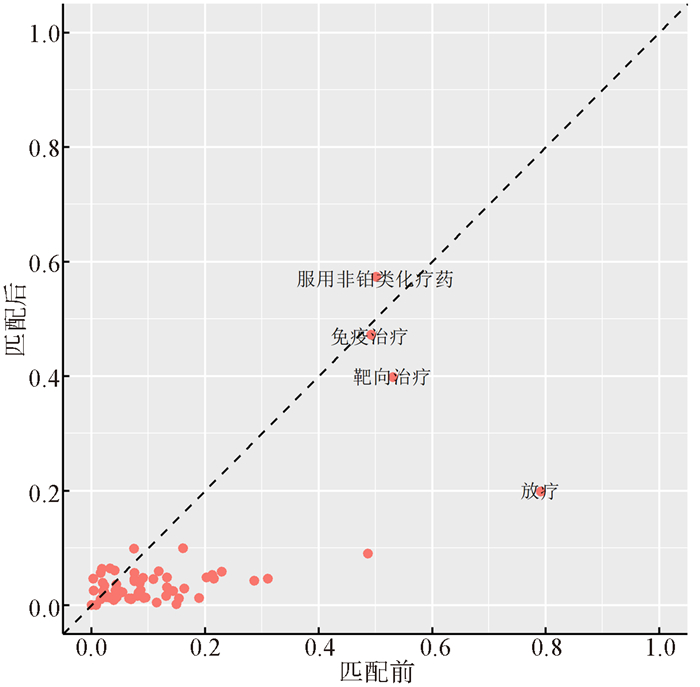
图 3 倾向性评分匹配前/后协变量平衡检测图
Figure 3. Covariate balance that shows the absolute standardized difference of mean before and after propensity score matching

图 4 倾向性评分匹配后肺癌生存K-M曲线图
Figure 4. Kaplan-Meier survival curve for lung cancer after propensity score matching

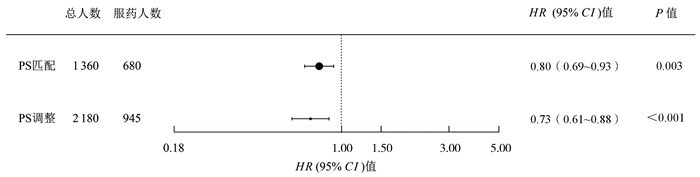
图 5 肺癌患者服用铂类药物群体因果效应分析结果
Figure 5. The estimation of population-level average causal effects of using platinum drugs on lung cancer
表 1 服用铂类药物和未服用铂类药物的基线特征描述[n(%)]
Table 1. Characteristic description of baseline indicators grouped by the usage of platinum drugs [n(%)]
变量 未服用铂类药物
(n=1 235)服用铂类药物
(n=945)合计(N=2 180) t/χ2值 P值 年龄(x±s, 岁) 65.33±9.26 61.01±8.45 63.46±9.17 11.20 < 0.001 年龄分组(岁) 115.21 < 0.001 < 50 67(5.43) 78(8.25) 145(6.65) 50~ < 60 231(18.70) 292(30.90) 523(23.99) 60~ < 70 519(42.02) 433(45.82) 952(43.67) ≥70 418(33.85) 142(15.03) 560(25.69) 性别 18.67 < 0.001 女 510(41.30) 304(32.17) 814(37.34) 男 725(58.70) 641(67.83) 1 366(62.66) 婚姻 0.03 0.862 已婚 1 229(99.51) 939(99.37) 2 168(99.45) 非已婚 6(0.49) 6(0.63) 12(0.55) 医保类型 52.09 < 0.001 城乡居民基本医疗保险 768(62.19) 518(54.81) 1 286(58.99) 城镇职工基本医疗保险 327(26.48) 373(39.47) 700(32.11) 其他社会保险 140(11.34) 54(5.71) 194(8.90) 吸烟状况 9.58 0.008 不吸烟 716(57.98) 485(51.32) 1 201(55.09) 戒烟 217(17.57) 192(20.32) 409(18.76) 吸烟 302(24.45) 268(28.36) 570(26.15) 饮酒状况 10.77 0.001 无饮酒 820(66.40) 562(59.47) 1 382(63.39) 饮酒 415(33.60) 383(40.53) 798(36.61) 肺癌家族史 0.83 0.361 无 1 118(90.53) 867(91.75) 1 985(91.06) 有 117(9.47) 78(8.25) 195(8.94) 是否机会性筛查 0.00 1.000 机会性筛查 250(20.24) 191(20.21) 441(20.23) 症状体征 985(79.76) 754(79.79) 1 739(79.77) 肿瘤部位 2.40 0.662 右上 403(32.63) 313(33.12) 716(32.84) 左上 302(24.45) 216(22.86) 518(23.76) 右下 239(19.35) 172(18.20) 411(18.85) 左下 200(16.19) 173(18.31) 373(17.11) 右中 91(7.37) 71(7.51) 162(7.43) 是否腺癌 0.49 0.484 腺癌 891(72.15) 668(70.69) 1 559(71.51) 非腺癌 344(27.85) 277(29.31) 621(28.49) T分期 33.51 < 0.001 T1 125(10.12) 148(15.66) 273(12.52) T2 407(32.96) 367(38.84) 774(35.50) T3 238(19.27) 129(13.65) 367(16.83) T4 465(37.65) 301(31.85) 766(35.14) N分期 28.86 < 0.001 N0 227(18.38) 108(11.43) 335(15.37) N1 94(7.61) 102(10.79) 196(8.99) N2 462(37.41) 412(43.60) 874(40.09) N3 452(36.60) 323(34.18) 775(35.55) M分期 0.11 0.738 M0 606(49.07) 456(48.25) 1 062(48.72) M1 629(50.93) 489(51.75) 1 118(51.28) TNM分期 0.40 0.819 Ⅱ期 159(12.87) 126(13.33) 285(13.07) Ⅲ期 447(36.19) 330(34.92) 777(35.64) Ⅳ期 629(50.93) 489(51.75) 1 118(51.28) 有无手术 21.61 < 0.001 穿刺活检 983(79.60) 670(70.90) 1 653(75.83) 手术切除 252(20.40) 275(29.10) 527(24.17) 有无放疗 301.85 < 0.001 无 1 068(86.48) 497(52.59) 1 565(71.79) 有 167(13.52) 448(47.41) 615(28.21) 是否服用非铂类的化疗药 110.85 < 0.001 无 1 097(88.83) 945(100.00) 2 042(93.67) 有 138(11.17) 0(0.00) 138(6.33) 是否服用靶向治疗药物 142.10 < 0.001 无 875(70.85) 430(45.50) 1 305(59.86) 有 360(29.15) 515(54.50) 875(40.14) 是否服用免疫治疗药物 134.81 < 0.001 无 1 221(98.87) 816(86.35) 2 037(93.44) 有 14(1.13) 129(13.65) 143(6.56) 注:连续型变量以(x±s)表示,用t检验比较变量的组间差异;分类变量以[n(%)]表示,变量间组间差异采用χ2检验。  下载: 导出CSV
-
[1] Fisher RA. Design of experiments[J]. Br Med J, 1936, 1(3923): 554. https://www.sciencedirect.com/science/article/pii/S0016003297000045 [2] 黄丽红, 赵杨, 王陵, 等. 获得现实世界证据的因果推断统计学思考[J]. 中国临床医学, 2021, 28(5): 738-743. DOI: 10.12025/j.issn.1008-6358.2021.20212012.Huang LH, Zhao Y, Wang L, et al. Statistical thinking about causal inference to obtain real-world evidence[J]. Chinese Journal of Clinical Medicine, 2021, 28(5): 738-743. DOI: 10.12025/j.issn.1008-6358.2021.20212012. [3] 任思腾. 随机对照试验是人类科学中研究方法的"黄金标准"吗?——兼谈因果机制证据的作用[J]. 科学技术哲学研究, 2021, 38(5): 58-64. https://www.cnki.com.cn/Article/CJFDTOTAL-KXBZ202105010.htmRen ST. Are randomized controlled trials the "gold standard" of research methods in human science? -Also on the role of evidence of causal mechanism[J]. Studies in Philosophy of Science and Technology, 2021, 38(5): 58-64. https://www.cnki.com.cn/Article/CJFDTOTAL-KXBZ202105010.htm [4] 薛付忠. 健康医疗大数据驱动的健康管理学理论方法体系[J]. 山东大学学报: 医学版, 2017, 55(6): 1-29. DOI: 10.6040/j.issn.1671-7554.0.2017.430.Xue FZ. Healthcare big data-driven theory and methodology for health management[J]. J Shandong Univ (Health Sci), 2017, 55(6): 1-29. DOI: 10.6040/j.issn.1671-7554.0.2017.430. [5] Rosenbaum PR, Rubin DB. The central role of the propensity score in observational studies for causal effects[J]. Biometrika, 1983, 70(1): 41-55. doi: 10.1093/biomet/70.1.41 [6] Imbens GW, Rubin DB. Causal Inference for Statistics, Social, and Biomedical Sciences[M]. New York: Cambridge University Press, 2015: 3-30. [7] Rubin DB. Estimating causal effects of treatments in randomized and nonrandomized studies[J]. J Educ Psychol, 1974, 66(5): 688-701. doi: 10.1037/h0037350 [8] Caliendo M, Kopeinig S. Some practical guidance for the implementation of propensity score matching[J]. J Econ Surv, 2008, 22(1): 31-72. doi: 10.1111/j.1467-6419.2007.00527.x [9] 黄丽红, 王永吉, 王素珍, 等. 倾向性评分方法及其规范化应用的统计学共识[J]. 中国卫生统计, 2020, 37(6): 952-958. DOI: 10.3969/j.issn.1002-3674.2020.06.041.Huang LH, Wang YJ, Wang SZ, et al. Statistical consensus on propensity scoring methods and their standardized application[J]. Chinese Journal of Health Statistics, 2020, 37(6): 952-958. DOI: 10.3969/j.issn.1002-3674.2020.06.041. [10] Guo S, Fraser MW. Propensity score analysis: statistical methods and applications[M]. Thousand Oaks, Calif: Sage Publications, 2010: 127-208. [11] Tian Y, Schuemin MJ, Suchard MA. Evaluating large-scale propensity score performance through real-world and synthetic data experiments[J]. Int J Epidemiol, 2018, 47(6): 2005-2014. DOI: 10.1093/ije/dyy120. [12] Suchard MA, Simpson SE, Zorych I, et al. Massive parallelization of serial inference algorithms for a complex generalized linear model[J]. ACM Trans Model Comput Simul, 2013, 23(1): 1-17. DOI: 10.1145/2414416.2414791. [13] Walker AM, Patrick AR, Lauer MS, et al. A tool for assessing the feasibility of comparative effectiveness research[J]. Comp Eff Res, 2013, 3: 11-20. [14] Austin PC. An Introduction to Propensity Score Methods for Reducing the Effects of Confounding in Observational Studies[J]. Multivariate Behav Res, 2011, 46(3): 399-424. DOI: 10.1080/00273171.2011.568786. [15] Stuart EA. Matching methods for causal inference: a review and a look forward[J]. Stat Sci, 2010, 25(1): 1-21. DOI: 10.1214/09-STS313. [16] Brookhart MA, Schneeweiss S, Rothman KJ, et al. Variable Selection for Propensity Score Models[J]. Am J Epidemiol, 2006, 163(12): 1149-1156. DOI: 10.1093/aje/kwj149. [17] Benedetto U, Head SJ, Angeline GD, et al. Statistical primer: propensity score matching and its alternatives[J]. Eur J Cardiothoracic Surg, 2018, 53(6): 1112-1117. DOI: 10.1093/ejcts/ezy167. [18] Robins JM, Hernan Má, Brumback B. Marginal Structural Models and Causal Inference in Epidemiology[J]. Epidemiology, 2000, 11(5): 550-560. DOI: 10.1097/00001648-200009000-00011. [19] D'Agostino RB. Propensity score methods for bias reduction in the comparison of a treatment to a non-randomized control group[J]. Stat Med, 1998, 17(19): 2265-2281. DOI:10.1002/(SICI)1097-0258(19981015)17:19<2265::AID-SIM918>3.0.CO;2-B. [20] Vansteelandt S, Daniel RM. On regression adjustment for the propensity score. [J]. Stat Med, 2014, 33(23): 4053-4072. DOI: 10.1002/sim.6207. [21] Flanders WD, Klein M, Darrow LA, et al. A Method for Detection of Residual Confounding in Time-series and Other Observational Studies[J]. Epidemiology, 2011, 22(1): 59-67. DOI: 10.1097/EDE.0b013e3181fdcabe. [22] Smith GD. Negative Control Exposures in Epidemiologic Studies[J]. Epidemiology, 2012, 23(2): 350-351. DOI: 10.1097/EDE.0b013e318245912c. [23] Zaadstra BM, Chorus AMJ, Van Buuren S, et al. Selective association of multiple sclerosis with infectious mononucleosis[J]. Mult Scler, 2008, 14(3): 307-313. DOI: 10.1177/1352458507084265. [24] Schuemie MJ, Hripcsak G, Ryan PB, et al. Empirical confidence interval calibration for population-level effect estimation studies in observational healthcare data[J]. Proc Natl Acad Sci U S A, 2018, 115(11): 2571-2577. DOI: 10.1073/pnas.1708282114. [25] Observational Health Data Sciences and Informatics. The book of OHDSI: Observational Health Data Sciences and Informatics[M]. San Bernardino, CA: OHDSI, 2019: 336-339. [26] Schuemie MJ, Ryan PB, DuMouchel W, et al. Interpreting observational studies: why empirical calibration is needed to correct p-values[J]. Stat Med, 2014, 33(2): 209-218. DOI: 10.1002/sim.5925. [27] Schuemie MJ, Ryan PB, Hripcsak G, et al. Improving reproducibility by using high-throughput observational studies with empirical calibration[J]. Philos Trans A Math Phys Eng Sci, 2018, 376(2128): 20170356. DOI: 10.1098/rsta.2017.0356. [28] Heinze G, Juni P. An overview of the objectives of and the approaches to propensity score analyses[J]. Eur Heart J, 2011, 32(14): 1704-1708. DOI: 10.1093/eurheartj/ehr031. [29] Ali MS, Prieto-alhambra D, Lopes LC, et al. Propensity Score Methods in Health Technology Assessment: Principles, Extended Applications, and Recent Advances[J]. Front Pharmacol, 2019, 10: 973. DOI: 10.3389/fphar.2019.00973. -

 点击查看大图
计量
- 文章访问数: 300
- HTML全文浏览量: 340
- PDF下载量: 98
- 被引次数: 0