

Application of Lee-Carter model in the prediction of mortality risk in digestive tract cancer in Suzhou
-
摘要:
目的 通过建立Lee-Carter模型,分析苏州市2002-2016年消化道癌症的死亡特征和变化趋势。 方法 采用苏州市死因监测点居民的消化道癌症死亡数据,计算死亡率和标化死亡率,并建立Lee-Carter死亡率预测模型,进行死亡率的趋势分析。 结果 以苏州市2012-2016年消化道癌症死亡率数据检验模型的应用效果,其平均绝对百分误差(mean absolute percentage error,MAPE)值在年龄和年份水平上分别为2.48%、4.13%,表明模型预测效果较佳;2002-2016年消化道癌症总体的死亡指数呈下降趋势,其中上消化道癌症死亡指数呈现下降趋势,下消化道癌症死亡指数呈现上升趋势;上消化道癌症死亡率是下消化道癌症死亡率的4.23倍,男性死亡率是女性死亡率的2.17倍。 结论 苏州市居民消化道癌症死亡率总体呈逐年下降趋势,其中下消化道癌症男性死亡率呈逐年上升趋势。本研究发现苏州市已出现人口老龄化现象,其医疗卫生水平逐年提高。 -
关键词:
- Lee-Carter模型 /
- 消化道癌症 /
- 死亡率 /
- 预测
Abstract:Objective A Lee-Carter model was used to predict the risk and trend of mortality in the digestive tract cancer in Suzhou from 2002 to 2016. Methods The crude and standardized mortality rates were calculated based on deaths of digestive tract cancer which was identified from Suzhou chronic disease surveillance system.We used Lee-Carter model to predict the trend of mortality in digestive tract cancer. Results The effectiveness of the results forecasted by Lee-Carter model was validated in the data of digestive tract cancer mortality from 2012 to 2016 in Suzhou. The mean absolute percentage error (MAPE) values for the model were 2.48% and 4.13% for the age and year respectively, which indicated a well accepted prediction value. The mortality index was on the down trend in overall digestive tract cancer from 2002 to 2016, among which the mortality index in upper digestive tract cancer decreased, while the mortality index in lower digestive tract cancer increased. The mortality rate of upper digestive tract cancer was 4.23 fold higher than that of lower digestive tract cancer, and mortality rate in male was 2.17 times higher than that in female. Conclusions Our study observed a downward mortality trend in digestive tract cancer overall. Notably, the male mortality rate of lower digestive tract cancer was on an upward trend. In recent years, Suzhou has been undergoing a rapid population aging with medical and health level was increasing as well. -
Key words:
- Lee-Carter model /
- Digestive tract cancer /
- Mortality /
- Prediction
-

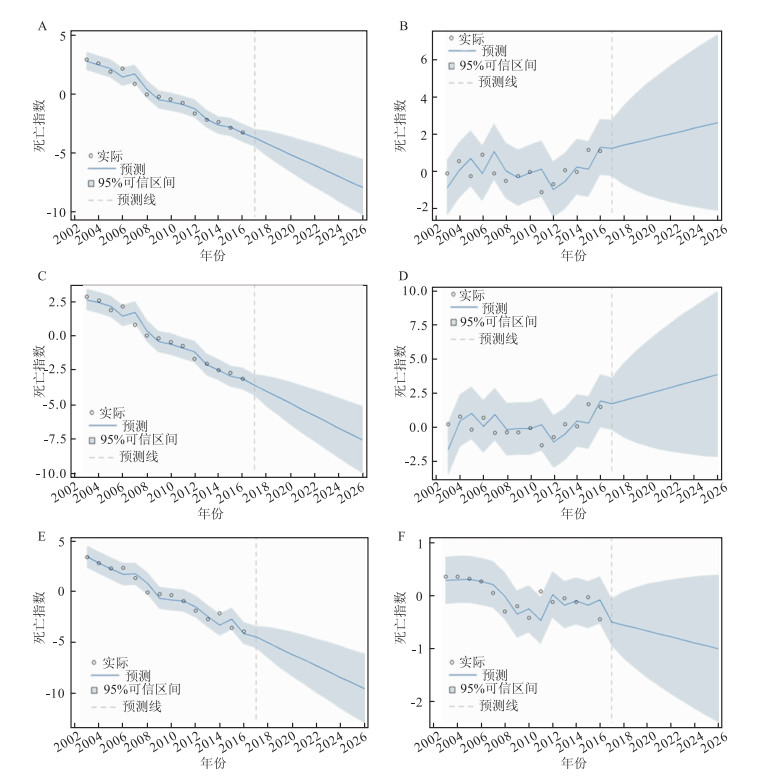
图 1 苏州市居民消化道癌症的死亡特征和时间变化趋势
注:A:上消化道癌症总体;B:下消化道癌症总体;C:上消化道癌症男性;D:下消化道癌症男性;E:上消化道癌症女性;F:下消化道癌症女性
Figure 1. Death characteristics and time trends of digestive tract cancer in Suzhou
表 1 2002-2016年苏州市居民消化道癌症死亡率和标化死亡率(/10万)
Table 1. The crude and standardized mortality rates of digestive tract cancer in Suzhou from 2002 to 2016 (/100 000)
年份(年) 上消化道癌症 下消化道癌症 总消化道癌症 死亡率 标化率 死亡率 标化率 死亡率 标化率 2002 155.38 49.78 23.33 7.49 178.71 57.27 2003 151.02 48.52 26.03 8.36 177.04 56.87 2004 147.34 47.41 27.97 8.95 175.30 56.36 2005 138.24 43.57 25.73 8.14 163.97 51.71 2006 145.31 45.53 30.11 9.42 175.41 54.95 2007 129.84 39.36 26.38 8.02 156.22 47.38 2008 118.55 35.13 26.18 7.78 144.72 42.91 2009 119.45 35.03 26.55 7.72 146.00 42.75 2010 115.58 33.81 28.15 8.19 143.73 42.00 2011 112.77 32.73 24.73 7.22 137.50 39.95 2012 104.43 29.90 26.00 7.45 130.43 37.35 2013 101.16 28.38 29.21 8.19 130.37 36.57 2014 100.86 27.99 29.44 8.21 130.30 36.20 2015 98.22 26.82 35.31 9.75 133.53 36.57 2016 95.32 25.78 33.83 9.08 129.16 34.86 注:使用2010年中国第六次人口普查数据作为标准人口进行中国标化死亡率的计算[5]。  下载: 导出CSV
表 2 苏州市2012-2016年消化道癌症实际与预测死亡率(/10万)
Table 2. Actual and predicted mortality of digestive tract cancer in Suzhou from 2012 to 2016(/100 000)
年龄组(岁) 实际年份(年) 预测年份(年) 2012 2013 2014 2015 2016 2012 2013 2014 2015 2016 45~ 13.93 12.27 15.86 14.32 10.03 16.31 15.55 14.82 14.13 13.47 50~ 32.11 27.15 28.79 29.80 27.81 30.13 28.25 26.49 24.84 23.29 55~ 58.42 55.63 49.21 53.28 50.87 54.04 50.42 47.04 43.89 40.94 60~ 95.26 90.63 93.11 92.35 82.96 101.66 96.65 91.89 87.36 83.05 65~ 152.47 163.00 149.43 149.78 130.78 176.76 169.43 162.39 155.65 149.19 70~ 274.19 260.29 275.55 231.79 237.88 272.41 260.72 249.53 238.82 228.57 75~ 393.65 379.16 359.72 399.00 389.76 404.97 389.55 374.71 360.44 346.71 80~ 525.02 534.31 513.20 570.24 550.39 554.06 547.44 540.89 534.42 528.02 ≥85 496.61 532.13 554.99 556.71 575.71 497.13 492.13 487.18 482.28 477.42
下载: 导出CSV
表 3 未来十年苏州市居民总消化道癌症粗死亡率的预测结果(/10万)
Table 3. Prediction results of crude mortality rate of digestive tract cancer in Suzhou for the next decade(/100 000)
年龄组(岁) 年份(年) 2017 2018 2019 2020 2021 2022 2023 2024 2025 2026 45~ 11.92 11.28 10.69 10.12 9.58 9.07 8.59 8.13 7.70 7.29 50~ 24.82 23.50 22.25 21.06 19.93 18.87 17.86 16.91 16.01 15.15 55~ 44.65 42.16 39.80 37.57 35.47 33.49 31.62 29.85 28.18 26.61 60~ 80.53 76.62 72.90 69.37 66.00 62.80 59.76 56.86 54.10 51.48 65~ 134.73 128.42 122.41 116.68 111.21 106.00 101.04 96.30 91.79 87.50 70~ 229.47 220.34 211.57 203.16 195.07 187.31 179.86 172.70 165.83 159.23 75~ 351.03 338.96 327.30 316.04 305.17 294.67 284.53 274.74 265.29 256.17 80~ 525.69 519.72 513.82 507.99 502.22 496.52 490.88 485.31 479.80 474.36 ≥85 539.23 540.19 541.15 542.11 543.08 544.04 545.01 545.98 546.95 547.92
下载: 导出CSV
表 4 2017-2026年苏州市消化道癌症死亡率预测效果
Table 4. The effectiveness of the forecasted results in digestive tract cancer in Suzhou from 2017 to 2026
Lee-Carter模型 预测误差(%) 上消化道癌症 下消化道癌症 总消化道癌症 年龄水平 男 4.29 9.69 4.19 女 5.73 9.29 5.09 合计 3.73 7.81 3.79 年份水平 男 7.15 16.15 6.98 女 9.55 15.48 8.49 合计 6.21 13.02 6.32
下载: 导出CSV
-
[1] 王庆生, 陈万青. 癌症防治策略的探索与分析[J]. 中国医学前沿杂志: 电子版, 2016, 8(7): 13-16. https://www.cnki.com.cn/Article/CJFDTOTAL-YXQY201607006.htmWang QS, Chen WQ. Exploration and analysis of cancer prevention strategies[J]. Chinese Journal of the Frontiers of Medical Science(Electronic Version), 2016, 8(7): 13-16. https://www.cnki.com.cn/Article/CJFDTOTAL-YXQY201607006.htm [2] 李鹏, 杨文秀. 慢性病现状流行趋势国际比较及应对策略[J]. 天津医药, 2009, 37(4): 254-257. doi: 10.3969/j.issn.0253-9896.2009.04.005Li P, Yang WX. International comparison of chronic disease's current situation, developing trend and our strategies[J]. Tianjin Med J, 2009, 37(4): 254-257. doi: 10.3969/j.issn.0253-9896.2009.04.005 [3] 刘娟, 杨明旭. Lee-Carter估计模式推算中国农村老年人口死亡率的研究[J]. 南方人口, 2011, 26(4): 10-15. doi: 10.3969/j.issn.1004-1613.2011.04.002Liu J, Yang MX. The study of Lee-carter estimation model calculating China's rural elderly population mortality[J]. South China Population, 2011, 26(4): 10-15. doi: 10.3969/j.issn.1004-1613.2011.04.002 [4] 孙佳美. 生命表编制理论与实验(高等院校经济学实验课程系列教材)[M]. 天津: 南开大学出版社, 2013.Sun JM. Life table preparation theory and experiment (series of teaching materials for experimental courses of economics in institutions of higher learning)[M]. Tianjin: Nankai University Press, 2013. [5] 国务院第六次全国人口普查办公室. 2010年第六次全国人口普查主要数据[M]. 北京: 中国统计出版社, 2011.The sixth national census office of the state council. Main data of the sixth national population census in 2010[M]. Beijing: China Statistics Press, 2011. [6] 郑献智. 扬中市上消化道癌发病和死亡趋势分析及早诊早治效果评价[D]. 南京: 南京医科大学, 2017.Zheng ZX. Analysis of the incidence and death trend of upper digestive tract cancer and evaluation of early diagnosis and treatment in yangzhong city[D]. Nanjing: Nanjing Medical University, 2017. [7] 王彬彬, 张方信, 马强. 幽门螺旋杆菌介导的自噬与胃癌发生机制的研究进展[J]. 世界华人消化杂志, 2014, (28): 4294-4300. https://www.cnki.com.cn/Article/CJFDTOTAL-XXHB201428019.htmWang BB, Zhang FX, Ma Q. Hellocobacter pylori-mediated autophagy and gastric carcinogenesis[J]. World Chinese Journal of Digestology, 2014, (28): 4294-4300. https://www.cnki.com.cn/Article/CJFDTOTAL-XXHB201428019.htm [8] Sitarz R, Skierucha M, Mielko J, et al. Gastric cancer: epidemiology, prevention, classification, and treatment[J]. Cancer Manag Res, 2018, 10: 239-248. DOI: 10.2147/CMAR.S149619. [9] Balakrishnan M, George R, Sharma A, et al. Changing trends in stomach cancer throughout the world[J]. Curr Gastroenterol Rep, 2017, 19(8): 36. DOI: 10.1007/s11894-017-0575-8. [10] Chen W, Zheng R, Baade PD, et al. Cancer statistics in China, 2015[J]. Ca Cancer J Clin, 2016, 66(2): 115-132. DOI: 10.3322/caac.21338. [11] 赵学芳, 王晓莺, 句连云, 等. 苏州市居民膳食营养知识知晓率调查[J]. 环境与职业医学, 2014, 31(3): 213-216. DOI: 10.13213/j.cnki.jeom.2014.0051.Zhao XF, Wang XY, Ju LY, et al. Awarenss rate of related nutritional knowledge among Suzhou residents[J]. J Environ Occup Med, 2014, 31(3): 213-216. DOI: 10.13213/j.cnki.jeom.2014.0051. [12] 陈晓秋, 李柱, 胡阳春, 等. 消化道恶性肿瘤患者营养风险、营养状况与炎症因子的相关性及其对临床结局的影响[J]. 广东医学, 2015, 36(10): 1505-1508. DOI: 10.13820/j.cnki.gdyx.2015.10.008.Chen XQ, Li Z, HuYC, et al. The relationship between nutritional risk, nutritional status and inflammatory factors in patients with gastrointestinal malignancy and its effect on clinical outcome[J]. Guangdong Med J, 2015, 36(10): 1505-1508. DOI: 10.13820/j.cnki.gdyx.2015.10.008. [13] 刘曙正, 孙喜斌, 陆建邦, 等. 河南省1987-2006年消化系统恶性肿瘤死亡率变化趋势[J]. 中国癌症杂志, 2008, 18(3): 227-229. doi: 10.3969/j.issn.1007-3639.2008.03.016Liu SZ, Sun XB, Lu JB, et al. Analysis of mortality trends of digestive system cancer in Henan Province from 1987 to 2006[J]. China Oncology, 2008, 18(3): 227-229. doi: 10.3969/j.issn.1007-3639.2008.03.016 [14] Gu MJ, Huang QC, Bao CZ, et al. Attributable causes of colorectal cancer in China[J]. Bmc Cancer, 2018, 18(1): 38. DOI: 10.1186/s12885-017-3968-z. [15] Botteri E, Iodice S, Bagnardi V, et al. Smoking and colorectal cancer: a meta-analysis[J]. JAMA, 2008, 300(23): 2765-2778. DOI: 10.1001/jama.2008.839. [16] 石平, 徐明. 无锡市区主要消化道恶性肿瘤死亡趋势分析及预测[J]. 现代预防医学, 2009, 36(7): 1223-1224. https://www.cnki.com.cn/Article/CJFDTOTAL-XDYF200907014.htmShi P, Xu M. Analysis and prediction of the death trend of major gastrointestinal malignancies in Wuxi[J]. Mod Prev Med, 2009, 36(7): 1223-1224. https://www.cnki.com.cn/Article/CJFDTOTAL-XDYF200907014.htm [17] 陈燕子, 刘莉, 付晓丽, 等. 肥胖与癌症的关系的知识图谱分析[J]. 中华疾病控制杂志, 2016, 20(6): 604-608. DOI: 10.16462/j.cnki.zhjbkz.2016.06.016.Chen YZ, Liu L, Fu XL, et al. Knowledge mapping analysis of the relationship between obesity and cancer[J]. Chin J Dis Control Prev, 2016, 20(6): 604-608. DOI: 10.16462/j.cnki.zhjbkz.2016.06.016. [18] Mehta M, Shike M. Diet and physical activity in the prevention of colorectal cancer[J]. J Natl Compr Canc Netw, 2014, 12(12): 1721-1726. doi: 10.6004/jnccn.2014.0174 [19] Favoriti P, Carbone G, Greco M, et al. Worldwide burden of colorectal cancer: a review[J]. Updates Surg, 2016, 68(1): 7-11. DOI: 10.1007/s13304-016-0359-y. [20] 张宁. 中国慢性病群体的长寿风险量化分析与应用[J]. 保险研究, 2015, 6: 9-18. DOI: 10.13497/j.cnki.is.2015.06.002.Zhang N. Quantitative analysis and application of longevity risk of chronic diseases in China[J]. Insurance Studies, 2015, (6): 9-18. DOI: 10.13497/j.cnki.is.2015.06.002. [21] Guzman CM, Gillespie DO, Allen K, et al. Future declines of coronary heart disease mortality in England and Wales could counter the burden of population ageing[J]. Plos One, 2014, 9(6): e99482. DOI: 10.1371/journal.pone.0099482. -

 点击查看大图
计量
- 文章访问数: 333
- HTML全文浏览量: 119
- PDF下载量: 22
- 被引次数: 0