

Comparing the timeliness of three types of influenza surveillance data in mainland China
-
摘要:
目的 评估中国大陆三种流感监测数据(法定传染病直报系统报告的流感病例数、流感样病例占门急诊病例总数百分比(influenza-like illness consultation rate,ILI%)和流感病毒检出率)的时效性,为今后流感监测和预警工作提供科学依据。 方法 分别针对2017-2018年度中国大陆北方和南方的三种流感监测数据,采用高峰对比、时间交叉相关分析以及预警分析方法比较时效性。 结果 2017-2018年度三种流感监测数据反映的流感流行趋势大体一致。但三种流感监测数据具有不同的时效性。ILI%在预警北方的第一个流行高峰的能力上欠佳,分别比流感报告病例数和流感病毒检出率滞后6周和9周,南方第一个流行高峰的最早预警指标是ILI%,分别比流感报告病例数和流感病毒检出率提前4周和7周;而三种监测数据在南、北方第二个流行高峰的预警时间上相差不大(0~2周)。 结论 中国大陆三种流感监测数据均能反映流感流行趋势,综合使用三种监测数据,能够更加及时、准确地预警流感流行。 Abstract:Objective To evaluate the timeliness of the three sets of influenza surveillance data (influenza reported cases from Nationwide Notifiable Infectious Diseases Reporting Information System (NIDRIS), influenza-like illness consultation rate (ILI%) and influenza virus positive rate from Chinese Influenza Surveillance Information System) in mainland China. Methods The three sets of influenza surveillance data of North and South China from 2017 to 2018 were compared using peak comparison, cross correlation and Early Aberration Reporting System C3 method. Results The influenza epidemic trends reflected by the three sets of influenza surveillance weekly data from 2017 to 2018 were generally consistent and significantly correlated. However, the three sets of data had different timeliness. From 2017 to 2018, ILI% in the North was not timely at alarming the first epidemic peak, which was 6 weeks and 9 weeks later than influenza cases from NIDRIS and positive rate of influenza virus respectively. While in the South, ILI% was the most sensitive indicator, which was 4 weeks and 7 weeks earlier than influenza cases from NIDRIS and positive rate of influenza virus respectively. However, the three sets of data had little difference in the timeliness of the second epidemic peak both in the North and South. Conclusions The three sets of influenza surveillance data in mainland China could all roughly reflected the epidemic trend of influenza. After comparing the timeliness, a combination of influenza reported cases from NIDRIS together with ILI% and influenza virus positive rate could improve timeliness and accuracy for early warning of influenza. -
Key words:
- Influenza /
- Surveillance data /
- Timeliness /
- Comparison
-

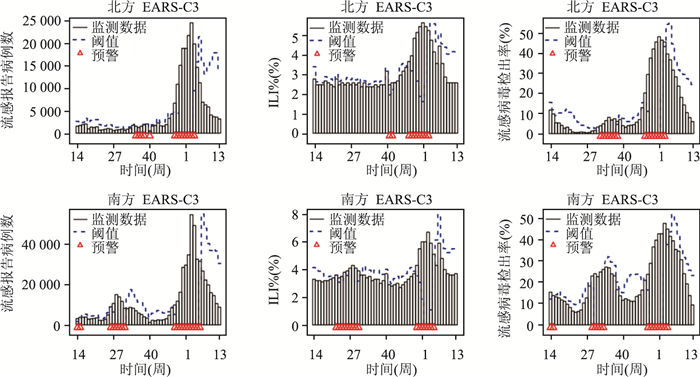
图 1 2017-2018年度中国大陆三种流感监测数据的EARS-C3预警结果
Figure 1. EARS-C3 warning results of three types of influenza data in the North and South China from 2017 to 2018
表 1 流感报告病例数与ILI%、流感病毒检出率的时间交叉相关性分析结果
Table 1. Results of time cross correlation analysis among influenza reported cases, ILI% and influenza virus positive rate
南、北方监测数据 与"流感报告病例数"的rs -4周 -3周 -2周 -1周 本周 +1周 +2周 +3周 +4周 北方 ILI% 0.673 0.765a 0.760 0.719 0.641 0.741 0.731 0.693 0.614 流感病毒检出率 0.808 0.847 0.885 0.892 0.905a 0.878 0.791 0.730 0.677 南方 ILI% 0.605 0.710 0.776 0.826 0.827a 0.825 0.745 0.636 0.501 流感病毒检出率 0.455 0.583 0.702 0.790 0.818 0.822a 0.788 0.717 0.612 注:"-1周"表示流感报告病例数时间分布前移1周,"+1周"表示时间分布向后1周,余类推。北方,ILI%与流感病毒检出率的rs为0.642;南方,ILI%与流感病毒检出率的rs为0.569。P值均<0.001。a表示时间交叉相关系数最大。  下载: 导出CSV
表 2 2017-2018年度中国大陆南、北方三种流感监测数据EARS-C3预警时间
Table 2. EARS-C3 warning time of three types of influenza data in the North and South China from 2017 to 2018
南、北方监测数据 EARS-C3(周) 北方 流感报告病例数 35~40,49~4 ILI% 41~42,48~3 流感病毒检出率 32~38,48~3 南方 流感报告病例数 26~31,49~6 ILI% 22~30,51~5 流感病毒检出率 29~33,49~4 注:逗号前后分别表示第一个流行高峰、第二个流行高峰的预警时间。
下载: 导出CSV
表 3 2017-2018年度中国大陆南、北方三种流感监测数据的时效性比较
Table 3. Comparing the timeliness of three types of influenza data in the North and South China from 2017 to 2018
南、北方监测数据 与流感报告病例数的时效性比较 高峰对比 时间交叉相关分析 EARS-C3 北方 ILI% 早2周 早3周 迟6周,早1周 流感病毒检出率 早2周 相同 早3周,早1周 南方 ILI% 相同,相同 相同 早4周,迟2周 流感病毒检出率 迟6周,相同 迟1周 迟3周,相同 注:逗号前后分别表示第一个流行高峰、第二个流行高峰的其它监测数据与流感报告病例数的时效性差值。
下载: 导出CSV
-
[1] WHO. Influenza (Seasonal) fact sheet[EB/OL]. (2018-01-31)[2018-08-22]. http://www.who.int/en/news-room/fact-sheets/detail/influenza-(seasonal). [2] Iuliano AD, Roguski KM, Chang HH, et al. Estimates of global seasonal influenza-associated respiratory mortality: a modelling study[J]. Lancet, 2018, 391(10127): 1285-1300. DOI: 10.1016/S0140-6736(17)33293-2. [3] 王大燕. 中国流感监测网络的发展与展望[J]. 中华流行病学杂志, 2018, 39(8): 1036-1040. DOI: 10.3760/cma.j.issn.0254-6450.2018.08.005.Wang DY. Development and prospect of Influenza Surveillance Network in China[J]. Chin J Epidemiol, 2018, 39(8): 1036-1040. DOI: 10.3760/cma.j.issn.0254-6450.2018.08.005. [4] Yang XT, Liu DP, Wei KF, et al. Comparing the similarity and difference of three influenza surveillance systems in China[J]. Sci Rep, 2018, 8(1): 2840. DOI: 10.1038/s41598-018-21059-9. [5] 杨静, 陈涛, 祝菲, 等. 2017~2018年度中国大陆流行性感冒病例报告情况分析[J]. 热带病与寄生虫学, 2018, 16(2): 63-66. DOI: 10.3969/j.issn.1672-2302.2018.02.001.Yang J, Chen T, Zhu F, et al. Analysis of the reported influenza cases in mainland China between 2017 and 2018[J]. J Trop Dis Parasitol, 2018, 16(2): 63-66. DOI: 10.3969/j.issn.1672-2302.2018.02.001. [6] 中国国家流感中心. 全国流感监测技术指南(2017年版)[EB/OL]. (2017-09-30)[2018-08-22]. http://www.chinaivdc.cn/cnic/zyzx/jcfa/201709/t20170930_153976.htm.China National Influenza Center. National Influenza Surveillance Technical Guide (2017 Edition)[EB/OL]. (2017-09-30)[2018-08-22]. http://www.chinaivdc.cn/cnic/zyzx/jcfa/201709/t20170930_153976.htm. [7] Salmon M, Schumacher D, H hle M. Monitoring count time series in R: aberration detection in public health surveillance[J]. J Stat Softw, 2016, 70(10): 5703. DOI: 10.18637/jss.v070.i10. [8] Fricker RD, Hegler BL, Dunfee DA. Comparing syndromic surveillance detection methods: EARS' versus a CUSUM-based methodology[J]. Stat Med, 2010, 27(17): 3407-3429. DOI: 10.1002/sim.3197. [9] 陈涛, 杨静, 汪立杰, 等. 法定节假日对流感样病例就诊比例的影响[J]. 中华流行病学杂志, 2018, 39(8): 1100-1105. DOI: 10.3760/cma.j.issn.0254-6450.2018.08.017.Chen T, Yang J, Wang LJ, et al. The influence of statutory holidays on the proportion of the outpatient and emergency visits for influenza-like illness[J]. Chin J Epidemiol, 2018, 39(8): 1100-1105. DOI: 10.3760/cma.j.issn.0254-6450.2018.08.017. [10] Dailey L, Watkins RE, Plant AJ. Timeliness of data sources used for influenza surveillance[J]. J Am Med Inform Assoc, 2007, 14(5): 626-631. DOI: 10.1197/jamia.M2328. [11] 杨鹏, 王全意, 石伟先, 等. 北京市2007-2008年流感监测预警分析[J]. 中华疾病控制杂志, 2010, 14(02): 108-111. http://zhjbkz.ahmu.edu.cn/article/id/JBKZ201002005Yang P, Wang QY, Shi WX, et al. Pre-warning analysis of influenza surveillance in Beijing, 2007-2008[J]. Chin J Dis Contrl Prev, 2010, 14(2): 108-111. http://zhjbkz.ahmu.edu.cn/article/id/JBKZ201002005 [12] 张代涛, 杨鹏, 张奕, 等. EARS在北京市流感大流行预警中的应用[J]. 北京大学学报(医学版), 2012, 44(3): 412-415. DOI: 10.3969/j.issn.1671-167X.2012.03.017.Zhang DT, Yang P, Zhang Y, et al. Application of EARS in early-warning of influenza pandemic in Beijing[J]. J Peking Univ Health Sci, 2012, 44(3): 412-415. DOI: 10.3969/j.issn.1671-167X.2012.03.017. [13] 张文增, 冀国强, 史继新, 等. EARS系统在顺义区传染病季节性研究中的应用[J]. 现代预防医学, 2012, 39(23): 6097-6100.Zhang WZ, Ji GQ, Shi JX, et al. The application of the Early Aberration Reporting System (EARS) in the analysis of seasonality of infectious diseases in Shunyi district[J]. Modern Prevent Med, 2012, 39(23): 6097-6100. [14] 冀国强, 张文增, 史继新, 等. EARS系统在手足口病早期预警中的应用研究[J]. 中华疾病控制杂志, 2012, 16(9): 788-791. http://zhjbkz.ahmu.edu.cn/article/id/JBKZ201209018Ji GQ, Zhang WZ, Shi JX, et al. Study on the application of the early aberration reporting system (EARS) to the early warning of hand, foot and mouth disease (HFMD)[J]. Chin J Dis Contrl Prev, 2012, 16(9): 788-791. http://zhjbkz.ahmu.edu.cn/article/id/JBKZ201209018 [15] 杨筱婷, 刘新凤, 孟蕾, 等. 甘肃省流感流行预警方法探研[J]. 中华流行病学杂志, 2016, 37(3): 430-433. DOI: 10.3760/cma.j.issn.0254-6450.2016.03.029.Yang XT, Liu XF, Meng L, et al. Study on early warning method for influenza epidemic in Gansu province[J]. China J Epidemiol, 2016, 37(3): 430-433. DOI: 10.3760/cma.j.issn.0254-6450.2016.03.029. [16] 康敏, 谭小华, 杨宇威, 等. 广东省2017-2018年冬季流感流行特征研究[J]. 中华流行病学杂志, 2018, 39(8): 1071-1076. DOI: 10.3760/cma.j.issn.0254-6450.2018.08.011.Kang M, Tan XH, Yang YW, et al. Epidemiological characteristics of influenza in Guangdong province, during winter of 2017-2018. China J Epidemiol, 2018, 39(8): 1071-1076. DOI: 10.3760/cma.j.issn.0254-6450.2018.08.011. -

 点击查看大图
计量
- 文章访问数: 562
- HTML全文浏览量: 191
- PDF下载量: 82
- 被引次数: 0