

Lagged effect of temperature on non-accidental mortality and years of life lost in Wuxi: a time-series study
-
摘要:
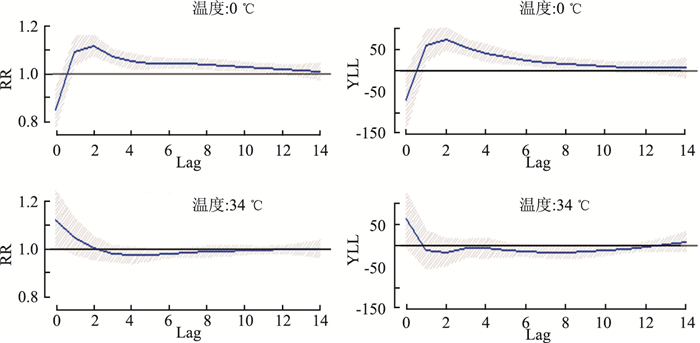
目的 了解无锡市气温在不同滞后日对非意外死亡(A00-R99)人数及寿命损失年的影响。 方法 收集无锡市区(2012-2017年)非意外死亡与气象数据资料,利用分布滞后非线性模型研究气温与非意外死亡人数及寿命损失年的关系,分析低温、高温在不同滞后日期对非意外死亡的累积效应。 结果 无锡市日均气温对非意外死亡效应曲线为"V"形,冷效应具有延迟性,在滞后3 d开始出现并持续14 d,热效应表现为急性效应,当天就出现。低温对人群总效应大于高温;不同年龄、性别对冷、热效应敏感性存在差异。 结论 低温和高温均可增加非意外死亡风险,冷效应起效慢且持续时间长,热效应急促,低温对人群影响更大。 Abstract:Objective To evaluate the effect of air temperature on non-accidental mortality (A00-R99) and years of life lost in Wuxi city. Methods Data on daily non-accidental mortality and meteorology index were collected from 2012 to 2017. Distributed lag non-linear model (DLNM) was used to assess the effect of temperature on non-accidental death and YLL and the cumulative effects between cold and hot temperature on non-accidental mortality and years of life lost with different lag days. Results A V-shaped relationship was noticed between temperature and mortality. Cold effects were delayed by 3 days and persisted for 14 days. Hot effects appeared acute and reached the peak at the same day. Low temperature had stronger gross effect than high temperature had. There were differences of temperature effects between different age and gender groups. Conclusions Low and high temperature were associated with elevated mortality risk. Cold effect had lagged effect and persisted for long time, however, hot effects appeared acute and the impact of low temperature was greater. -
Key words:
- Air temperature /
- non-accidental mortality /
- Years of life lost /
- Time-series study
-

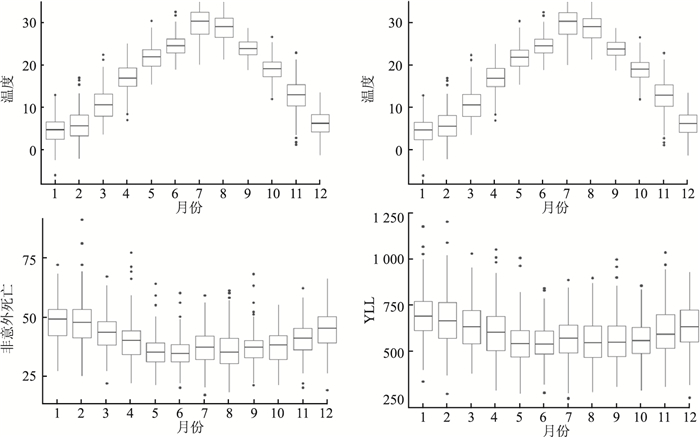
图 1 2012-2017年无锡市日均气温和每日非意外死亡人数、YLL的月分布变化趋势
Figure 1. Month distributions of mean temperature, non-accidental death and YLL in Wuxi from 2012 to 2017

图 2 温度对非意外死亡、无锡YLL滞后效应三维图
Figure 2. The 3-D plot of lag effects of temperature on non-accidental death and YL

图 3 0 ℃和34 ℃不同滞后天数对非意外死亡、YLL的效应
Figure 3. The effects of 0℃ and 34℃ on non-accidental death and YLL with different lag days
表 1 无锡市每日非意外死亡人数、YLL和气象条件基本情况
Table 1. The characteristics of daily non-accidental death, YLL and weather in Wuxi
变量 x±s 最小值 P25 P50 P75 最大值 非意外死亡数(人/日) 40.2±8.9 17.0 34.0 40.0 46.0 91.0 男性 22.4±5.9 6.0 18.0 22.0 26.0 60.0 女性 17.8±5.1 5.0 14.0 17.0 21.0 40.0 < 65岁 7.6±2.7 1.0 6.0 7.0 9.0 17.0 ≥65岁 32.6±8.3 12.0 27.0 32.0 38.0 78.0 总YLL(年/日) 600.0±134.2 244.8 504.4 588.9 685.2 1 202.8 男性 342.9±96.1 77.5 274.7 336.3 401.0 910.8 女性 255.1±80.1 52.1 198.1 248.6 303.2 672.6 < 65岁 246.2±95.0 22.7 177.8 239.9 306.8 598.5 ≥65岁 351.8±89.2 139.7 289.6 344.5 406.2 742.4 气象指标 平均温度(℃) 17.1±9.2 -6.1 8.9 18.0 24.4 36.0 平均气压(hpa) 1 016.2±9.1 994.5 1 008.2 1 016.3 1 023.3 1 041.0 平均相对湿度(%) 72.6±13.6 27.0 64.0 74.0 82.0 100.0 降水量(mm) 3.9±12.4 0.0 0.0 0.0 1.3 211.3 平均风速(m/s) 2.3±0.9 0.2 1.6 2.2 2.8 8.3 日照时数(h) 4.9±4.2 0.0 0.0 5.3 8.6 12.9  下载: 导出CSV
表 2 无锡市冷热效应、不同滞后天数对非意外死亡人数、YLL的累积效应及分层分析
Table 2. The cumulative cold effect and hot effect with different lag days on non-accidental death and YLL and stratification analysis
效应 滞后天数(d) 0 0~3 0~7 0~14 冷效应 非意外死亡人数(RR, 95% CI) 0.91(0.83~1.01) 1.08(0.96~1.22) 1.33(1.15~1.54) 1.54(1.26~1.89) 男性 0.94(0.84~1.06) 1.13(0.97~1.31) 1.43(1.19~1.72) 1.59(1.23~2.06) 女性 0.87(0.77~0.99) 1.03(0.87~1.21) 1.22(1.00~1.50) 1.49(1.13~1.96) < 65(岁) 1.06(0.88~1.27) 1.46(1.15~1.85) 1.78(1.33~2.39) 1.86(1.24~2.78) ≥65(岁) 0.88(0.80~0.98) 1.01(0.89~1.16) 1.25(1.06~1.47) 1.48(1.18~1.86) YLL(年, 95% CI) -32.72(-97.58~32.15) 118.88(37.03~200.72) 244.21(143.56~344.86) 320.37(183.16~457.58) 男性 -5.67(-53.63~42.30) 76.62(15.73~137.50) 156.31(81.28~231.35) 213.25(111.13~315.36) 女性 -27.05(-67.08~12.99) 42.26(-8.49~93.01) 87.89(25.42~150.37) 107.12(21.86~192.37) < 65(岁) 14.84(-34.47~64.15) 107.99(45.38~170.60) 158.88(81.88~235.88) 172.23(67.30~277.17) ≥65(岁) -47.55(-87.72~-7.39) 10.89(-39.99~61.76) 85.33(22.62~148.03) 148.14(62.39~233.88) 热效应 非意外死亡人数(RR, 95% CI) 1.14(1.05~1.23) 1.09(1.00~1.20) 1.03(0.92~1.14) 1.00(0.88~1.14) 男性 1.11(1.01~1.23) 1.07(0.95~1.21) 1.01(0.88~1.16) 1.00(0.85~1.18) 女性 1.17(1.05~1.31) 1.12(0.99~1.28) 1.05(0.90~1.22) 1.00(0.84~1.20) < 65(岁) 1.00(0.85~1.16) 0.91(0.76~1.09) 0.89(0.72~1.10) 0.88(0.68~1.13) ≥65(岁) 1.18(1.08~1.29) 1.15(1.03~1.27) 1.06(0.94~1.20) 1.03(0.89~1.20) YLL(年, 95% CI) 38.96(-13.76~91.68) -0.25(-62.31~61.80) -30.86(-102.85~41.12) -58.11(-145.16~28.94) 男性 16.91(-22.07~55.90) -1.27(-47.43~44.89) -14.21(-67.87~39.46) -26.20(-90.98~38.58) 女性 22.05(-10.49~54.58) 1.02(-37.46~39.50) -16.66(-61.34~28.03) -31.91(-86.00~22.18) < 65(岁) 4.17(-35.90~44.24) -19.42(-66.89~28.05) -26.91(-81.98~28.16) -33.26(-99.83~33.31) ≥65(岁) 34.79(2.14~67.43) 19.17(-19.40~57.74) -3.95(-48.80~40.90) -24.85(-79.25~29.55)
下载: 导出CSV
表 3 不同自由度情况下气温对非意外死亡及YLL的效应
Table 3. The effect of temperature on non-accidental death and YLL with different freedom degree
自由度 低温 高温 3a 4 5 3 4 5 非意外死亡 5b 1.54(1.28~1.85) 1.53(1.27~1.84) 1.53(1.27~1.83) 1.02(0.90~1.16) 1.03(0.91~1.17) 1.03(0.91~1.17) 6 1.53(1.26~1.85) 1.52(1.25~1.84) 1.51(1.25~1.83) 1.03(0.92~1.16) 1.04(0.92~1.17) 1.04(0.92~1.17) 7 1.54(1.26~1.89) 1.53(1.26~1.88) 1.53(1.25~1.87) 1.00(0.88~1.14) 1.01(0.89-1.15) 1.01(0.89~1.15) YLL 5 298.54(172.89~424.18) 293.21(167.52~418.89) 292.71(166.89~418.52) -43.18(-127.31~40.96) -36.69(-121.29~47.90) -36.17(-121.14~48.81) 6 304.22(172.22~436.21) 297.73(165.71~429.75) 297.57(165.48~429.67) -32.99(-112.58~46.60) -28.25(-108.45~51.95) -27.45(-108.42~53.52) 7 320.37(183.16~457.58) 315.16(177.95~452.38) 314.94(177.65~452.24) -58.11(-145.16~28.94) -52.16(-139.62~35.30) -51.20(-138.89~36.48) 注:a表示气压、相对湿度自由度参数值;b表示时间自由度/年参数值。
下载: 导出CSV
-
[1] El-Zein A, Tewtel-Salem M, Nehme G. A time-series analysis of mortality and air temperature in Greater Beirut[J]. Sci Total Environ, 2004, 330(1-3): 71-80. DOI: 10.1016/j.scitotenv.2004.02.027. [2] Zanobetti A, Schwartz J. Temperature and mortality in nine US cities[J]. Epidemiology, 2008, 19(4): 563-70. DOI: 10.1097/EDE.0b013e31816d652d. [3] Yu W, Mengersen K, Wang X, et al. Daily average temperature and mortality among the elderly: a meta-analysis and systematic review of epidemiological evidence[J]. Int J Biometeorol, 2012, 56(4): 569-81. DOI: 10.1007/s00484-011-0497-3. [4] Yang J, Ou CQ, Ding Y, et al. Daily temperature and mortality: a study of distributed lag non-linear effect and effect modification in Guangzhou[J]. Environ Health, 2012, 11: 63. DOI: 10.1186/1476-069X-11-63. [5] Yu W, Mengersen K, Hu W, et al. Assessing the relationship between global warming and mortality: lag effects of temperature fluctuations by age and mortality categories[J]. Environ Pollut, 2011, 159(7): 1789-93. DOI: 10.1016/j.envpol.2011.03.039. [6] Guo Y, Barnett AG, Pan X, et al. The impact of temperature on mortality in tianjin, China: a case-crossover design with a distributed lag nonlinear model. Environ Health Perspect[J], 2011, 119(12): 1719-25. DOI: 10.1289/ehp.1103598. [7] Chen T, Li X, Zhao J, et al. Impacts of cold weather on all-cause and cause-specific mortality in Texas, 1990-2011[J]. Environment Pollution, 2017, 225: 244-251. DOI: 10.1016/j.envpol.2017.03.022 [8] Huang CR, Barnett AG, Wang XM, et al. The impact of temperature on years of life lost in Brisbane, Australia[J]. Nature Climate Change, 2012, 2(4): 265-270. DOI: 10.1038/nclimate1369. [9] Huang C, Barnett AG, Wang X, et al. Effects of extreme temperatures on years of life lost for cardiovascular deaths: a time series study in Brisbane, Australia[J]. Circ Cardiovasc Qual Outcomes, 2012, 5(5): 609-14. DOI: 10.1161/CIRCOUTCOMES.112. [10] 李志浩, 许燕君, 林国桢, 等. 广州和珠海市气温对居民寿命损失年影响的时间序列分析[J]. 中华流行病学杂志, 2015, 36(7): 720-724. DOI: 10.3760/cma.j.issn.0254-6450.2015.07.012.Li ZH, Xu YJ, Lin GZ, et al. Impact of air temperature on years of life lost among residents in guangzhou and zhuhai: a time-series study[J]. Chin J Epidemiol, 2015, 36(7): 720-724. DOI: 10.3760/cma.j.issn.0254-6450.2015.07.012. [11] 张璟, 刘学, 阚海东. 上海市平均气温对居民死亡数的滞后效应研究[J]. 中华流行病学杂志, 2012, 33(12): 1252-1257. DOI: 10.3760/cma.j.issn.0254-6450.2012.12.012.Zhang J, Liu X, Kan HD. Distributed lag effects in the relationship between daily mean temperature and mortality in shanghai[J]. Chin J Epidemiol, 2012, 33(12): 1252-1257. DOI: 10.3760/cma.j.issn.0254-6450.2012.12.012. [12] Muggeo VM. Estimating regression models with unknown break-points[J]. Stat Med, 2003, 22(19): 3055-71. DOI: 10.1002/sim.1545. [13] 谷少华, 王爱红, 边国林, 等. 宁波市气象条件与中暑的关联性分析[J]. 中华流行病学杂志, 2016, 37(8): 1131-1136. DOI: 10.3760/cma.j.issn.0254-6450.2016.08.016.Gu SH, Wang AH, Bian GL, et al. Relationship between weather factors and heat stroke in Ningbo city[J]. Chin J Epidemiol, 2016, 37(8): 1131-1136. DOI:10.3760/cma.j.issn. 0254-6450.2016.08.016. [14] Curriero FC, Heiner KS, Samet JM, et al. Temperature and mortality in 11 cities of the eastern United States[J] Am J Epidemiol, 2002, 155(1): 80-87. doi: 10.1093/aje/155.1.80 [15] Chen R, Yin P, Wang L, et al. Association between ambient temperature and mortality risk and burden: time series study in 272 main Chinese cities[J]. BMJ. 2018, 363: k4306. DOI: 10.1136/bmj.k4306. [16] The Eurowinter Group. Cold exposure and winter mortality from ischaemic heart disease, cerebrovascular disease, respiratory disease, and all causes in warm and cold regions of Europe[J], Lancet, 1997, 349(9062): 1341-1346. doi: 10.1016/S0140-6736(96)12338-2 [17] Basu R, Ostro BD. A multicountry analysis identifying the populations vulnerable to mortality associated with high ambient temperature in California[J]. Am J Epidemiol, 2008, 168(6): 632-637. doi: 10.1093/aje/kwn170 [18] 唐静, 肖长春, 张俊青, 等. 合肥市2007-2016年日平均气温与居民非意外死亡人数的关系[J]. 中华疾病控制杂志, 2018, 22(4): 422-5. DOI: 10.16462/j.cnki.zhjbkz.2018.04.023.Tang J, Xiao CC, Zhang JQ, et al. The relationship between daily average temperature and non-accidental mortality in hefei city from 2007 to 2016[J]. Chin J Dis Control Prev, 2018, 22(4): 422-425. DOI: 10.16462/j.cnki.zhjbkz.2018.04.023. [19] Cheng Y, Kan H. Effect of the interaction between outdoor air pollution and extreme temperature on daily mortality in shanghai, China[J]. J Epidemiol, 2012, 22(1): 28-36. doi: 10.2188/jea.JE20110049 [20] Benmarhnia T, Oulhote Y, Petit C, et al. Chronic air pollution and social deprivation as modifiers of the association between high temperature and daily mortality[J]. Environ Health, 2014, 13(1): 53. DOI: 10.1186/1476-069X-13-53. -


 点击查看大图
计量
- 文章访问数: 308
- HTML全文浏览量: 147
- PDF下载量: 27
- 被引次数: 0