

Spatio-temporal analysis and short-term prediction of the incidence of dysentery in China
-
摘要:
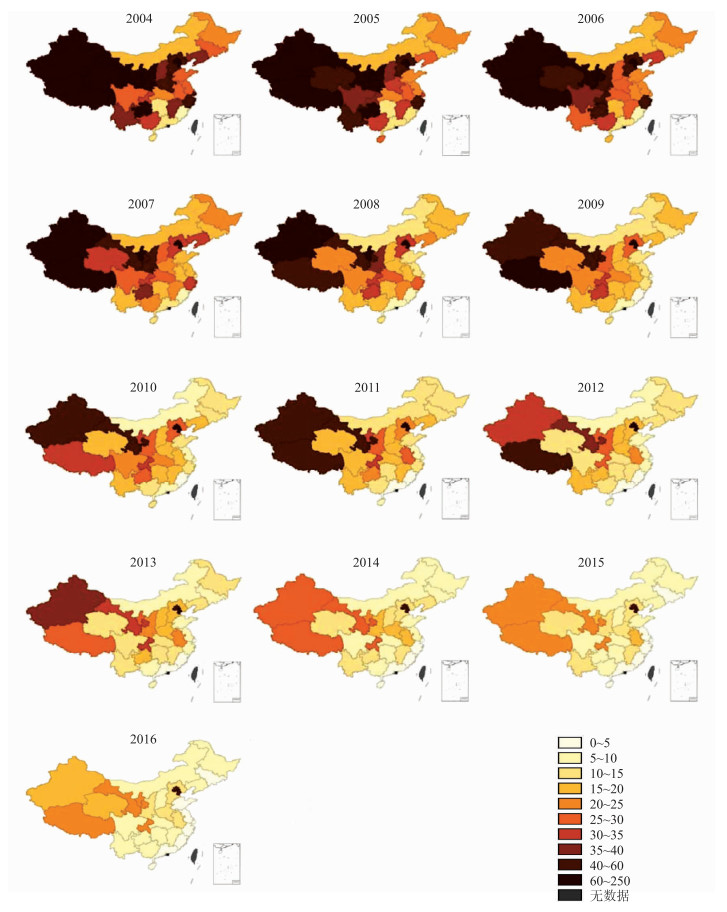
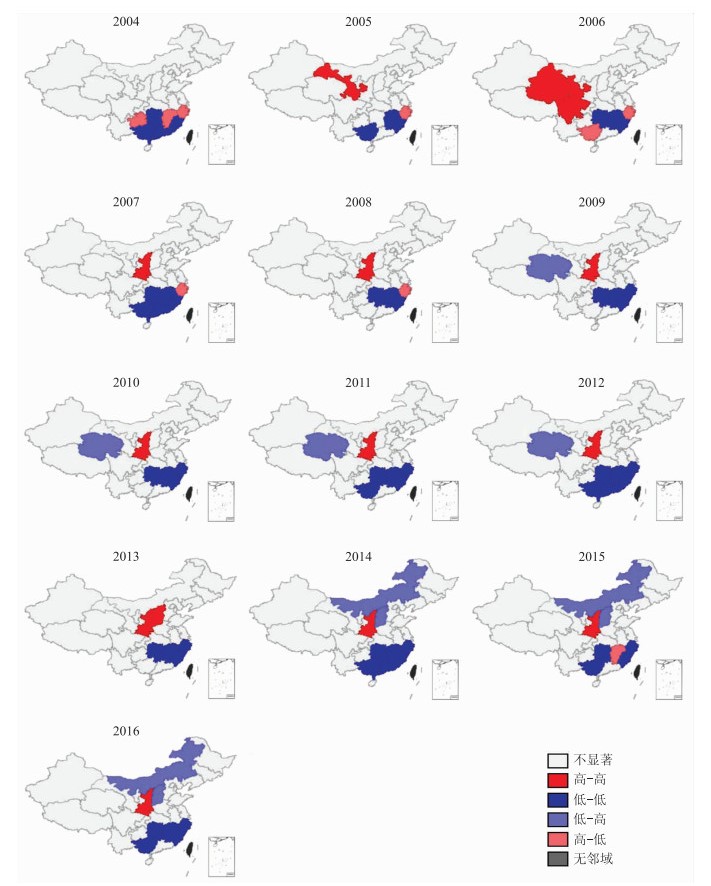
目的 分析我国大陆31个省、市、自治区2004-2016年间痢疾发病率的时空相关性,预测全国痢疾短期发病率的效果。 方法 获取我国2004-2016年痢疾发病率资料。使用Arcgis10.5和Geoda软件(2018稳定版)制作可视化发病率分级地图并分析空间相关性,使用自回归移动平均(auto-regressive integrated moving average,ARIMA)模型预测2017年全国痢疾发病率并评价模型效果。 结果 我国2004-2016年痢疾发病率逐年降低,西部地区痢疾发病率普遍高于东部地区,但北京、天津发病率依然较高。发病率基本不存在全局相关,但存在局部聚集。青海由高高聚集转为低高聚集,内蒙古和山西由无局部聚集转为低高聚集,陕西长期呈高高聚集,东南沿海地区长期处于低低聚集。预测全国痢疾月发病率的模型为ARIMA(1,0,0)(2,1,1)12模型,实际发病率均落在预测区间内。 结论 2004-2016年痢疾发病率在空间上没有明显的移动性但有聚集性,北京、天津、陕西及西部地区发病情况依然严峻。使用ARIMA模型可以很好的预测短期痢疾月发病率,应根据发病趋势和聚集情况以及短期预测结果综合制定防控措施。 Abstract:Objective The aim is to analyze the spatial-temporal correlation of dysentery incidence in 31 provinces, municipalities and autonomous regions in China from 2004 to 2016, and to predict the short-term incidence of dysentery in China. Methods Data about the incidence of dysentery from 2004 to 2016 was collected. Arcgis and Geoda were used to create visualized grading maps and analyze spatial correlation. The auto-regressive integrated moving average model (ARIMA)was used to predict the incidence of dysentery in 2017 and evaluate the prediction accuracy of the model. Results The incidence of dysentery in China declined with each passing year from 2004 to 2016. The incidence of dysentery in the western region was significantly higher than the eastern region, except high incidence rate in Beijing and Tianjin. There was no significantly global correlation in the incidence rate, but there was local aggregation. Qinghai had turned from high-level aggregation to low-level accumulation. Inner Mongolia and Shanxi had changed from no local aggregation to low-high accumulation. Shaanxi has long been high-high, and the southeast coastal areas had been low-low accumulation for a long time. The optimal model ARIMA (1, 0, 0) (2, 1, 1)12 was established to predict the incidence of dysentery, and the prediction results were roughly consistent with the observations. Conclusion The incidence of dysentery from 2004 to 2016 is not spatially mobile but clustered. The incidence of dysentery in Beijing, Tianjin, Shaanxi and most of the western regions is severe. The ARIMA model is suitable for forecasting the incidence of short-term dysentery. And our analysis may help prevent and control the incidence of dysentery in China. -
Key words:
- Dysentery /
- Hierarchical map /
- Spatial correlation /
- ARIMA model
-

图 1 2004-2016年全国痢疾发病率时间分布图
Figure 1. Time distribution of dysentery incidence in china from 2004 to 2016

图 2 2004-2016年全国痢疾发病率分级地图(/10万)
Figure 2. The incidence of dysentery from 2004 to 2016 in China (/100 000)

图 3 2004-2016年全国痢疾发病率空间局部相关(LISA)
Figure 3. Local spatial autocorrelation ofdysentery incidence from 2004 to 2016 in China(LISA)

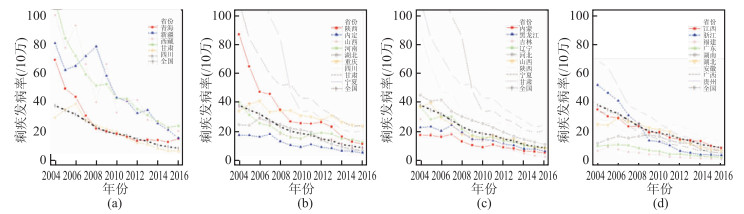
图 4 2004-2016年部分省份与全国痢疾年发病时间分布图
Figure 4. Time distribution of dysentery incidence in china from 2004 to 2016

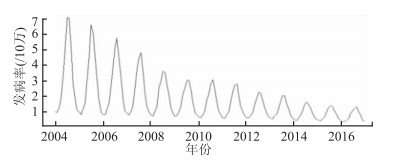
图 5 2004年1月-2016年12月全国痢疾发病率时间序列图
Figure 5. Time series plots of monthly dysentery incidence from January 2004 to December 2016

图 6 2017年1-12月全国痢疾发病率预测曲线
Figure 6. Prediction of dysentery incidence from January to December in 2017
表 1 2004-2016年全局空间自相关分析结果
Table 1. Global spatial autocorrelation of dysentery incidence from 2004 to 2016
年份 Moran’s I Z值 P值 2004 0.008 1.377 0.077 2005 0.014 0.651 0.203 2006 0.015 0.628 0.208 2007 0.023 0.783 0.162 2008 0.013 0.575 0.221 2009 0.056 1.141 0.105 2010 0.002 0.545 0.238 2011 0.087 1.643 0.045 2012 0.101 1.715 0.044 2013 0.079 1.356 0.066 2014 0.083 1.483 0.068 2015 0.047 0.992 0.128 2016 0.034 0.859 0.167  下载: 导出CSV
表 2 ARIMA模型参数估计
Table 2. The estimation of ARIMA model parameters
参数 估计值 Sx t值 P值 非季节参数 AR(1) 0.659 0.065 10.138 <0.001 季节性参数 SAR(1) -0.934 0.345 -2.707 0.007 SAR(2) -0.363 0.126 -2.881 0.004 SMA(1) 0.537 0.263 2.041 0.042
下载: 导出CSV
表 3 ARIMA模型拟合结果
Table 3. ARIMA model fitting results
模型 统计量 Box-Ljung BIC AIC χ2值 P值 ARIMA (1, 0, 0) (2, 1, 1)12 -329.70 -347.52 0.60 0.438
下载: 导出CSV
表 4 2017年痢疾实际发病率与预测值比较(/10万)
Table 4. Comparison of observations and predicted values of dysentery in 2017 (/100 000)
月份(月) 实际值 预测值 预测区间 绝对误差 相对误差(%) 1 0.371 01 0.364 5 [0.314 8, 0.422 2] 0.006 5 1.75 2 0.378 03 0.353 6 [0.289 7, 0.431 4] 0.024 4 6.46 3 0.425 54 0.445 7 [0.352 7, 0.563 3] 0.020 2 4.74 4 0.518 84 0.563 4 [0.434 6, 0.730 5] 0.044 6 8.59 5 0.793 73 0.853 1 [0.645 2, 1.128 0] 0.059 4 7.48 6 1.024 73 1.065 5 [0.793 4, 1.430 9] 0.040 8 3.98 7 1.180 00 1.201 9 [0.884 0, 1.634 3] 0.021 9 1.86 8 1.107 54 1.215 2 [0.884 9, 1.668 9] 0.107 7 9.72 9 0.801 18 0.990 4 [0.715 3, 1.371 2] 0.189 2 23.62 10 0.617 41 0.768 4 [0.551 3, 1.071 1] 0.150 9 24.46 11 0.441 81 0.484 6 [0.345 8, 0.679 1] 0.042 8 9.69 12 0.358 28 0.420 2 [0.298 5, 0.591 6] 0.061 9 17.28
下载: 导出CSV
-
[1] 常昭瑞, 孙强正, 裴迎新. 2012年中国大陆地区细菌性痢疾疫情特点与监测结果分析[J]. 疾病监测, 2014, 29(7): 528-532. DOI: 10.3784/j.issn.1003-9961.2014.07.006.Chang ZR, Sun QZ, Pei YX. Surveillance for bacillary dysentery in China, 2012[J]. Disease Surveillance, 2014, 29(7): 528-532. DOI: 10.3784/j.issn.1003-9961.2014.07.006. [2] 刘东鹏, 孟蕾, 苟发香. 甘肃省2009-2013年流行性腮腺炎发病时空扫描分析[J]. 中华流行病学杂志, 2015, 36(11): 1258-1262. DOI: 10.3760/cma.j.issn.0254-6450.2015.11.015.Liu DP, Meng L, Gou FX. Spatial temporal distribution of mumps in Gansu, 2009-2013[J]. Chin J Epidemiol, 2015, 36(11): 1258-1262. DOI: 10.3760/cma.j.issn.0254-6450.2015.11.015. [3] 马永成, 王兆芬, 李斌. 基于GIS的青海省结核病时空分布特征研究[J]. 中华疾病控制杂志, 2018, 22(4): 340-344, 353. DOI: 10.16462/j.cnki.zhjbkz.2018.04.005.Ma YC, Wang ZF, Li B. Temporal and spatial distribution of tuberculosis in Qinghai Province based on GIS[J]. Chin J Dis Control Prev, 2018, 22(4): 340-344, 353. DOI: 10.16462/j.cnki.zhjbkz.2018.04.005. [4] 王雪, 张燕, 幸奠国, 等. 2005-2015年重庆市细菌性痢疾发病的流行病学特征及时空聚集性分析[J]. 中华疾病控制杂志, 2018, 22(6): 594-598, 602. DOI: 10.16462/j.cnki.zhjbkz.2018.06.013.Wang X, Zhang Y, Xing DG, et al. Analysis on the epidemiological characteristics and temporal-spatial clusters of bacillary dysentery incidence in Chongqing from 2005 to 2015[J]. Chin J Dis Control Prev, 2018, 22(6): 594-598, 602. DOI: 10.16462/j.cnki.zhjbkz.2018.06.013. [5] 樊旭成, 杨建东, 高枫. 乘积季节自回归积分滑动平均模型在手足口病发病率预测中的应用[J]. 中华预防医学杂志, 2016, 50(5): 456. DOI: 10.3760/cma.j.issn.0253-9624.2016.05.014.Fan XC, Yang JD, Gao F. Application of multiple seasonal autoregressive integrated moving average model in predicting the hand, foot and mouth disease incidence[J]. Chin J Prev Med, 2016, 50(5): 456. DOI: 10.3760/cma.j.issn.0253-9624.2016.05.014. [6] Mina S, Eddine BJ. Spatiotemporal distribution and predictors of tuberculosis incidence in Morocco[J]. Infectious Diseases of Poverty, 2018, 7(1): 43. DOI: 10.1186/s40249-018-0429-0. [7] Bin Z, Jinlin L, Yang F. Spatio-temporal epidemiology of viral hepatitis in China (2003-2015): Implications for prevention and control policies[J]. Int J Environ Res Public Health, 2018, 15(4): E661. DOI: 10.3390/ijerph15040661. [8] 祝寒松, 王灵岚, 林代华. 福建省2011-2016年人间布鲁氏菌病流行病学分析和时空聚集探测[J]. 中华流行病学杂志, 2017, 38(9): 1212. DOI: 10.3760/cma.j.issn.0254-6450.2017.09.014.Zhu HS, Wang LL, Lin DH. Analysis on epidemiology and spatial-temporal clustering of human brucellosis in Fujian province, 2011-2016[J]. Chin J Epidemiol, 2017, 38(9): 1212. DOI:10.3760/cma.j.issn. 0254-6450. 2017.09.014. [9] Wei W, Jiang J, Gao L. A new hybrid model using an autoregressive integrated moving average and a generalized regression neural network for the incidence of tuberculosis in Heng County, China[J]. Am J Trop Med Hyg, 2017, 97(3): 799. DOI: 10.4269/ajtmh.16-0648. [10] 张娜, 杨兴光, 王国永. 山东省2009-2015年HIV/AIDS流行的时空分布特征[J]. 中华流行病学杂志, 2017, 38(2): 226. DOI: 10.3760/cma.j.issn.0254-6450.2017.02.018.Zhang N, Yang XG, Wang GY. Spatiotemporal characteristics of HIV/AIDS in Shandong Province, 2009-2015[J]. Chin J Epidemiol, 2017, 38(2): 226. DOI:10.3760/cma.j.issn.0254-6450. 2017.02.018. [11] 李媛媛, 徐成东, 肖革新. 京津唐地区细菌性痢疾社会经济影响时空分析[J]. 地球信息科学学报, 2016, 18(12): 1615-1623. https://www.cnki.com.cn/Article/CJFDTOTAL-DQXX201612007.htmLi YY, Xu CD, Xiao GX. Spatial-temporal analysis of social-economic factors of bacillary dysentery in Beijing-Tianjin-Tangshan, China[J]. Geo-Inf Sci, 2016, 18(12): 1615-1623. https://www.cnki.com.cn/Article/CJFDTOTAL-DQXX201612007.htm [12] 李琰, 赵春明, 王和平. 青海省卫生总费用分析-筹资来源法[J]. 卫生经济研究, 2010(9): 26-28. DOI:10.14055/j.cnki.33-1056/f. 2010.09.008.Li Y, Zhao CM, Wang HP. Analysis of total health expenditure in qinghai province-method of financing source[J]. Health Economics Research, 2010(9): 26-28. DOI:10.14055/j.cnki.33-1056/f. 2010.09.008. [13] Tsai PJ, Teng HJ. Role of Aedes aegypti (Linnaeus) and Aedes albopictus (Skuse) in local dengue epidemics in Taiwan[J]. Bmc Infectious Diseases, 2016(16): 662. DOI: 10.1186/s12879-016-2002-4. [14] 朱佳佳, 胡登利, 洪秀琴, 等. 基于时空大数据的甲型肝炎发病率分布特征分析及预测模型[J]. 中华疾病控制杂志, 2018, 22(11): 62-65. DOI: 10.16462/j.cnki.zhjbkz.2018.11.012.Zhu JJ, Hu DL, Hong XQ, et al. Analysis of distribution characteristics and prediction model of hepatitis A incidence based on spatiotemporal big data[J]. Chin J Dis Control Prev, 2018, 22(11): 62-65. DOI: 10.16462/j.cnki.zhjbkz.2018.11.012. [15] 祝寒松, 黄文龙, 谢忠杭. 基于SARIMA模型的细菌性痢疾短期定量预测研究[J]. 中国预防医学杂志, 2017(10): 23-27. DOI: 10.16506/j.1009-6639.2017.10.004.Zhu HS, Huang WL, Xie ZH. Short-term prediction for incidence of bacillary dysentery based on SARIMA model[J]. Chin Prev Med, 2017(10): 23-27. DOI: 10.16506/j.1009-6639.2017.10.004. [16] 张璟, 刘伟, 刘艳挪, 等. 济宁市2009-2016年肠道传染病流行状况及疾病负担分析[J]. 中华疾病控制杂志, 2019, 23(2): 217-222. DOI: 10.16462/j.cnki.zhjbkz.2019.02.019.Zhang J, Liu W, Liu YN, et al. Analysis on the epidemic status and the burden of intestinal infectious diseases in Jining city from 2009 to 2016[J]. Chin J Dis Control Prev, 2019, 23(2): 217-222. DOI:10.16462/j.cnki.zhjbkz. 2019.02.019. -


 点击查看大图

计量
- 文章访问数: 353
- HTML全文浏览量: 159
- PDF下载量: 49
- 被引次数: 0