

Application of a support vector regression on prediction of bacillary dysentery combined with meteorological and air pollutants index
-
摘要:
目的 探讨支持向量回归(support vector regression,SVR)模型联合气象和空气污染物指标在兰州市细菌性痢疾发病预测中的应用,为细菌性痢疾防控提供科学的参考依据。 方法 利用兰州市2013年12月-2016年8月细菌性痢疾发病时间序列数据,结合同期气象和空气污染物数据作为训练集建立SVR模型,以2016年9月-2017年12月的发病数据及同期气象和空气污染数据作为验证集验证模型,并比较不同来源数据模型的拟合及预测效果。 结果 2013年12月-2017年12月兰州市共报告细菌性痢疾7 192例。除气压外,其他气象和空气污染因子与细菌性痢疾发病数的相关系数均>0.4。基于整合数据对拟合模型的参数进行选择,得到最小测试误差值所对应的三个参数分别为:C=5、γ=0.02和ε=0.000 1。利用验证集对不同来源的拟合模型进行测试显示整合数据模型具有最好的预测精度性和稳健性,均方根误差(root mean squared error,RMSE)为0.164 7,平均绝对百分比误差(mean absolute percentage error,MAPE)为16.405%。 结论 应用SVR模型联合气象和空气污染指标预测细菌性痢疾效果良好。 Abstract:Objective To explore the application of support vector regression (SVR) model combined with meteorological and air pollutants index in the prediction of the cases of bacillary dysentery in Lanzhou City, so as to provide scientific reference for the prevention and control of bacillary dysentery. Methods Time series data of the reported cases of bacillary dysentery from December 2013 to August 2016, combined with the meteorological and air pollutants data, were used as training set to fit support vector regression model. The data from September 2016 to December 2017 was used as validation set to verify the model and compare the effect in fit and prediction with different models. Results A total of 7 192 bacillary dysentery cases were reported in Lanzhou City from 2013 to 2017. The correlation coefficient of meteorological and pollution factors with the cases of bacillary dysentery was more than 0.4, except air pressure. The parameters of the fit model were selected based on the integrated data, acquiring the three parameters with the smallest test error were C=5, γ=0.02 and ε=0.000 1, respectively. The validation set was used to test the different models, which showed that the integrated data model had the best predictive accuracy and robustness. The root mean squared error (RMSE) was 0.164 7 and the mean absolute percentage error (MAPE) was 16.405%. Conclusion SVR model combined with meteorological and air pollutants index is effective in the prediction of bacterial dysentery. -
Key words:
- SVR model /
- Bacillary dysentery /
- Meteorological factors /
- Air pollutant /
- Forecasting
-

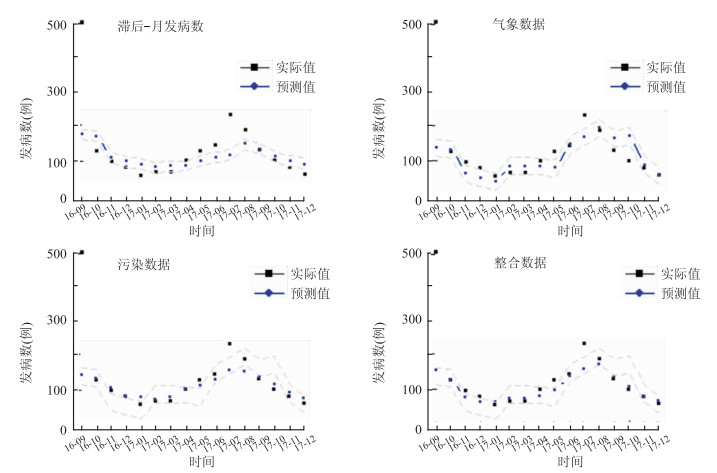
图 1 2016年9月-2017年12月细菌性痢疾发病数预测序列图
Figure 1. Prediction sequence diagram of the case of BD from September 2016 to December 2017
表 1 2013年-2017年兰州市空气污染、气象因素和菌痢发病数指标描述
Table 1. Description of air pollution, meteorological factors and incidence of bacillary dysentery in Lanzhou from 2013 to 2017
变量 (x±s) 极小值 P25 P50 P75 极大值 菌痢月发病数 146.8±93.31 44.00 80.00 120.00 185.00 503.00 空气污染物 PM2.5(μg/m3) 53.73±16.66 30.23 42.13 50.19 63.97 97.32 PM10(μg/m3) 124.83±38.09 72.81 96.20 116.71 146.37 264.17 CO(mg/m3) 1.35±0.56 0.68 0.92 1.16 1.86 2.64 NO2(μg/m3) 51.24±14.42 30.83 42.65 47.97 53.55 97.32 O3_8h/(μg/m3) 85.13±29.30 28.97 66.03 80.23 108.77 145.17 气象因素 平均气温(℃) 7.55±9.30 -7.74 -1.43 8.93 14.65 21.94 平均最高气温(℃) 14.85±8.94 -0.36 6.58 16.07 22.03 29.45 平均最低气温(℃) 1.69±8.87 -13.04 -7.15 3.27 9.35 15.67 平均地表温度(℃) 11.26±11.02 -5.69 0.79 12.11 20.43 29.21 平均气压(hPa) 811.62±0.95 809.50 811.00 811.60 812.30 813.80 平均相对湿度(%) 60.48±10.09 38.06 52.74 59.00 66.94 80.58 平均风速(m/s) 1.94±0.30 1.47 1.69 1.93 2.21 2.65 平均日照时数(h) 7.06±1.15 4.80 6.19 6.95 7.71 9.54  下载: 导出CSV
表 2 气象和污染物因子与不同滞后时期发病数的相关性分析
Table 2. Correlation analysis between meteorological and pollutants factors and incidence in different lag periods
气象和污染物 相同时期 滞后一月 滞后两月 滞后三月 PM2.5(μg/m3) -0.577b -0.404a 0.109 0.586b PM10(μg/m3) -0.561b -0.465b 0.038 0.329a SO2(μg/m3) -0.570b -0.410a 0.002 0.452a CO(mg/m3) -0.465b -0.298a 0.085 0.559b NO2(μg/m3) -0.411a -0.266 0.097 0.537b O3(μg/m3) 0.399a 0.076 -0.269 -0.593b 平均气温(℃) 0.723b 0.471b 0.081 -0.364a 平均最高气温(℃) 0.717b 0.455a 0.070 -0.375a 平均最低气温(℃) 0.735b 0.510b 0.123 -0.320a 平均气压(hPa) -0.332a -0.387a 0.007 0.061 平均地表温度(℃) 0.702b 0.429a 0.034 -0.413a 平均相对湿度(%) 0.381a 0.652b 0.578b 0.398a 平均日照时间(h) 0.200 -0.218 -0.355a -0.480b 平均风速(m/s) 0.396a 0.006 -0.338a -0.625b 注:a表示P值小于0.05;b表示P值小于0.001。
下载: 导出CSV
表 3 不同滞后时期发病数与报告发病数之间的相关性
Table 3. Correlation between the number of cases in different lag periods and reported cases
滞后时期 r值 P值 1月 0.676 < 0.001 2月 0.263 0.064 3月 -0.051 0.737
下载: 导出CSV
表 4 不同C、γ和ε值时SVR模型的预测精度
Table 4. The SVR model precision of different C, γ and ε values
参数值 训练误差 测试误差 C值(γ= 0.071,ε=0.1) 1 0.008 55 0.017 16 2 0.005 38 0.015 73 3 0.003 55 0.014 84 4 0.002 35 0.014 25 5 0.001 54 0.014 09 10 0.000 45 0.014 69 100 0.000 45 0.014 61 γ值(C= 1,ε=0.1) 0.01 0.011 54 0.014 55 0.02 0.010 34 0.013 41 0.03 0.009 74 0.014 24 0.04 0.009 36 0.014 98 0.05 0.009 11 0.015 73 0.10 0.007 97 0.019 10 1.00 0.009 72 0.049 51 ε值(C= 1,γ=0.071) 0.000 1 0.008 60 0.016 58 0.001 0 0.008 59 0.016 59 0.010 0 0.008 52 0.016 70 0.050 0 0.008 38 0.016 89 0.100 0 0.008 55 0.017 16 0.500 0 0.013 87 0.022 67 1.000 0 0.026 14 0.035 74 注:C值表示惩罚参数(cost),γ值代表径向基核参数(gamma),ε值代表损失函数(epsilon)。
下载: 导出CSV
表 5 不同数据源SVR模型拟合效能的比较
Table 5. Comparison of fitting efficiency of SVR models from different data sources
模型 MSE RMSE RMSPE(%) MAPE(%) 滞后一个月发病数 0.028 7 0.169 3 34.574 29.675 污染物数据 0.052 3 0.228 8 34.531 27.735 气象数据 0.032 6 0.180 6 25.576 18.375 整合数据 0.027 1 0.164 7 22.838 16.405
下载: 导出CSV
-
[1] 杜真, 张婧, 卢金星, 等. 北京市2004-2015年细菌性痢疾分布特征及气象影响因素分析[J]. 中华流行病学杂志, 2018, 39(5): 656-660. DOI: 10.3760/cma.j.issn.0254-6450.2018.05.022.Du Z, Zhang J, Lu JX, et al. Association between distribution of bacillary dysentery and meteorological factors in Beijing from 2004 to 2015[J]. Chin J Epidemiol, 2108, 39(5): 656-660. DOI:10.3760/cma.j.issn. 0254-6450.2018.05.022. [2] 李硕, 张云辉, 王永怡, 等. 2017年全球传染病热点回顾[J]. 传染病信息, 2018, 31(1): 5-10. DOI: 10.3969/j.issn.1007-8134.2018.01.002.Li S, Zhang YH, Wang YY, et al. Hot spots review of global infectious diseases in 2017[J]. Infect Dis Info, 2018, 31(1): 5-10. DOI: 10.3969/j.issn.1007-8134.2018.01.002. [3] Guo P, Liu T, Zhang Q, et al. Developing a dengue forecast model using machine learning: A case study in China[J]. PLoS Negl Trop Dis, 2017, 11(10): e0005973. DOI: 10.1371/journal.pntd.0005973. [4] Wah W, Das S, Earnest A, et al. Time series analysis of demographic and tmeporal trends of tuberculosis in Singapore[J]. BMC Public Health, 2014, 14: 1121. DOI: 10.1186/1471-2458-14-1121. [5] 肖雪梦, 张应应. 三种回归方法在消除多重共线性及预测结果的比较[J]. 统计与决策, 2015, 15(24): 75-78. DOI: 10.13546/j.cnki.tjyjc.2015.24.021.Xiao XM, Zhang YY. The comparison of three regression methods in eliminating multicollinearity and prediction results[J]. Statistics & Decision, 2015, 15(24): 75-78. DOI: 10.13546/j.cnki.tjyjc.2015.24.021. [6] Tay FEH, Cao LJ. Application of support vector machines in financial time series forecasting[J]. OMEGA-INT J MANAGE S, 2001, 29(4): 309-317. DOI: 10.1016/S0305-0483(01)00026-3. [7] Amini P, Ahmadinia H, Poorolajal J, et al. Evaluating the high risk groups for suicide: acomparison of Logistic regression, support vector machine, decision tree and artificial neural network[J]. Iran J Public Health, 2016, 45(9): 1179-1187. [8] Liang F, Guan P, Wu W, et al. Forecasting influenza epidemics by integrating internet search queries and traditional surveillance data with the support vector machine regression model in Liaoning, from 2011 to 2015[J]. Peer J, 2018, 6: e5134. DOI: 10.7717/peerj.5134. [9] Pai PF, Lin CS. A hybrid ARIMA and support vector machines model in stock price forecasting[J]. Omega, 2005, 33(6): 497-505. DOI: 10.1016/j.omega.2004.07.024. [10] 刘言玉, 吴含, 劳家辉, 等. 气象因素与细菌性痢疾发病相关关系的meta分析[J]. 环境与健康, 2018, 35(6): 487-491. DOI: CNKI:SUN:HJYJ.0.2018-06-005.Liu YY, Wu H, Lao JH, et al. Relationship between meteorological factors and incidence of bacillary dysentery: ameta-analysis[J]. J Environ Health, 2018, 35(6): 487-491. DOI: CNKI:SUN:HJYJ.0.2018-06-005. [11] 郭杰, 肖纯凌. PM2.5对人群健康影响的流行病学研究进展[J]. 环境卫生学杂志, 2017, 7(2): 164-169. DOI: 10.13421/j.cnki.hjwsxzz.2017.02.016.Guo J, Xiao CL. Progress on epidemiological study of PM2.5effect to human health[J]. Journal of Environmental Hygiene, 2017, 7(2): 164-169. DOI: 10.13421/j.cnki.hjwsxzz.2017.02.016. [12] 高利华, 侯俊, 董玲, 等. 大气中可吸入颗粒物对人体免疫学指标的影响[J]. 郑州大学学报(医学版), 2008, 43(3): 546-548. DOI: 10.13705/j.issn.1671-6825.2008.03.019.Gao LH, Hou J, Dong L, et al. Effect of PM10 on human immunological parameters[J]. Journal of Zhengzhou University(Medical Sciences), 2008, 43(3): 546-548. DOI: 10.13705/j.issn.1671-6825.2008.03.019. [13] 徐学琴, 裴兰英, 王瑾瑾, 等. 基于支持向量机的麻疹发病率预测研究[J]. 中华疾病控制杂志, 2017, 21(5): 528-530. DOI: 10.16462/j.cnki.zhjbkz.2017.05.023.Xu XQ, Pei LY, Wang JJ, et al. Prediction of measles incidence rate based on the support vector machine model[J]. Chin J Dis Control Prev, 2017, 21(5): 528-530. DOI: 10.16462/j.cnki.zhjbkz.2017.05.023. [14] 王金玉, 李盛, 董继元, 等. 气温对兰州市细菌性痢疾发病的滞后效应研究[J]. 北京大学学报(医学版), 2015, 50(5): 861-867. DOI: 10.19723/j.issn.1671-167X.2018.05.017.Wang JY, Li S, Dong JY, et al. Distributed lag effects on the relationship between daily mean temperature and the incidence of bacillary dasentery in Lanzhou city[J]. Journal of Peking University (Health Sciences), 2018, 50(5): 816-867. DOI: 10.19723/j.issn.1671-167X.2018.05.017. [15] Li XW, Wang N, Ding GY, et al. The relationship betweenmeteorological factors and the risk of bacillary dysentery in the highest incidence area of Hunan Province, China from 2005 to 2010[J]. Weather, 2018, 99(99): 1-6. DOI: 10.1002/wea.3085. [16] 宋捷. 大气污染和气象因素对传染病的交互影响[D]. 兰州: 兰州大学, 2015.Song J. The interaction effects of air pollution and meteorological factors on the infectious diseases[D]. Lanzhou: Lanzhou university, 2015. -

 点击查看大图
计量
- 文章访问数: 536
- HTML全文浏览量: 162
- PDF下载量: 38
- 被引次数: 0