

-
摘要:
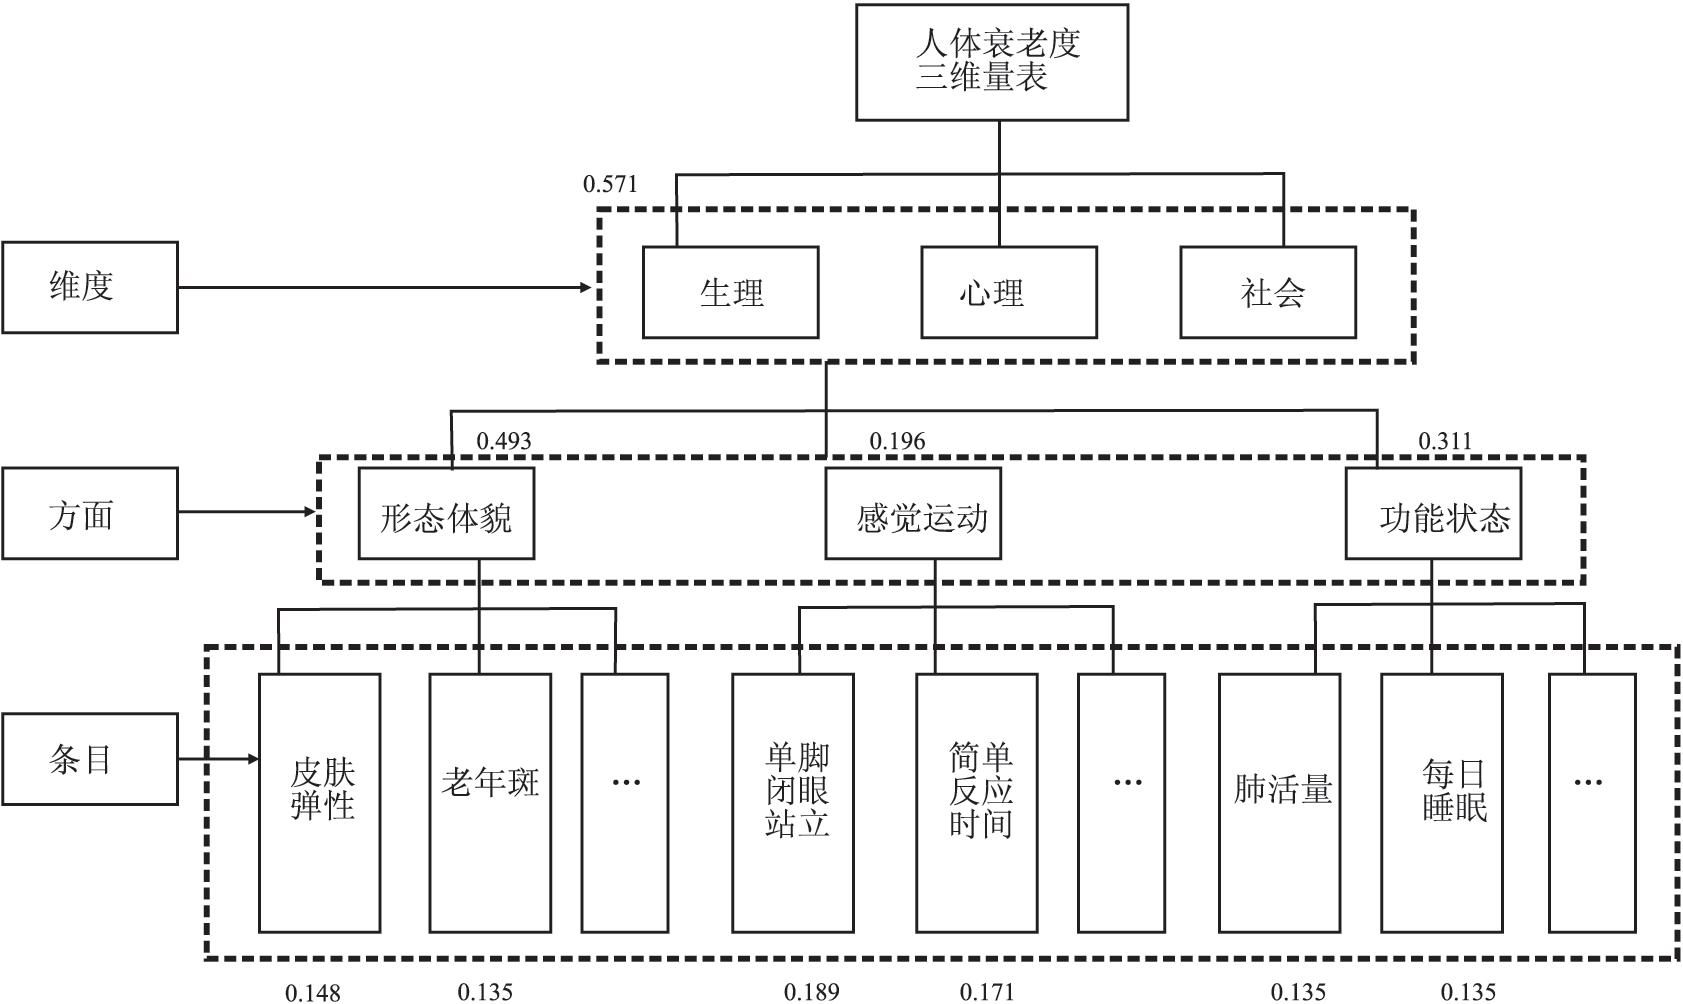
目的 构建人体生理-心理-社会三维衰老度指标体系和量表, 为人体衰老度及抗/缓衰老措施的效果评价提供依据。 方法 采用德尔菲法和主成分分析法等对指标和条目进行评价、修改和确定; 运用层次分析法等对指标和条目赋以权重, 并计算信效度; 以大样本实证研究确定不同年龄段人体衰老度标准化分值分布表; 以生物统计学多种模型为基础, 寻找判断状态年龄的最佳模型。 结果 构建了3个维度、10个方面(指标)、51个条目的衰老度量表, 并通过国家级学会认证; 3 184人的实证结果提示, 衰老度平均总分值为(46.93±11.07)分, 衰老分值与年龄呈正相关(r=0.785, P < 0.001);不同年龄段各维度得分不同[生理:(27.06±8.33)分, 心理:(13.90±2.38)分, 社会:(5.97±1.55)分], 且各维度得分与年龄存在差异, 差异均有统计学意义(均有P < 0.001)。优选出Growth模型(R2=0.635), 并对衰老度得分与年龄进行曲线拟合。 结论 三维衰老度指标及量表科学、可行, 信效度良好。实证结果表明, 衰老功能得分随年龄增长而增加, 且在曲线上显示出一定的特征和规律。 Abstract:Objective Constructing physiological-psycho-social three dimensional aging index system, and scale to provide a basis for evaluating the effects of human aging and anti-aging measures. Methods Evaluation, modification and determination of the second and third level indexed by Delphi and principal component analysis and other methods. The weight of each index was weighted by the analytic hierarchy process, and the reliability and validity were calculated on the basis of the preliminary scale. A large sample of empirical studied to determine the aging of different age groups standardized score distribution table. The best model for judging functional age was sought, based on a variety of biostatistical models. Results The aging scale was constructed by three levels, the first level included 3 indicators, the second level had 10 indicators, the third level included 51 indicators, and adopted by expert certification the national society. 3 184 valid questionnaires were obtained through epidemiological investigation, the average total score of aging was(46.93±11.07) points, and the scores of aging were positively correlated with age(r=0.785, P < 0.001). The average scores of aging in each dimension were different and the difference was statistically significant(allP < 0.001), and each dimension had significant difference with age. The growth model(R2=0.635) was selected, the curve of the relationship between the score of aging and age was fitted. Conclusions The three-dimensional human aging scale was scientific, feasible, and has good reliability and validity. The empirical results show that the comprehensive score of aging increase with age, and show certain characteristics and laws on the curve. -
Key words:
- Aging /
- Scale production /
- Gerontology /
- Geriatrics
-

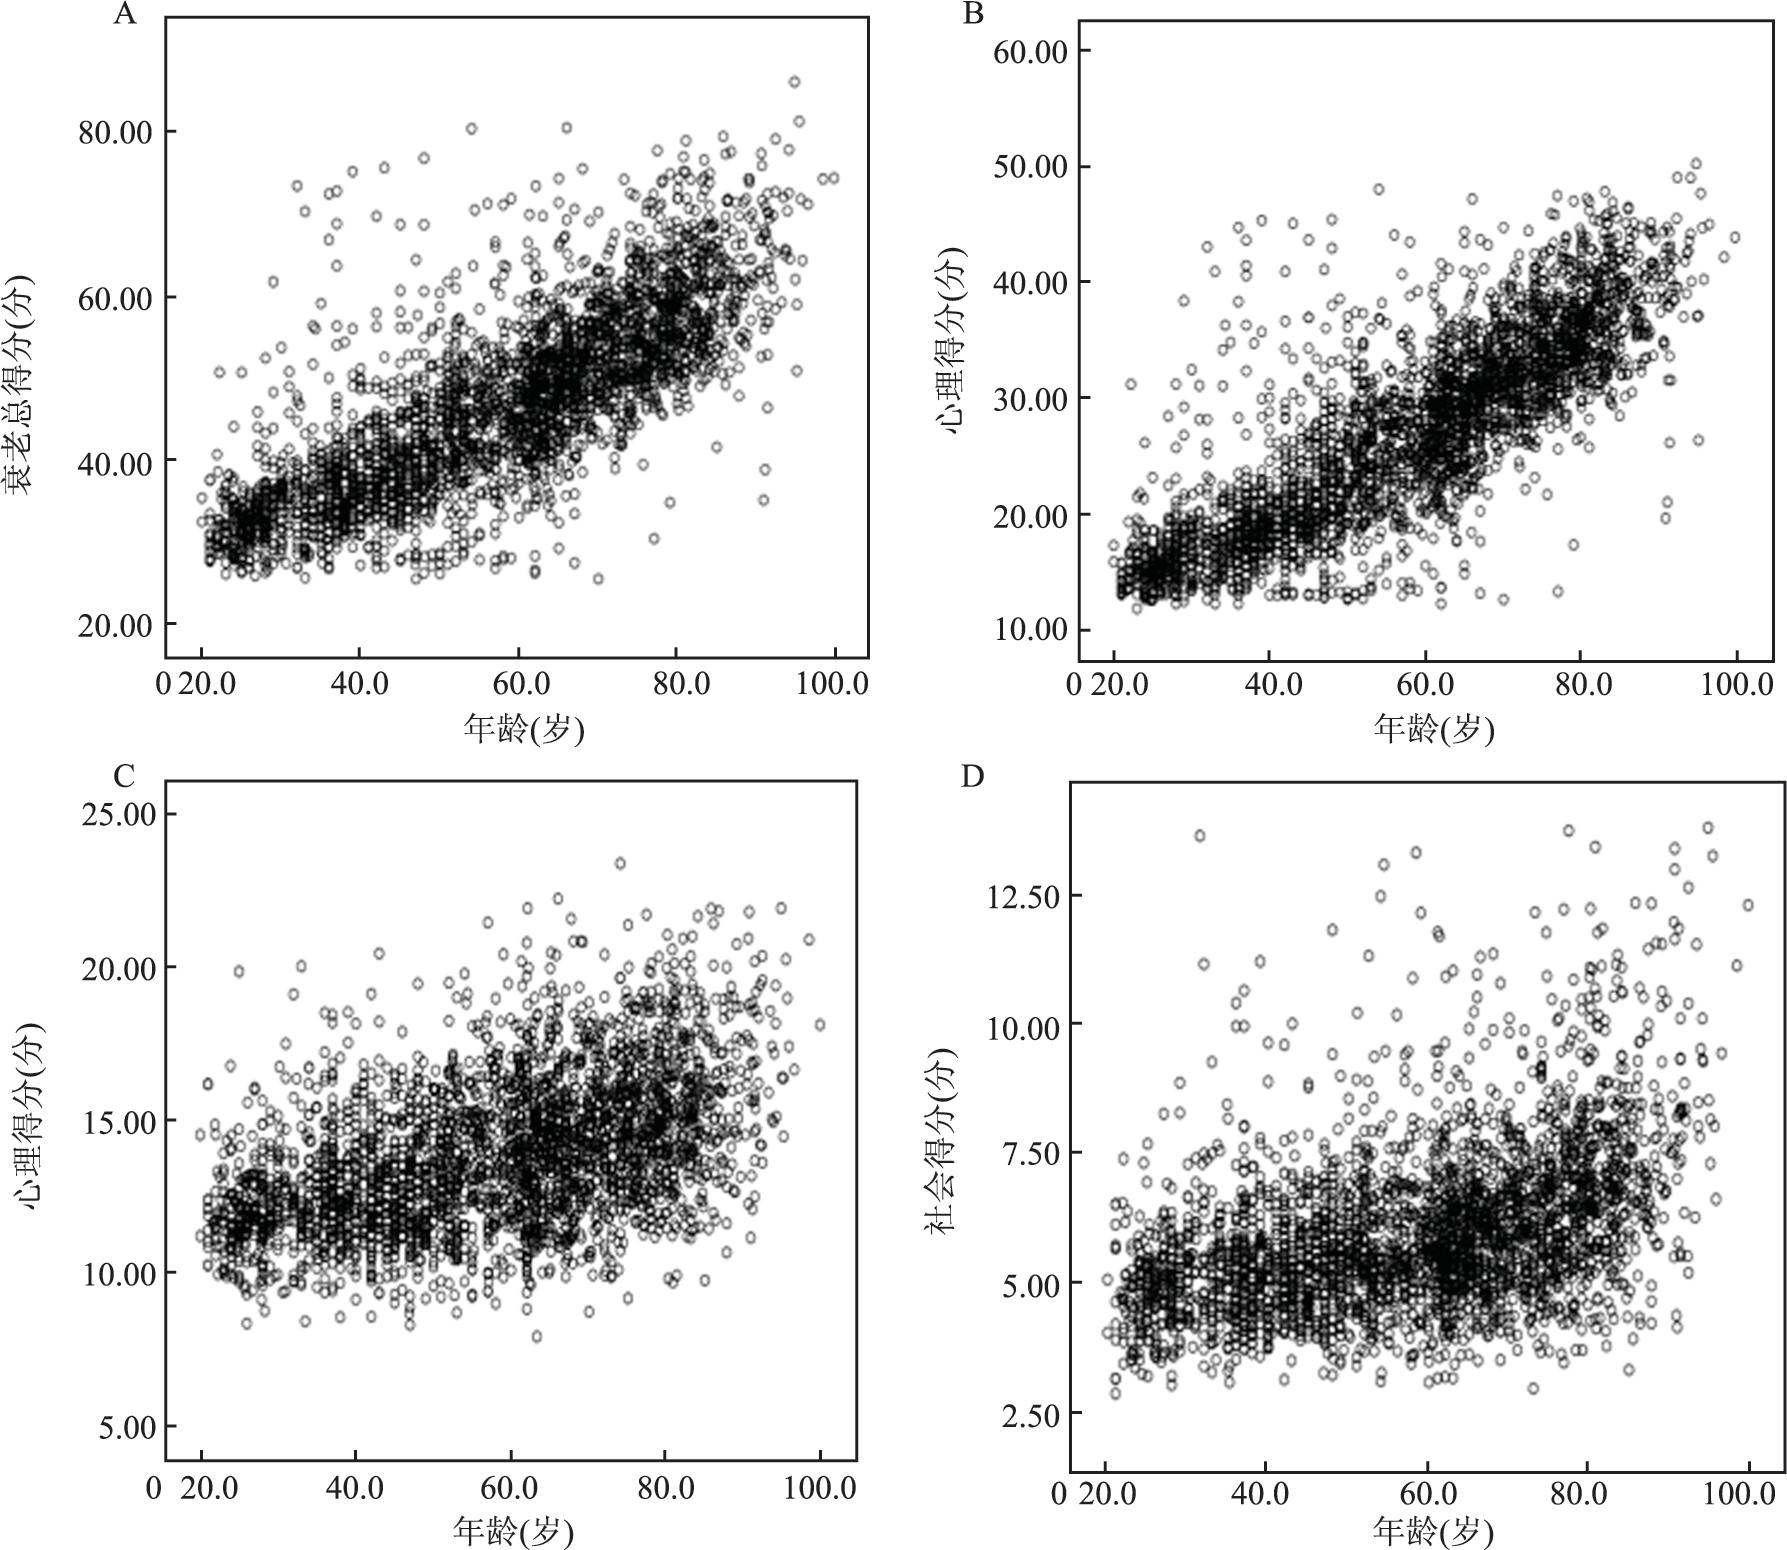
图 2 衰老度总分值、各维度分值与年龄关系的散点图
Figure 2. The scatter plot of the relationship between the aging score and age

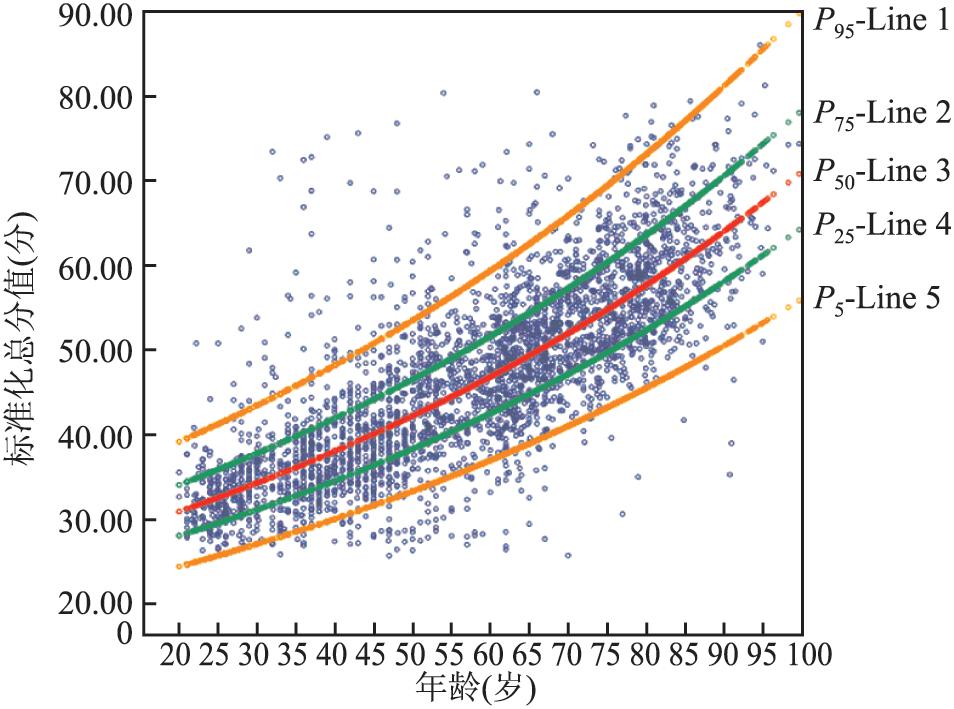
图 3 不同时序年龄人群衰老度标准化总分值、各维度分值曲线
Figure 3. Curves of the standardized total scores of aging and scores of each dimension among different age groups

图 4 衰老总分与时序年龄的拟合曲线(growth模型)
注:aLine3为衰老总分与时序年龄拟合的标准曲线; bLine2和Line4间区域标记的是人群中功能年龄的50%参考范围; cLine1和Line5间区域标记的是人群中功能年龄的90%参考范围。
Figure 4. 4 Growth model of aging score and age
表 1 不同年龄生理-心理-社会人体衰老度标准化总分值、维度分值分布水平及比较(x±s)
Table 1. Scores distribution comparison of total and dimensions of aging measurements(x±s)
变量 生理维度 心理维度 社会维度 衰老度总分 年龄(岁) 20~ 18.67±3.22 12.01±1.46 4.90±0.91 36.58±4.42 30~ 18.91±5.21 12.71±1.82 5.36±1.28 36.98±7.29 40~ 21.53±5.15 12.85±1.87 5.40±1.09 39.78±6.90 50~ 24.81±5.41 13.53±2.03 5.78±1.37 44.11±7.54 55~ 25.87±5.20 13.97±2.28 5.81±1.41 45.65±7.77 60~ 27.75±4.68 14.08±2.26 5.87±1.30 47.70±6.82 65~ 30.56±4.66 14.43±2.28 6.07±1.30 51.05±6.91 70~ 33.02±4.27 14.68±2.17 6.31±1.40 54.00±6.41 75~ 34.83±4.34 15.15±2.13 6.65±1.48 56.62±6.54 80~ 37.90±4.61 15.79±2.47 7.47±1.91 61.17±7.47 合计 27.06±8.33 13.90±2.38 5.97±1.55 46.93±11.07 F值 741.126a 105.741a 98.269a 564.935a P值 < 0.001 < 0.001 < 0.001 < 0.001 r值 0.970 0.774 0.744 1.000 P值 < 0.001 < 0.001 < 0.001 < 0.001 注:a基于Levene检验方差不齐, 选用Welch法近似F分布。  下载: 导出CSV
表 2 11种模型拟合和参数估计值
Table 2. 11 models fitting and parameter estimation
模型 R2 F值 P值 参数估计值 常数 β1 β2 β3 Linear 0.617 5 115.857 < 0.001 19.434 0.476 Logarithmic 0.575 4 302.445 < 0.001 -46.800 23.447 Inverse 0.496 3 136.289 < 0.001 66.101 -974.300 Quadratic 0.623 2 627.182 < 0.001 26.913 0.179 0.003 Cubic 0.623 1 751.128 < 0.001 28.267 0.094 0.004 -9.421 Compound 0.635 5 537.995 < 0.001 24.948 1.011 Power 0.610 4 966.586 < 0.001 5.657 0.522 S 0.542 3 764.513 < 0.001 4.254 -22.019 Growth 0.635 5 537.995 < 0.001 3.217 0.010 Exponential 0.635 5 537.995 < 0.001 24.948 0.010 Logistic 0.635 5 537.995 < 0.001 0.040 0.990 注:自变量为年龄, 因变量为衰老总的功能得分, 即个体的功能年龄。
下载: 导出CSV
-
[1] Fuente MDL. The immune system, a marker and modulator of the rate of aging[M]. Berlin: Springer-Verlag Berlin Heidelberg, 2014: 3-23. [2] Smeets CC, Codd V, Samani NJ, et al. Leukocyte telomere length in young adults born preterm: support for accelerated biological ageing[J]. PLoS One, 2015, 10(11): e0143951. DOI: 10.1371/journal.pone.0143951. [3] Aunan JR, Watson MM, Hagland HR, et al. Molecular and biological hallmarks of ageing[J]. Br J Surg, 2016, 103(2): 29-46. DOI: 10.1002/bjs.10053. [4] Gérald EP, Claudine PF, Nizet JL, et al. Physiological variations during aging[M]. Berlin: Springer-Verlag Berlin Heidelberg, 2015. [5] Christensen K, Thinggaard M, Oksuzyan A, et al. Physical and cognitive functioning of people older than 90 years: a comparison of two Danish cohorts born 10 years apart[J]. Lancet, 2013, 382(9903): 1507-1513. DOI: 10.1016/S0140-6736(13)60777-1. [6] 黄河浪, 刘星, 李翔, 等.人体衰老认识与测试指标(量表)构建的理论思维与方法[J].中华疾病控制杂志, 2018, 22(1): 85-88. DOI: 10.16462/j.cnki.zhjbkz.2018.01.019.Huang HL, Liu X, Li X, et al. Theoretical thinking and method of cognition of human aging and test index(scale)construction[J]. Chin J Dis Control Prev, 2018, 22(1): 85-88. DOI: 10.16462/j.cnki.zhjbkz.2018.01.019. [7] 叶兴, 田婷, 周跃平, 等.养老机构人群心理衰老程度的分布规律及其与年龄之间关系[J].中华疾病控制杂志, 2018, 22(4): 371-373. DOI: 10.16462/j.cnki.zhjbkz.2018.04.012.Ye X, Tian T, Zhou YP, et al. The distribution of psychological aging and its correlation with age among people from elder care institutions[J]. Chin J Dis Control Prev, 2018, 22(4): 371-373. DOI: 10.16462/j.cnki.zhjbkz.2018.04.012. [8] World Health Organization. International classification of functioning, disability and health(ICF)[M]. Geneva, 2008. DOI: 10.1002/9780470373699.speced1113. [9] 樊瑾, 于普林, 李小鹰.中国健康老年人标准(2013)解读2--健康评估方法[J].中华老年医学杂志, 2014, 33(1): 1-3. DOI:10.3760/cma.j.issn.02549026.2014.01.001.Fan J, Yu PL, Li XY. Chinese healthy seniors standard(2013)interpretation 2--health assessment methods[J]. Chinese Journal of Geriatrics, 2014, 33(1): 1-3. DOI: 10.3760/cma.j.issn.0254-9026.2014.01.001. [10] Wang L, Li Y, Li H, et al. Regional aging and longevity characteristics in China[J]. Arch Gerontol Geriatr, 2016, 67(67): 153-159. DOI: 10.1016/j.archger.2016.08.002. [11] Olivieri F, Capri M, Bonafè M, et al. Circulating miRNAs and miRNA shuttles as biomarkers: perspective trajectories of healthy and unhealthy aging[J]. Mech Ageing Dev, 2017, 165(Part B): 162-170. DOI: 10.1016/j.mad.2016.12.004. [12] Papaioannou A, Kennedy CC, Cranney A, et al. Risk factors for low BMD in healthy men age 50 years or older: a systematic review[J]. Osteoporosis Int, 2009, 20(4): 507-518. DOI: 10.1007/s00198-008-0720-1. [13] Fenton TR, Kim JH. A systematic review and meta-analysis to revise the Fenton growth chart for preterm infants[J]. BMC Pediatrics, 2013, 13(1): 59. DOI: 10.1186/1471-2431-13-59. [14] Holmgren A, Niklasson A, Gelander L, et al. Insight into human pubertal growth by applying the QEPS growth model[J]. BMC Pediatrics, 2017, 17(1): 107. DOI: 10.1186/s12887-017-0857-1. -


 点击查看大图
计量
- 文章访问数: 430
- HTML全文浏览量: 224
- PDF下载量: 58
- 被引次数: 0