

Mathematical modeling and infection control strategy of COVID-19
-
摘要:
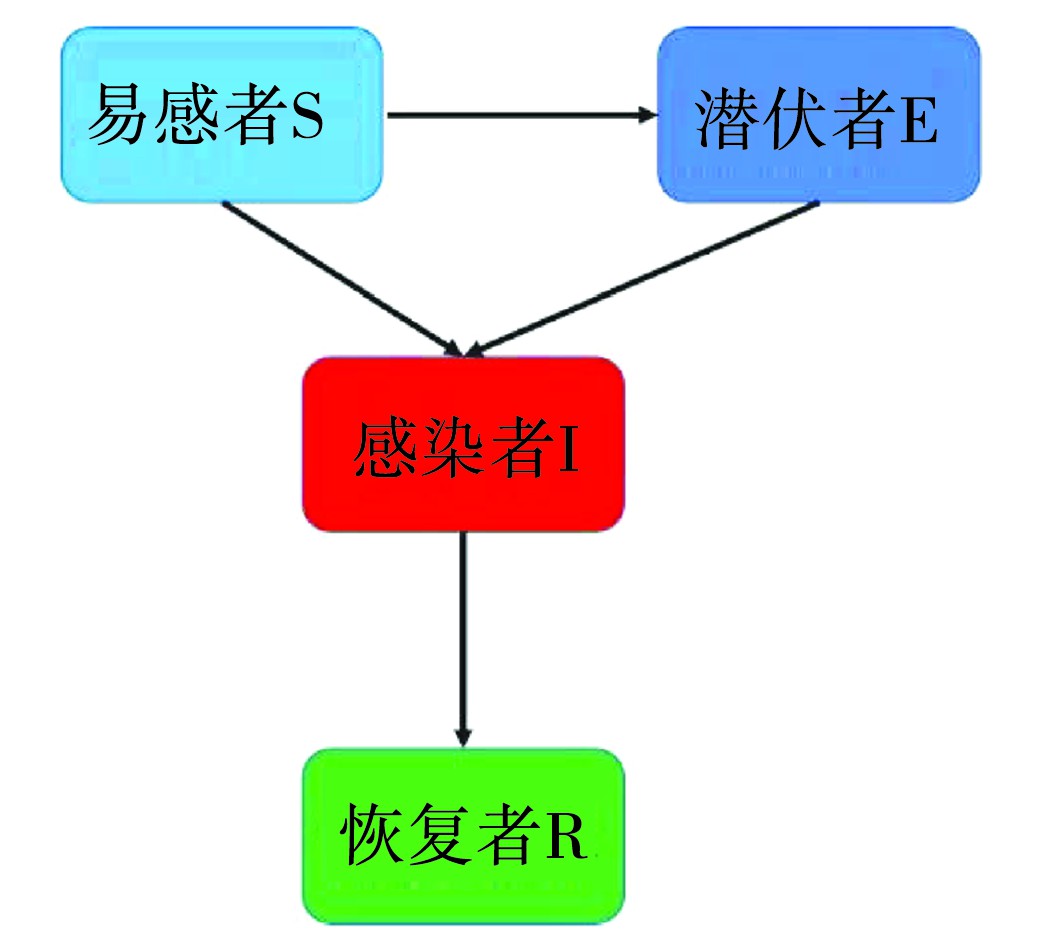
目的 针对新型冠状病毒肺炎(coronavirus disease 2019, COVID-19)感染进行数学建模, 预测疫情的发展趋势, 并为该病的防控提供参考。 方法 采用SEIR模型进行数学建模, 收集自2020年01月10日至2020年02月28日中国国家卫健委公布的当前感染人数、治愈人数和死亡人数的数据, 对模型进行参数估计; 并针对模型中不同参数的变化, 预测疾病未来发展趋势。 结果 根据COVID-19传播机制, 建立了SEIR模型, 并基于国家卫健委公布的数据, 通过fmincon和lsqnonlin函数对建立的数学模型进行分阶段拟合, 感染人数和移出人数的相关性分别为99.9%和99.8%, 预测的误差率分别为0.67%和0.89%。 结论 基于中国近一个月来COVID-19发病率数据, 本研究建立了精准度较高的数学模型, 通过数学模型的精确分析和有效预测, 结果提示对潜伏期人群和感染人群进行严格隔离, 同时不断提高患者的移出率, 可有效控制该传染病疫情。 Abstract:Objective The aim of this study was to propose a mathematical modeling for the coronavirus disease 2019(COVID-19) epidemic to predict the development trend of the epidemic, which will provide guidance to the epidemic prevention and control. Methods The mathematical modeling was performed using the SEIR model, and the data of the current number of infections, cures, and deaths issued by the National Health Commission of China(NHCC)from January 10, 2020 to February 28, 2020 were collected. Parameters of the model were estimated, and the trend of the epidemic was forecasted in terms of different parameters. Results Based on transmission mechanism of the COVID-19, a SEIR model was proposed. According to data published by NHCC, the parameters of mathematical model were estimated in different stages by fmincon and lsqnonlin functions. The correlations of the infected people and the removed were 99.9% and 99.8%, respectively. The prediction error rates were 0.67% and 0.89%, respectively. Conclusions Based on the data of COVID-19 in China issued by NHCC, this study established a mathematical model with effective prediction. The results suggest that the exposed and the infected population should be strictly isolated. At the same time, with continuously improving the removal rate of patients, the epidemic will be effectively under control and terminated. -
Key words:
- COVID-19 /
- Mathematical modeling /
- Parameter estimation /
- Prediction /
- Control strategy
-

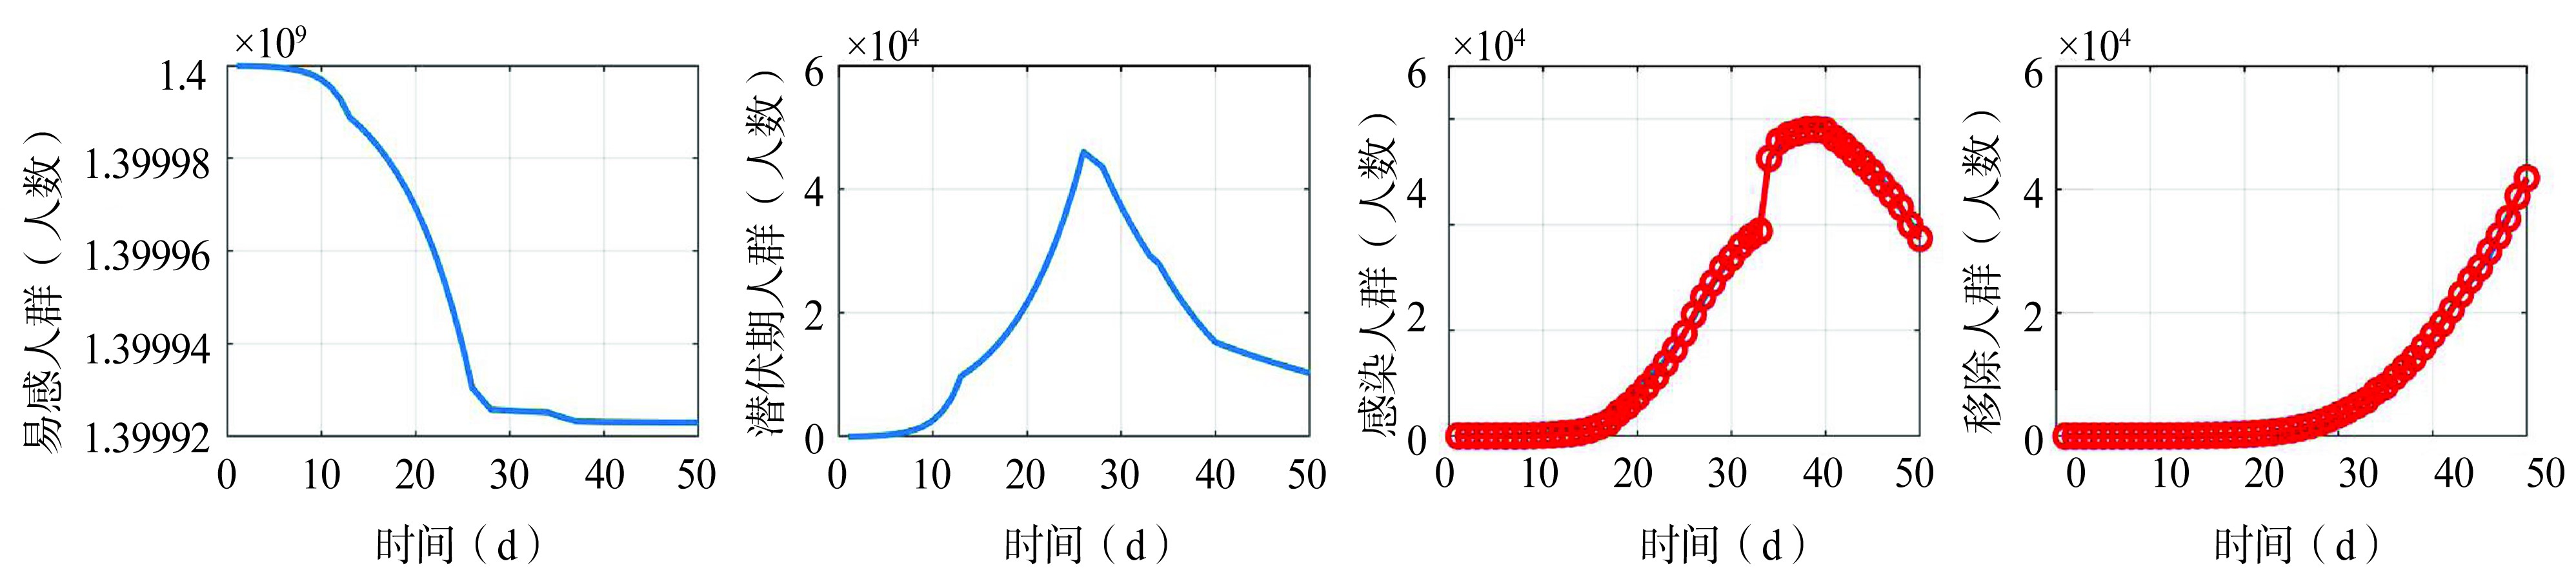
图 2 易感人群、潜伏期人群、感染人群和移出人群的动力变化趋势
Figure 2. The dyamic trends of susceptible, exposed, infected and removed

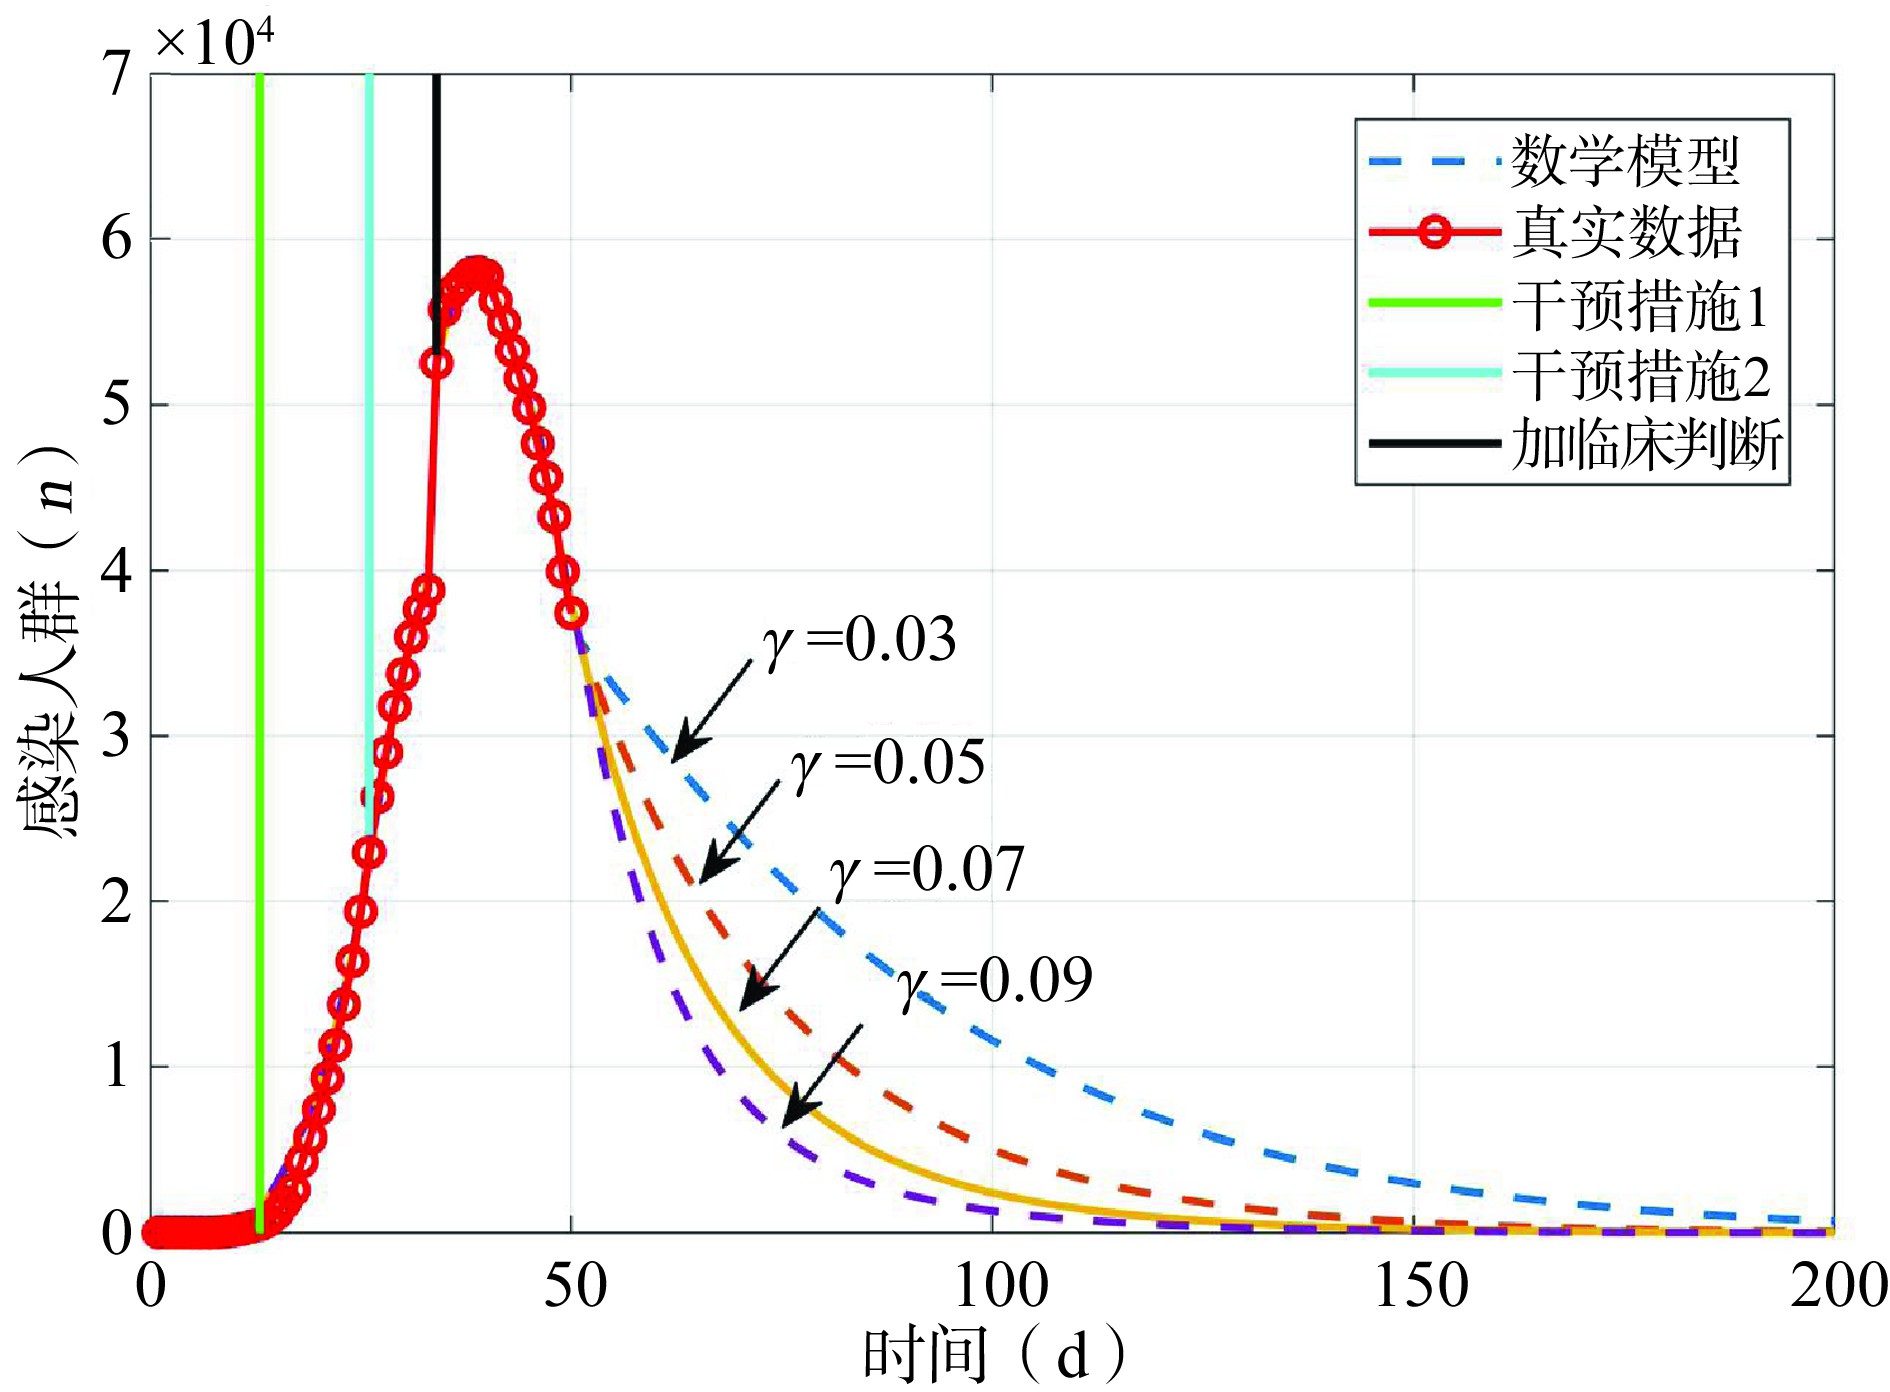
图 3 当移出率γ从0.03逐渐增加到0.09时感染者人数变化趋势
Figure 3. The dynamic trend of the infected when removal rate (γ) increased from 0.03 to 0.09

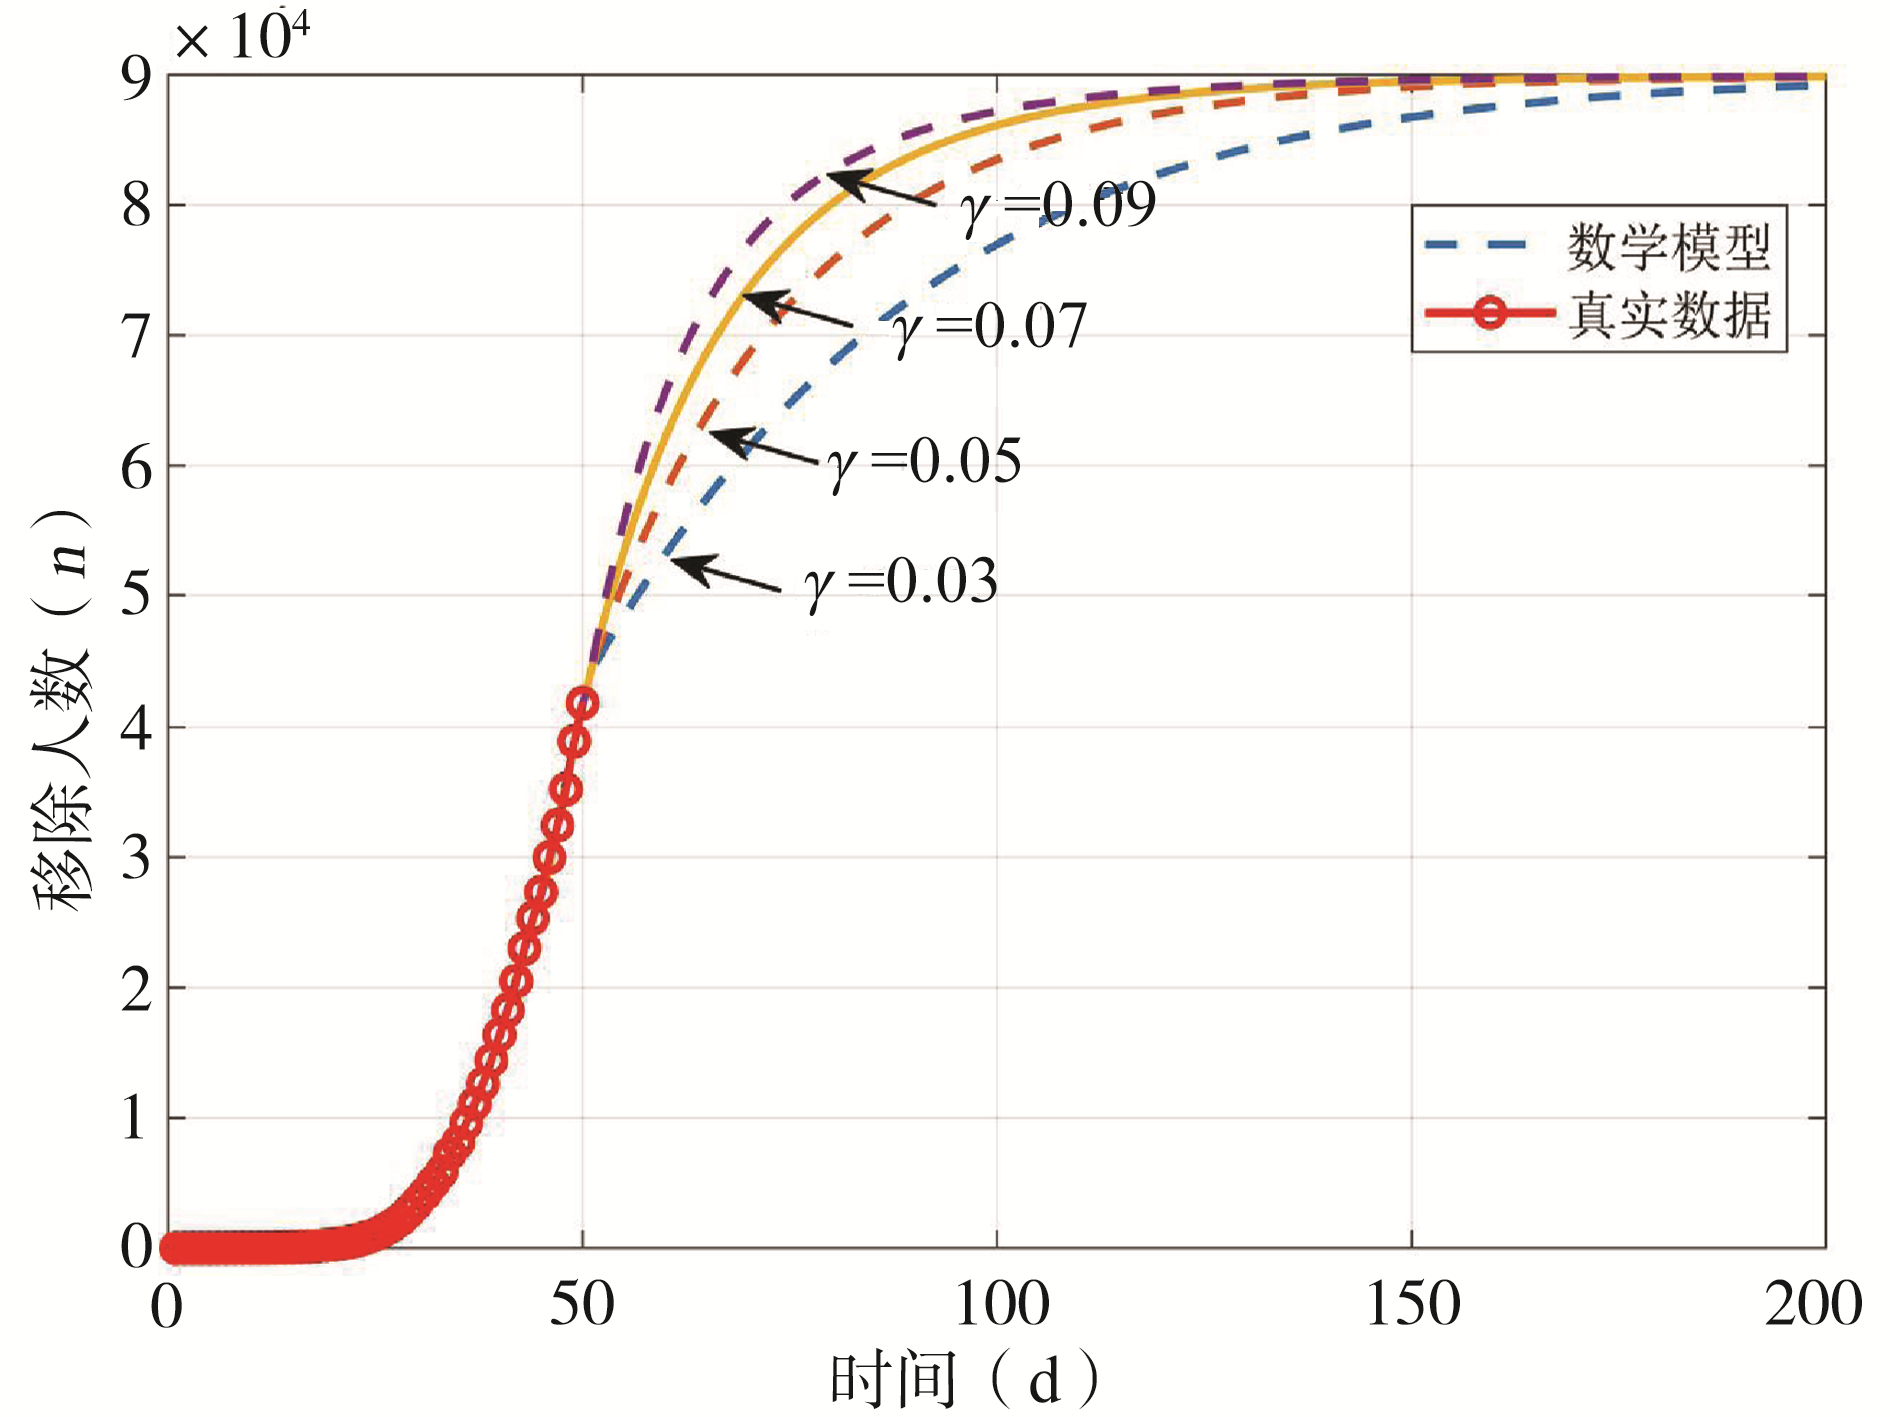
图 4 当移出率γ从0.03逐渐增加到0.09时移出人数变化趋势
Figure 4. The dynamic trend of the removed when removal rate (γ) increased from 0.03 to 0.09

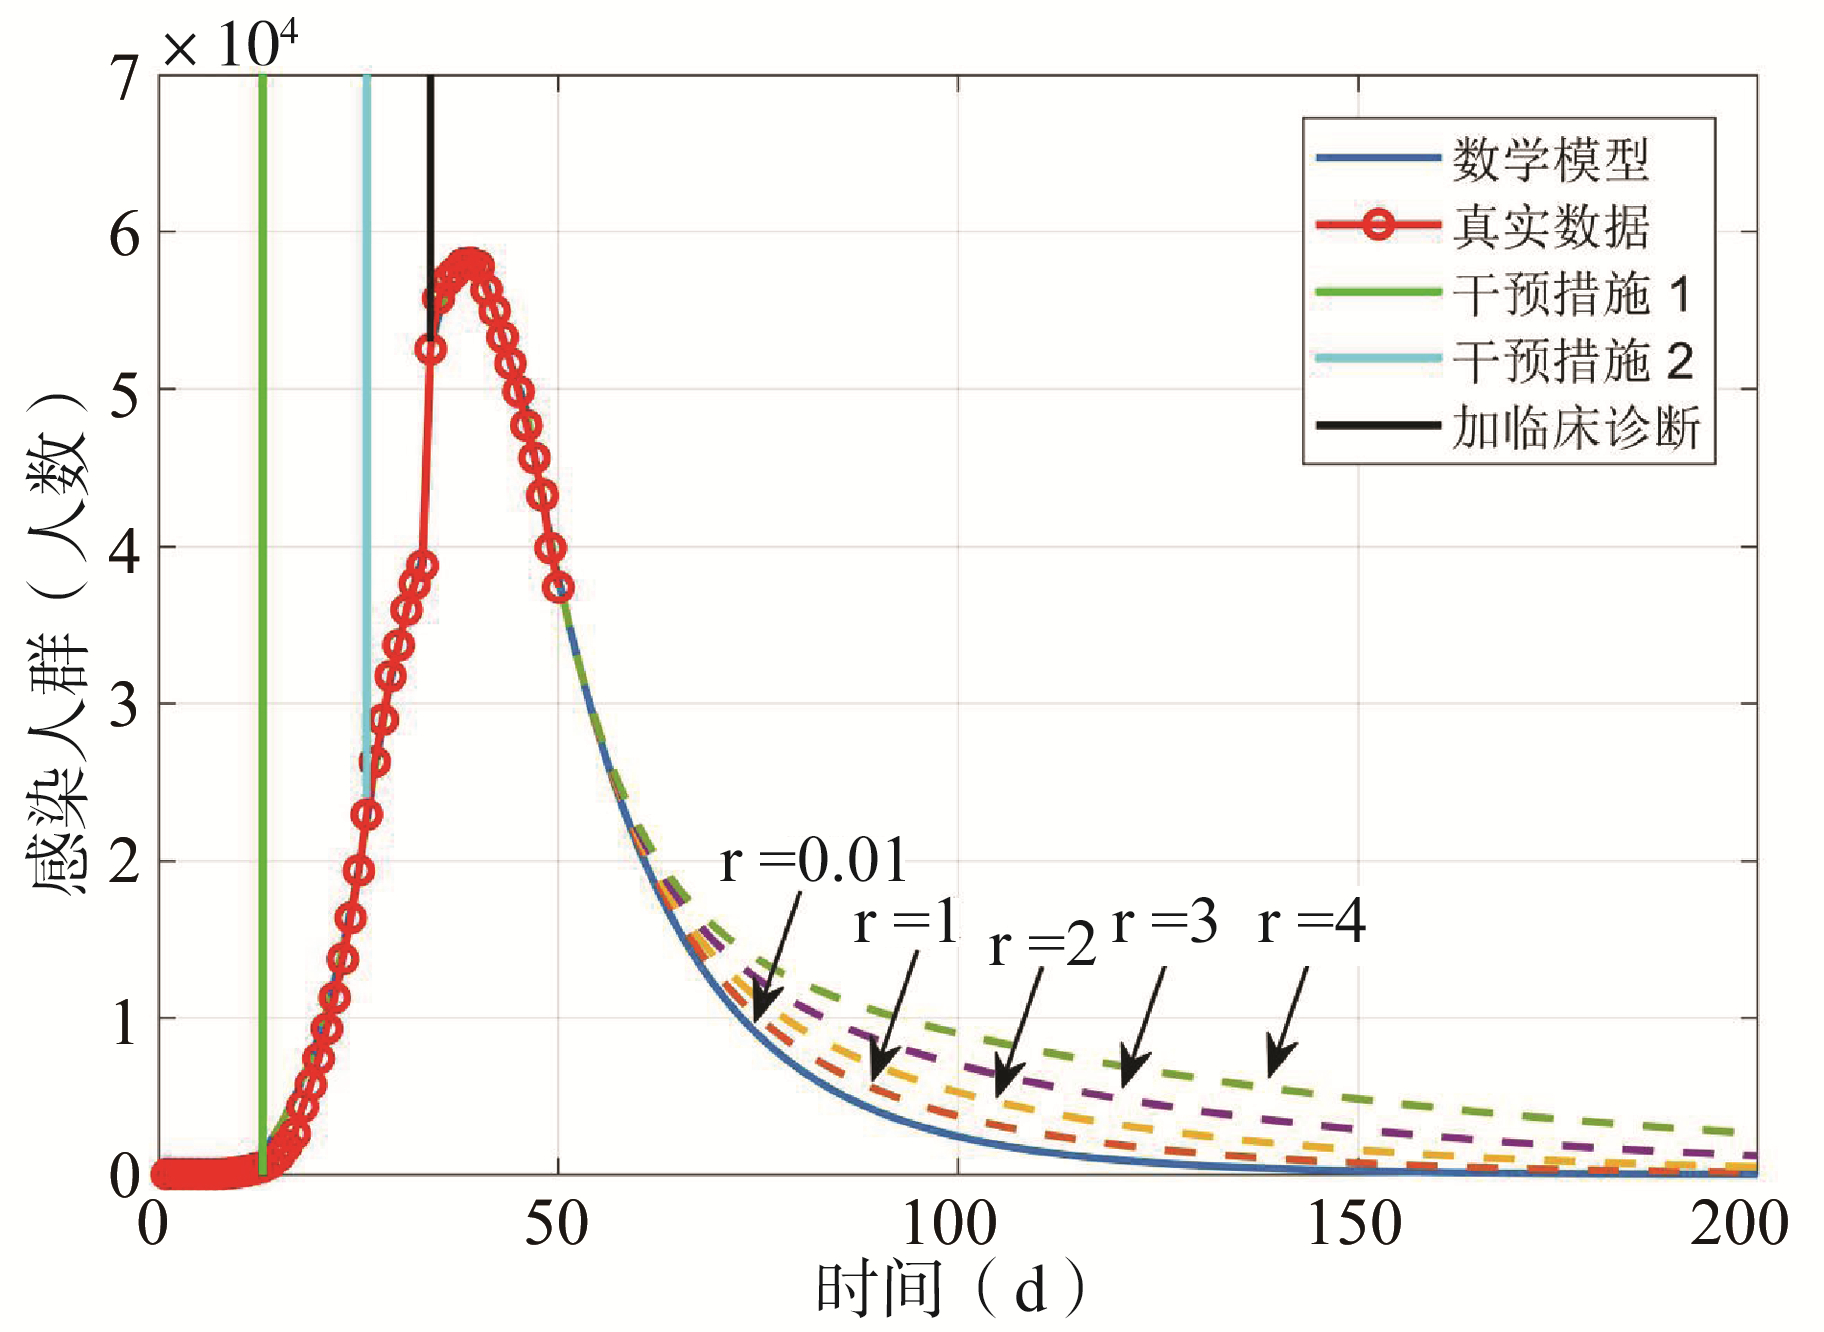
图 5 当确诊患者的接触率r从0.01逐渐增加到4时感染者人数变化趋势
Figure 5. The dynamic trend of the infected when contact rate of the infected (r) increased from 0.01 to 4

图 6 当潜伏者的接触率r2从0.1增加到5时感染者人数变化趋势
Figure 6. The dynamic trend of the infected when contact rate of the exposed (r) increased from 0.1 to 5
表 1 调查对象基本情况
Table 1. Baseline characteristics of participants
日期 天数 疑似感染人数 累计感染人数 治愈人数 死亡人数 现存感染人数a 移出人数b 1月10日24时 1 5 41 2 1 38 3 1月11日24时 2 10 41 6 1 34 7 1月12日24时 3 15 41 7 1 33 8 1月13日24时 4 20 41 7 1 33 8 1月14日24时 5 25 41 7 1 33 8 1月15日24时 6 30 41 12 2 27 14 1月16日24时 7 35 41 15 2 24 17 1月17日24时 8 40 62 19 2 41 21 1月18日24时 9 45 121 24 3 94 27 1月19日24时 10 50 198 25 3 170 28 1月20日24时 11 54 291 25 3 263 28 1月21日24时 12 200 440 28 9 403 37 1月22日24时 13 393 571 30 17 524 47 1月23日24时 14 1 072 830 34 25 771 59 1月24日24时 15 1 965 1 287 38 41 1 208 79 1月25日24时 16 2 684 1 975 49 56 1 870 105 1月26日24时 17 5 794 2 744 51 80 2 613 131 1月27日24时 18 6 973 4 515 60 106 4 349 166 1月28日24时 19 9 239 5 974 103 132 5 739 235 1月29日24时 20 12 167 7 711 124 170 7 417 294 1月30日24时 21 15 238 9 692 171 213 9 308 384 1月31日24时 22 17 988 11 791 243 259 11 289 502 2月01日24时 23 19 544 14 380 328 304 13 748 632 2月02日24时 24 21 558 17 205 475 361 16 369 836 2月03日24时 25 23 214 20 438 632 425 19 381 1 057 2月04日24时 26 23 260 24 324 892 490 22 942 1 382 2月05日24时 27 24 702 28 018 1 153 563 26 302 1 716 2月06日24时 28 26 359 31 161 1 540 636 28 985 2 176 2月07日24时 29 27 657 34 546 2 050 722 31 774 2 772 2月08日24时 30 28 942 37 198 2 649 811 33 739 3 460 2月09日24时 31 23 589 40 171 3 281 908 35 982 4 189 2月10日24时 32 21 675 42 638 3 996 1 016 37 626 5 012 2月11日24时 33 16 067 44 653 4 740 1 113 38 800 5 853 2月12日24时 34 13 435 59 804 5 911 1 367 52 526 7 278 2月13日24时 35 10109 63 851 6 723 1 380 55 748 8 103 2月14日24时 36 8 969 66 492 8 096 1 523 56 873 9 619 2月15日24时 37 8 228 68 500 9 419 1 665 57 416 11 084 2月16日24时 38 7 264 70 548 10 844 1 770 57 934 12 614 2月17日24时 39 6 242 72 436 12 552 1 868 58 016 14 420 2月18日24时 40 5 248 74 185 14 376 2 004 57 805 16 380 2月19日24时 41 4 922 74 576 16 155 2 118 56 303 18 273 2月20日24时 42 5 206 75 465 18 264 2 236 54 965 20 500 2月21日24时 43 5 365 76 288 20 659 2 345 53 284 23 004 2月22日24时 44 4 148 76 936 22 888 2 442 51 606 25 330 2月23日24时 45 3 434 77 150 24 734 2 592 49 824 27 326 2月24日24时 46 2 824 77 658 27 323 2 663 47 672 29 986 2月25日24时 47 2 491 78 064 29 745 2 715 45 604 32 460 2月26日24时 48 2 359 78 497 32 495 2 744 43 258 35 239 2月27日24时 49 2 308 78 824 36 117 2 788 39 919 38 905 2月28日24时 50 1 418 79 251 39 002 2 835 37 414 41 837 注:a现存感染人数=累计感染人数-治愈人数-死亡人数; b移出人数=治愈人数+死亡人数。  下载: 导出CSV
表 2 预测2月16到28日的感染人数和移出人数
Table 2. The forecasting infected and removed from February 16 to February 28
日期 天数 现存感染人数 预测感染人数 移出人数 预测移出人数 2月16日24时 38 57 934 58 217 12 614 12 684 2月17日24时 39 58 016 58 338 14 420 14 431 2月18日24时 40 57 805 58 274 16 380 16 181 2月19日24时 41 56 303 56 552 18 273 18 512 2月20日24时 42 54 965 54 875 20 500 20 774 2月21日24时 43 53 284 53 242 23 004 22 969 2月22日24时 44 51 606 51 654 25 330 25 099 2月23日24时 45 49 824 50 107 27 326 27 165 2月24日24时 46 47 672 48 603 29 986 29 169 2月25日24时 47 45 604 45 682 32 460 32 572 2月26日24时 48 43 258 42 945 35 239 35 769 2月27日24时 49 39 919 40 383 38 905 38 775 2月28日24时 50 37 414 37 982 41 837 41 602
下载: 导出CSV
-
[1] Tang B, Wang X, Li Q, et al. Estimation of the transmission risk of the 2019-nCoV and its implication for public health interventions[J]. J Clin Med, 2020, 9(2): 462-474.DOI: 10.2139/ssrn.3525558. [2] Gabriel L, Joseph W. Real-time nowcast and forecast on the extent of the Wuhan CoV outbreak, domestic and international spread[EB/OL]. (2020-01-27)[2020-02-12]. https://www.med.hku.hk/f/news/3549/7418/Wuhan-coronavirus-outbreak_AN-UPDATE_20200127.pdf. [3] Read JM, Bridgen JR, Cummings DA, et al. Novel coronavirus 2019-nCoV: early estimation of epidemiological parameters and epidemic predictions[J]. medRxiv, 2020.01. 23.20018549.DOI: 10.1101/2020.01.23.20018549. [4] Wu JT, Leung K, Leung GM. Nowcasting and forecasting the potential domestic and international spread of the 2019-nCoV outbreak originating in Wuhan, China: a modelling study[J]. Lancet, 2020, 395(10225): 689-697.DOI: 10.1016/S0140-6736(20)30260-9. [5] Chen TM, Rui J, Wang QP, et al. A mathematical model for simulating the transmission of Wuhan novel Coronavirus[J]. bioRxiv, 2020.01. 19.911669.DOI: 10.1101/2020.01.19.911669. [6] Chen Y, Cheng J, Jiang Y, et al.A time delay dynamical model for outbreak of 2019-nCoV and the parameter identification[J]. arXiv, 2002.00418v1.2020 [7] Ai LZ. Modelling the epidemic trend of the 2019-nCOV outbreak in Hubei Province, China[J]. medRxiv, 2020.01. 30.20019828.DOI: https: 10. 1101/2020. 01. 30. 20019828. [8] Zhou T, Liu QH, Yang ZM, et al.Preliminary prediction of the basic reproduction number of the Wuhan novel coronavirus 2019- nCoV[J].arXiv, 2001.10530. [9] Liu T, Hu JX, Kang M, et al. Transmission dynamics of 2019 novel coronavirus(2019-nCoV)[J]. bioRxiv, 2020.01. 25.DOI: 10.1101/2020.01.25.919787(preprint). [10] 马知恩.传染病动力学的数学建模与研究[M].北京科学出版社, 2004.Ma ZE. Mathematical modeling and research of infectious disease dynamics[M]. Beijing Science Press, 2004. [11] Chowell G, Castillo-Chavez C, Fenimore PW, et al. Model parameters and outbreak control for SARS[J]. Emerg Infect Dis, 2004, 10(7): 1258-1263.DOI: 10.3201/eid1007.030647. [12] Zhang C, Wang M. Origin time and epidemic dynamics of the 2019 novel coronavirus[J]. bioRxiv, 2020.01. 25.919688.DOI: 10.1101/2020.01.25.919688. [13] Natsuko I, Ilaria D, Anne C, et. al. Estimating the potential total number of novel Coronavirus cases in Wuhan City, China[EB/OL]. (2020-01-17)[2020-02-12]. https://www.preventionweb.net/go/70092. [14] Gardner L, Zlojutro A, Rey D, et. al. Modeling the spread of 2019-nCoV[EB/OL]. (2020-01-26)[2020-02-12]. https://systems.jhu.edu/wp-content/uploads/2020/01/Gardner-JHU_nCoV-Modeling-Report_Jan-26.pdf. -


 点击查看大图
计量
- 文章访问数: 1275
- HTML全文浏览量: 568
- PDF下载量: 201
- 被引次数: 0