

Analysis of gut microbiomes and dietary patterns in patients with type a combination of 2 diabetes mellitus and obesity
-
摘要:
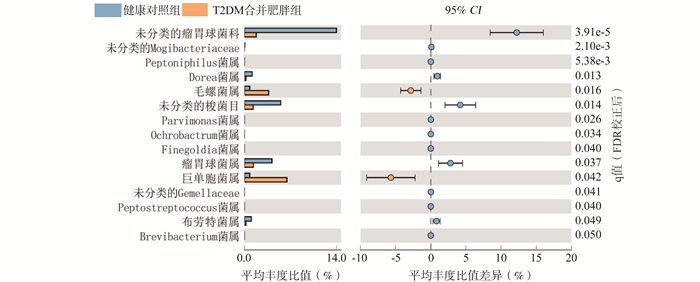
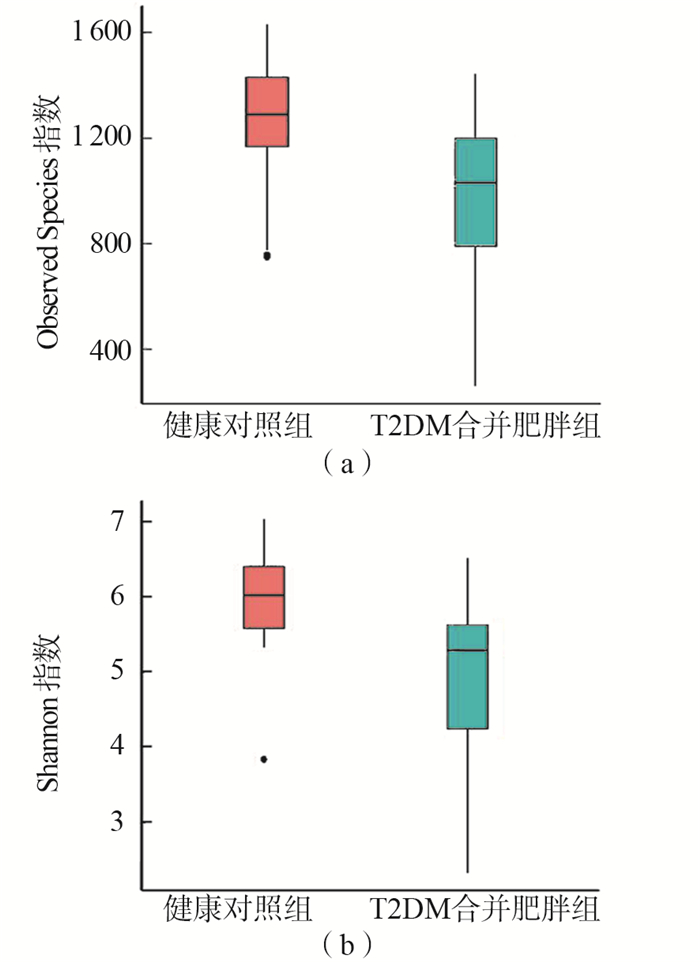
目的 观察2型糖尿病(type 2 diabetes mellitus,T2DM)合并肥胖患者膳食结构及肠道菌群结构与健康人群的差异,为T2DM合并肥胖患者通过营养治疗重建肠道菌群提供依据。 方法 选取32例新诊断为T2DM合并肥胖的患者及32例健康人员分别作为观察组和对照组。收集两组研究对象1年内的食物摄入情况并运用主成分分析法比较2组人群膳食结构差异,同时采集粪便提取DNA后使用Illumina MiSeq高通量测序平台分析两组研究对象肠道菌群的结构和丰度差异。 结果 膳食结构方面,观察组的主要膳食结构特点是油脂摄入较多蔬菜摄入较少,而健康对照组则是一种主食、蔬菜、优质蛋白比例较均衡的膳食模式。肠道菌群分析结果:观察组粪便样本中菌群多样性降低,菌属Welch's t检验发现与膳食纤维消化相关的瘤胃球菌属(P < 0.001,FDR=0.037)、豆类消化相关的梭菌属(P < 0.001,FDR=0.014)及短链脂肪酸产生相关的布劳特菌属(P=0.042,FDR=0.049)丰度较健康人群降低。 结论 膳食结构不均衡及膳食纤维摄入不足可能通过影响肠道菌群的结构和丰度从而与T2DM合并肥胖的发生相关,提示T2DM合并肥胖组人群的营养治疗应重视膳食结构平衡和膳食纤维的补充。 Abstract:Objective To observe the differences of diet structure as well as intestinal microflora between patients with type 2 diabetes mellitus(T2DM) combined with obesity and healthy people, so as to provide evidence for the reconstruction of intestinal microflora in patients with type 2 diabetes mellitus combined with obesity through nutritional therapy. Methods 32 patients and 32 health volunteers were selected according to the inclusion and exclusion criterias. A Semi-quantitative food frequency method as well as 3d-24h dietary investigations were used to collect the food intake data of the two groups within one year, and the principal component analysis was used to evaluate the dietary patterns differences of the two years.Meanwhile, the differences of abundance and the composition of the gut microbiota were analyzed by Illumina Miseq high-throughput sequencing after feces collection and DNA extraction. Results The main dietary pattern characteristic of T2DM combined with obesity group was the consumption of more fat while the vegetables intake was low, while the healthy volunteers had a more balanced dietary pattern of cereals, vegetables and protein. In terms of the gut microbiota, the diversity in patients was significantly lower than that in healthy groups. Below the phylum level, the relative abundance of Ruminococcaceae(P < 0.001, FDR=0.037), Clostridiales(P < 0.001, FDR=0.014)and Blautia(P=0.042, FDR=0.049)which were correlated with dietary fiber was lower in T2DM combined with obesity group when compared with health group. Conclusions Imbalanced dietary pattern and insufficient dietary fiber intake may be related to the occurrence of T2DM combined with obesity by affecting the structure and abundance of intestinal microecology.For the nutritional treatment of T2DM patients combined with obesity, attention should be paid to the dietary structure balance and dietary fiber supplement. -

图 1 Observed Species指数箱型图-(a)、Shannon指数箱型图-(b)
Figure 1. The comparison of α diversity index between two groups

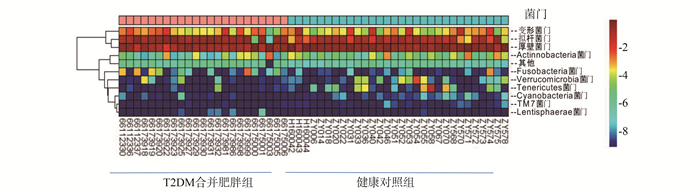
图 2 两组研究对象门分类水平的聚类热图
Figure 2. The cluster heat maps at phylum classification level in two groups

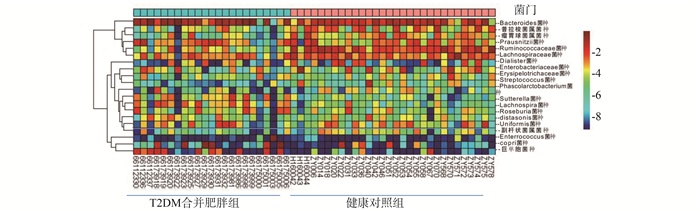
图 3 两组研究对象属分类水平的聚类热图
Figure 3. The cluster heat maps at genus classification level between two groups

图 4 两组研究对象种分类水平的聚类热图
Figure 4. The cluster heat maps at species classification level between two groups

图 5 两组研究对象差异菌属分析
Figure 5. STAMP analysis of key bacterial genus differences between two groups
表 1 T2DM合并肥胖组与对照组人群基本情况比较(x±s)
Table 1. Comparison of basic information between T2DM combined with obesity and control group (x±s)
变量 T2DM合并肥胖组 健康对照组 t值 P值 年龄(岁) 41.60±6.85 42.67±6.36 0.911 0.711 性别(男/女) 17/15 18/14 0.005 0.673 体重(kg) 74.48±15.50 62.84±10.15 5.567 < 0.001a BMI(kg/m2) 32.14±3.25 22.52±2.87 3.154 < 0.001a 腰围(cm) 103.42±11.11 86.18±9.61 5.774 < 0.001a FPG (mmol/L) 7.82±2.04 5.38±1.45 2.089 0.191 HbA1c(%) 7.38±1.45 5.15±0.35 3.142 0.316 TC(mmol/L) 5.11±1.31 4.29±1.16 3.999 0.013a TG(mmol/L) 2.83±2.44 1.40±0.99 4.663 0.002a 外出就餐频率(周) 4.11±4.53 7.84±5.49 4.353 0.021a 注:与健康对照组比较,a表示P < 0.05  下载: 导出CSV
表 2 T2DM合并肥胖组和健康对照组食物摄入量对比(x±s)
Table 2. Comparison of food intake between T2DM combined with obesity and control group (x±s)
食物 膳食指南推荐值(g) 每日摄入量(g) t值 P值 T2DM合并肥胖组 健康对照组 谷物和根茎类 250~400 374.3±125.8 355.0±103.6 0.874 0.383 蔬菜 300~500 255.6±79.4 300.0±68.3 4.988 < 0.001 水果 200~350 104.8±37.3 250.0±56.5 4.615 < 0.001 肉类 40~75 126.4±41.7 75.0±36.8 3.449 0.001 水产品 40~75 19.4±33.1 22.4±31.3 1.159 0.181 蛋类 40~50 25.0±25.1 50.0±24.5 1.824 0.065 奶制品 300 118.7±54.8 176.4±79.5 0.237 0.813 豆类 25~35 15.1±20.4 32.8±19.7 3.328 0.001 食用油 25~30 78.4±26.4 56.3±16.6 6.030 < 0.001
下载: 导出CSV
表 3 T2DM合并肥胖组和健康对照组膳食结构主成分分析
Table 3. Principal component analysis of dietary pattern in T2DM combined with obesity group and control group
T2DM合并肥胖组 健康对照组 特征向量1 特征向量2 特征向量3 特征向量4 特征向量5 特征向量1 特征向量2 特征向量3 特征向量4 特征向量5 谷物和根茎类 -0.54 0.49 -0.43 0.73 0.08 0.60 0.87 0.32 0.02 0.39 蔬菜 0.04 0.40 0.09 -0.28 0.38 0.63 0.48 -0.15 0.32 0.49 水果 0.48 0.48 0.45 0.28 -0.01 0.13 -0.25 0.50 -0.09 0.40 肉类 -0.70 0.32 0.34 -0.13 0.22 0.57 0.27 -0.07 -0.14 0.15 水产品 -0.49 0.42 0.50 0.17 -0.14 0.24 0.13 0.41 0.14 -0.09 蛋类 0.42 -0.32 0.06 0.29 0.64 0.52 -0.23 0.70 0.41 -0.26 奶制品 0.53 -0.30 0.36 0.31 -0.47 0.52 0.08 0.31 -0.63 -0.24 豆类 0.15 0.23 -0.56 -0.12 -0.25 0.63 0.41 -0.17 0.52 -0.27 食用油 -0.76 -0.54 -0.08 0.30 0.12 -0.52 0.35 0.23 0.09 0.04 特征根 2.30 1.44 1.21 1.02 0.93 2.36 1.49 1.21 0.99 0.79 贡献率 0.25 0.16 0.13 0.11 0.10 0.26 0.16 0.13 0.11 0.08 累计贡献率 0.25 0.41 0.55 0.66 0.76 0.26 0.42 0.56 0.67 0.76
下载: 导出CSV
-
[1] Baothman OA, Zamzami MA, Taher I, et al. The role of gut microbiota in the development of obesity and diabetes[J]. Lipids Health Dis, 2016, 15:108. DOI: 10.1186/s12944-016-0278-4. [2] Cani PD, Osto M, Geurts L, et al. Involvement of gut microbiota in the development of low-grade inflammation and type 2 diabetes associated with obesity[J]. Gut Microbes, 2012, 3(4):279-288. DOI: 10.4161/gmic.19625. [3] Alberti KG, Zimmet PZ. Definition, diagnosis and classification of diabetes mellitus and its complications. Part 1:diagnosis and classification of diabetes mellitus provisional report of a WHO consultation[J]. Diabet Med, 1998, 15(7):539-553. DOI:10.1002/(SICI)1096-9136(199807)15:7<539::AID-DIA668>3.0.CO;2-S. [4] 中国肥胖问题工作组.中国成人超重和肥胖症预防与控制指南(节录)[J].营养学报, 2004, (1):1-4. DOI: 10.13325/j.cnki.acta.nutr.sin.2004.01.001.Group of China Obesity Task Force. Guidance for the prevention and control of overweight and obesity in Chinese adults[J]. Acta Nutrimenta Sinica, 2004, (1):1-4. DOI: 10.13325/j.cnki.acta.nutr.sin.2004.01.001. [5] Zhang C, Zhang M, Wang S, et al. Interactions between gut microbiota, host genetics and diet relevant to development of metabolic syndromes in mice[J]. ISME J, 2010, 4(2):232-241. DOI: 10.1038/ismej.2009.112. [6] Wan Y, Wang F, Yuan J, et al. Effects of dietary fat on gut microbiota and faecal metabolites, and their relationship with cardiometabolic risk factors:a 6-month randomised controlled-feeding trial[J]. Gut, 2019, 68(8):1417-1429. DOI: 10.1136/gutjnl-2018-317609. [7] Turnbaugh PJ, Ley RE, Mahowald MA, et al. An obesity-associated gut microbiome with increased capacity for energy harvest[J]. Nature, 2006, 444(7122):1027-1031. DOI: 10.1038/nature05414. [8] Turnbaugh PJ, Hamady M, Yatsunenko T, et al. A core gut microbiome in obese and lean twins[J]. Nature, 2009, 457(7228):480-484. DOI: 10.1038/nature07540. [9] Chassard C, Delmas E, Robert C, et al. Ruminococcus champanellensis sp. nov., a cellulose-degrading bacterium from human gut microbiota[J]. Int J Syst Evol Microbiol, 2012, 62(1):138-143. DOI: 10.1099/ijs.0.027375-0. [10] Den Besten G, Van Eunen K, Groen AK, et al. The role of short-chain fatty acids in the interplay between diet, gut microbiota, and host energy metabolism[J]. J Lipid Res, 2013, 54(9):2325-2340. DOI: 10.1194/jlr.R036012. [11] Xu J, Chen HB, Li SL. Understanding the molecular mechanisms of the interplay between herbal medicines and gut microbiota[J]. Med Res Rev, 2017, 37(5):1140-1185. DOI: 10.102/med.21431. -


 点击查看大图
计量
- 文章访问数: 266
- HTML全文浏览量: 147
- PDF下载量: 33
- 被引次数: 0