

-
摘要:
目的 研究湖南省日均气温对COVID-19日发病数的滞后影响,为疫情的有效防控提供科学依据。 方法 本研究对2020年1月21日―2020年3月2日湖南省气象因素和空气质量因素与COVID-19日发病数进行Spearman相关分析和分布滞后非线性模型分析。 结果 观察期间,湖南省新型冠状病毒肺炎报告新发病例共1 018例。分布滞后非线性模型结果显示,日均气温与COVID-19日发病数的关系呈非线性,累积发病风险随气温的升高而降低,且发病人群的气温风险最低点为0 ℃。高温对日发病数的影响为短期即时效应,低温对每日发病人数的影响具有滞后性,滞后效应长达12 d,当日均温为-5 ℃,滞后天数为8 d时,相对危险度最高(RR=2.20, 95% CI=1.16~4.19),且高温(10 ℃)较低温(6 ℃)影响更为显著。 结论 气温是影响湖南省COVID-19发病的因素,且有滞后性;高温和低温均可导致发病风险升高,应针对脆弱人群和危重患者加强防护措施从而降低发病风险。 Abstract:Objective To explore the lag effect of daily average temperature on the incidence of coronavirus disease 2019 (COVID-19) in Hunan Province and to provide scientific evidences for effective prevention of COVID-19. Methods The meteorological factors, the air quality factors and the data conincidence of COVID-19 reported in Hunan Province during January 21, 2020 to March 2, 2020 were collected. Spearman correlation and distributed lag non-linear model analysis were performed. Results A total of 1 018 COVID-19 cases were reported in Hunan Province. The distribution lag non-linear model results showed that the influence of daily average temperature on the incidence of COVID-19 presented a nonlinear relationship. The cumulative relative incidence risk of COVID-19 decreased with the increase of daily average temperature, and the lowest temperature risk of the patients was 0 ℃. Both cold temperature and hot temperature increased incidence risk of COVID-19. It was indicated that the hot effects were immediate, however, the cold effects with obvious lag effect persisted up to 12 days. The highest relative risk of COVID-19 incidence was associated with lag 8-day daily average temperature of -5 ℃(RR=2.20, 95% CI=1.16-4.19). The influence of high temperature(10 ℃) was more significant than that of low temperature(6 ℃). Conclusion The daily average temperature, especially cold or hot temperature, was an important influencing factor of the incidence of COVID-19 in Hunan Province, which had lag influence on the incidence of COVID-19. We suggested that some related preventive measures should be adopted to protect vulnerable population and severe patients to reduce the incidence risk. -

图 1 2020年1月21日―2020年3月2日湖南省COVID-19日发病数(a)和日均气温(b)的时间序列
Figure 1. The time series diagram of the incidence of COVID-19 and average daily air temperature during January 21, 2020-March 2, 2020 in Hunan Province

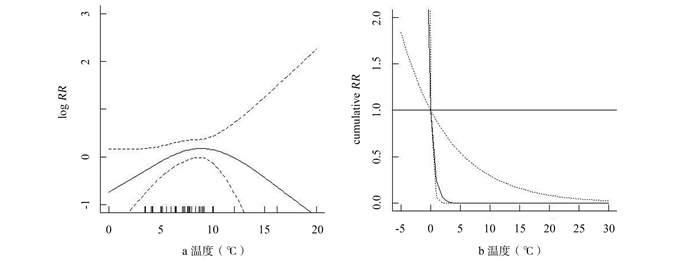
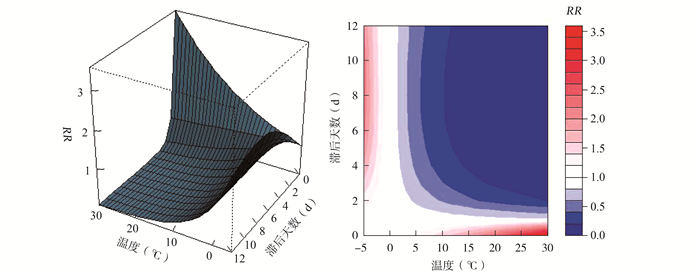
图 2 湖南省日均气温与发病人数的暴露反应关系
Figure 2. The exposure-response relationship between average daily air temperature and the incidence of COVID-19 in Hunan Province

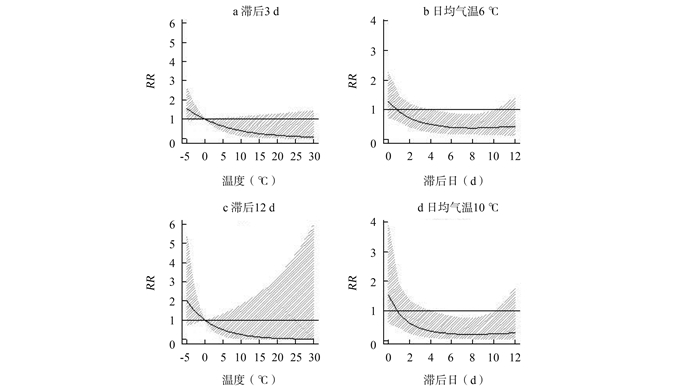
图 3 湖南省不同滞后天数日均气温对COVID-19日发病数的影响
Figure 3. The effect of average daily temperature on the incidence of COVID-19 on different lagging days in Hunan Province

图 4 不同滞后天数下的温度效应和不同温度下的滞后效应对日发病数的影响
Figure 4. The temperature effect under different lagging days and the lag effect under different temperature on the incidence
表 1 湖南省COVID-19日发病数与气象因素、空气质量因素的基本情况(n=1 018)
Table 1. The characteristics of meteorological factors, air quality factor and the incidence of COVID-19 in Hunan Province (n=1 018)
变量 观测天数(d) (min, max) M(P25, P75) 日发病数(例) 42 (0.00, 78.00) 19.50(1.00, 43.0) 日均气温(℃) 42 (3.45, 17.63) 8.52(6.44, 10.67) 日降水量(mm) 42 (0.00, 33.17) 1.50(0.05, 6.45) 日均气压(hPa) 42 (985.73, 1 005.00) 996.72(993.19, 998.73) 日相对湿度(%) 42 (57.48, 93.21) 84.04(74.02, 87.83) 日照时数(h) 42 (0.07, 9.68) 1.86(0.38, 5.23) AQI(μg/m3) 42 (30.30, 101.00) 58.92(43.85, 67.85) PM2.5(μg/m3) 42 (11.62, 75.46) 40.96(26.54, 49.00) SO2(mg/m3) 42 (3.39, 7.92) 4.77(4.15, 5.46) CO(mg/m3) 42 (0.44, 1.29) 0.85(0.79, 0.96) NO2(mg/m3) 42 (6.62, 27.00) 14.65(11.54, 17.69) O3(mg/m3) 42 (33.31, 90.85) 63.00(50.08, 75.15)  下载: 导出CSV
表 2 湖南省COVID-19日发病数与气象因素、空气质量因素的Spearman相关分析结果
Table 2. The Spearman correlation analysis results among the incidence of COVID-19, meteorological factors and air quality index in Hunan Province
变量 日均气温(℃) 日降水量(mm) 日均气压(hPa) 日相对湿度(%) 日照时数(h) AQI (μg/m3) PM2.5 (μg/m3) SO2 (mg/m3) CO (mg/m3) NO2 (mg/m3) O3 (mg/m3) 日降水量(mm) -0.140 日均气压(hPa) -0.651a -0.262 日相对湿度(%) -0.001 0.851a -0.331 日照时数(h) 0.202 -0.730a 0.177 -0.733a AQI(μg/m3) 0.100 -0.387 0.040 -0.326 0.034 PM2.5(μg/m3) 0.097 -0.321a 0.002 -0.230 -0.048 0.981a SO2(mg/m3) 0.577a -0.635a -0.260 -0.600a 0.535a 0.407a 0.357a CO(mg/m3) 0.286a 0.308a -0.532a 0.458a -0.359a 0.343a 0.389a 0.111 NO2(mg/m3) 0.685a -0.374a -0.417a -0.248 0.180 0.457a 0.451a 0.813a 0.395a O3(mg/m3) -0.095 -0.682a 0.376a -0.755a 0.695a 0.406a 0.298 0.348a -0.354a 0.043 日发病数(例) -0.584a 0.193 0.258 0.131 -0.156 0.204 0.244 -0.389 0.118 -0.412 0.051 注:aP<0.05。
下载: 导出CSV
-
[1] Bao J, Wang Z, Yu C, et al. The influence of temperature on mortality and its Lag effect: a study in four Chinese cities with different latitudes[J]. BMC Public Health, 2016, 16: 375. DOI: 10.1186/s12889-016-3031-z. [2] Goldberg MS, Gasparrini A, Armstrong B, et al. The short-term influence of temperature on daily mortality in the temperate climate of Montreal, Canada[J]. Environ Res, 2011, 111(6): 853-860. DOI: 10.1016/j.envres.2011.05.022. [3] Rocklöv J, Forsberg B. The effect of temperature on mortality in Stock-holm 1998-2003: a study of lag structures and heatwave effects[J]. Scand J Public Health, 2008, 36(5): 516-523. DOI: 10.1177/1403494807088458. [4] Huang C, Barnett AG, Wang X, et al. Effects of extreme temperatures on years of life lost for cardiovascular deaths: a time series study in Brisbane, Australia[J]. Circ Cardiovasc Qual Outcomes, 2012, 5(5): 609-614. DOI: 10.1161/CIRCOUTCOMES.112.965707. [5] Mandal CC, Panwar MS. Can the summer temperatures reduce COVID-19 cases?[J]. Elsevier Ltd, 2020, 185: 72-79. DOI: 10.1016/j.puhe.2020.05.065. [6] Gupta S, Raghuwanshi GS, Chanda A. Effect of weather on COVID-19 spread in the US: a prediction model for India in 2020. [J]. Sci Total Environ, 2020, 728: 138860. DOI: 10.1016/j.scitotenv.2020.138860. [7] 赵琦, 李珊珊, 郭玉明. 随时间变化的分布滞后非线性模型应用介绍: 以气温与死亡关系为例[J]. 环境与职业医学, 2020, 37(1): 9-14. DOI: 10.13213/j.cnki.jeom.2020.19485.Zhao Q, Li SS, Guo YM. Time-varying distributed lag non-linear model: using temperature-mortality association as an example[J] J Environ Occup Med, 2020, 37(1): 9-14. DOI: 10.13213/j.cnki.jeom.2020.19485. [8] Peng RD, Bobb JF, Tebaldi C, et al. Toward a quantitative estimate of future heat wave mortality under global climate change. [J]. Environ Health Perspect, 2011, 119(5): 701-706. DOI: 10.1289/ehp.1002430. [9] Gasparrini A, Armstrong B, Kenward MG. Distributed lag non-linear models[J]. Stat Med, 2010, 29(21): 2224-2234. DOI: 10.1002/sim.3940. [10] Gasparrini A. Distributed lag linear and non-linear models in R: the package dlnm[J]. J Stat Softw, 2011, 43(8): 1-20. DOI: 10.18637/jss.v043.i08. [11] 祝寒松, 陈思, 王明斋, 等. 厦门市2013-2017年手足口病发病与气象因素影响分析[J]. 中华流行病学杂志, 2019, 40(5): 531-536. DOI: 10.3760/cma.j.issn.0254-6450.2019.05.008.Zhu HS, Chen S, Wang MZ, et al. Analysis on association between incidence of hand foot and mouth disease and meteorological factors in Xiamen, 2013-2017[J]. Chin J Epidemiol, 2019, 40(5): 531-536. DOI: 10.3760/cma.j.issn.0254-6450.2019.05.008. [12] Xu Z, Hu W, Jiao K, et al. The effect of temperature on childhood hand, foot and mouth disease in Guangdong Province, China, 2010-2013: a multicity study. [J]. BMC Infect Dis, 2019, 19(1): 969. DOI: 10.1186/s12879-019-4594-y. [13] Méndez-Arriaga F. The temperature and regional climate effects on communitarian COVID-19 contagion in Mexico throughout phase 1[J]. Sci Total Environ, 2020, 735: 139560. DOI: 10.1016/j.scitotenv.2020.139560. [14] Zhang ZB, Xue T, Jin XY. Effects of meteorological conditions and air pollution on COVID-19 transmission: evidence from 219 Chinese cities[J]. Sci Total Environ, 2020, 741: 140244. DOI: 10.1016/j.scitotenv.2020.140244. [15] Lin C, Lau AKH, Fung JCH, et al. A mechanism-based parameterisation scheme to investigate the association between transmission rate of COVID-19 and meteorological factors on plains in China[J]. Sci Total Environ, 2020, 737: 140348. DOI: 10.1016/j.scitotenv.2020.140348. [16] Yang Q, Yang Z, Ding H, et al. The relationship between meteorological factors and mumps incidence in Guangzhou, China, 2005-2012: a distributed lag non-linear time-series analysis[J]. Hum Vaccin Immunother, 2014, 10(8): 2421-2432. DOI: 10.4161/hv.29286. [17] 张丹丹, 王旭, 许勤勤, 等. 菏泽市与威海市气温对流行性腮腺炎发病的影响[J]. 山东大学学报(医学版), 2018, 56(8): 88-94, 113. DOI: 10.6040/j.issn.1671-7554.0.2018.307.Zhang DD, Wang X, Xu QQ, et al. Effect of temperature on the incidence of mumps in Heze City and Weihai City[J]. Journal of Shandong University (Health Sciences), 2018, 56(8): 88-94, 113. DOI: 10.6040/j.issn.1671-7554.0.2018.307. [18] Xie JG, Zhu YJ. Association between ambient temperature and COVID-19 infection in 122 cities from China. [J]. Sci Total Environ, 2020, 724: 138201. DOI: 10.1016/j.scitotenv.2020.138201. -

 点击查看大图

计量
- 文章访问数: 553
- HTML全文浏览量: 258
- PDF下载量: 73
- 被引次数: 0