

Spatial risk analysis of global highly pathogenic avian influenza H5N1 virus based on different methods of choosing controls
-
摘要:
目的 基于全球高致病性禽流感H5N1(highly pathogenic avian influenza virus H5N1, HPAIV H5N1)疫情数据,探讨比较四种对照抽样对全球HPAIV H5N1空间风险分析的影响。 方法 疫情数据来源于官方疫情监测报告。构建以国家为单位的完全随机抽样、缓冲区抽样、基于人口密度的概率抽样和最大熵(MaxEnt)抽样四种抽样,按1∶4比例抽样作为对照数据。收集整理距铁路、公路和候鸟迁徙路径的最短距离、土地类型、全球数字高程模型、婴儿死亡率6个因素,采用Logistic空间自回归模型进行建模,基于受试者工作特征曲线下面积(the area under the curve, AUC)、灵敏度、特异度等评价指标,比较不同抽样的影响并预测风险。 结果 四种抽样所得的AUC值在0.896~0.971间,预测能力均好,而MaxEnt抽样预测能力最优。从预测风险来看,随机抽样和缓冲区抽样预测结果存在偏差,概率抽样的预测结果存在低估,MaxEnt抽样空间风险预测结果最优。 结论 随机抽样下的全球HPAIV H5N1疫情空间风险建模结果最差,MaxEnt抽样的建模结果最好,空间风险预测地区更为准确,可作为全球禽流感空间流行病学研究中合理对照选择的参考,同时建议在今后类似的研究中,须重视对照抽样方法的选择。 -
关键词:
- 空间风险建模 /
- 抽样方法 /
- 模型比较 /
- 高致病性禽流感H5N1 /
- 流行病学
Abstract:Objective To explore and compare the impacts of four sampling methods on the spatial risk analysis of global highly pathogenic avian influenza virus H5N1 (HPAIV H5N1) based on the global databases of HPAIV H5N1. Methods H5N1 outbreak data were collected from the official surveillance reports. The control data were obtained through four sampling methods using the ratio of 1∶4 for case to control, completely random sampling based on the country, buffer zone sampling, probability sampling based on population density and probability sampling based on the results of MaxEnt. Six influencing factors were collected, including the shortest distance from the epidemic point to the railway, highway and wild bird migration routes, land use and land cover data, altitude, and infant mortality rate. The Logistic regression model with spatial autocorrelation term was applied to analyze and compare the impacts of four sampling methods on the predicted risk through the area under the curve (AUC), sensitivity, specificity and other evaluation indicators. Results For the four sampling methods, their AUC values were between 0.896-0.971, showing their prediction ability were good, and the MaxEnt-based sampling method had the best predictive ability. From the perspective of predicting risk, the results of random sampling and buffer zone sampling were biased, and the result of probability sampling was underestimated, while the results for MaxEnt sampling was best. Conclusion The results of spatial risk modeling for global HPAIV H5N1 based on random sampling was poorest, but MaxEnt sampling had the best modelling result, whose predicted risk regions were more accurate. Hence it can provide a rational reference to select controls for the spatial epidemiologic researches of global avian influenza. It is suggested to pay attention to the selection of control sampling methods in future similar researches. -
Key words:
- Spatial risk modeling /
- Sampling method /
- Model comparison /
- HPAIV H5N1 /
- Epidemiology
-

图 1 HPAIV H5N1禽流感疫情及四种对照抽样点的全球分布情况图
Figure 1. Global distribution of HPAIV H5N1 and four types of controls

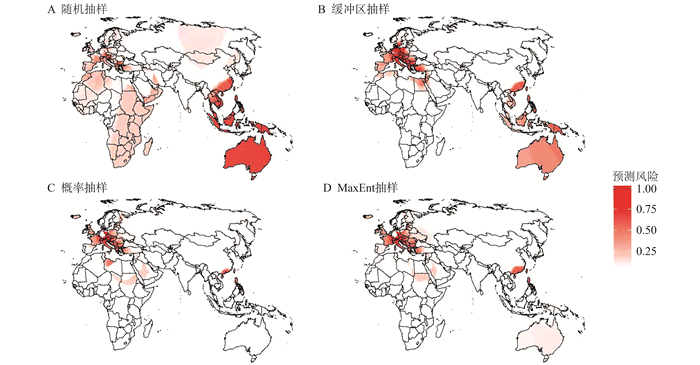
图 2 四种对照抽样的空间风险因素建模的预测风险图
Figure 2. Predicted high-risk areas of global HPAIV H5N1 for four sampling methods
表 1 基于四种抽样的风险因素模型结果
Table 1. Results of risk modelling based on four sampling methods
系数 OR (95% CI)值 随机抽样 缓冲区抽样 概率抽样 MaxEnt抽样 距候鸟迁徙路线最短距离 3.87(3.34~4.39) a 0.39(0.19~0.59) a 0.08(0.03~0.12) a 0.04(-0.001~0.08) 距公路最短距离 -1.08(-1.83~-0.34) a -3.34(-5.69~-0.98) a -0.04(-0.40~0.31) -1.00(-1.39~-0.60) a 距铁路最短距离 -3.79(-4.79~-2.79) a -0.60(-1.04~-0.15) a -0.29(-0.49~-0.09) a -0.63(-0.87~-0.39) a 全球数字高程模型 -1.38(-1.94~-0.82) a -1.58(-4.50~1.34) 0.01(-0.23~0.25) 0.07(-0.11~0.24) 婴儿死亡率 9.41(-0.51~19.32) -0.98(-1.40~-0.56) a -26.51(-33.99~-19.03) a -15.92(-22.01~-9.83) a 土地类型-森林灌木 0.44(-0.22~1.10) -1.34(-2.39~-0.28) a 0.28(-0.52~1.07) -0.69(-1.34~-0.04)a 土地类型-湿地植被 0.09(-0.52~0.70) -0.14(-0.71~0.44) 0.95(0.46~1.44) a 0.09(-0.32~0.50) 土地类型-城镇空地 1.25(0.61~1.88) a -0.97(-1.73~-0.22) a 0.65(0.09~1.22) a 0.54(0.12~0.97) a 土地类型-水体 1.55(0.42~2.67) a 0.64(-0.64~1.91) 1.14(0.10~2.19) a 1.08(0.23~1.94) a 注:aP<0.05。  下载: 导出CSV
表 2 基于四种抽样的风险因素模型评估及AUC值两两比较结果
Table 2. Evaluations of risk modelling based on four sampling methods and the results of pairwise comparison among AUC values
抽样方法 灵敏度 特异度 AUC值 Z值 随机抽样 缓冲区抽样 概率抽样 随机抽样 0.844 0.563 0.895 缓冲区抽样 0.946 0.547 0.969 -4.737 a 概率抽样 0.955 0.505 0.953 -5.357 a -0.853 MaxEnt抽样 0.916 0.575 0.971 -5.862 a -0.639 -0.127 注:aP < 0.001。
下载: 导出CSV
-
[1] Chang SC, Cheng YY, Shih SR. Avian influenza virus: the threat of a pandemic[J]. Biomed J, 2006, 29(2): 130. [2] Gilbert M, Pfeiffer DU. Risk factor modelling of the spatio-temporal patterns of highly pathogenic avian influenza (HPAIV) H5N1: a review[J]. Spat Spatiotemporal Epidemiol, 2012, 3(3): 173-183. DOI: 10.1016/j.sste.2012.01.002. [3] Claes F, Kuznetsov D, Liechti R, et al. The EMPRES-i genetic module: a novel tool linking epidemiological outbreak information and genetic characteristics of influenza viruses[J]. Database(Oxford), 2014, 2014: bau008. DOI: 10.1093/database/bau008. [4] Xu M, Cao CX, Li Q, et al. Ecological niche modeling of risk factors for H7N9 human infection in China[J]. Int J of Environ Res Public Health, 2016, 13(6): 600. DOI: 10.3390/ijerph13060600. [5] Dai S, Feng DL, Xu B. Monitoring potential geographical distribution of four wild bird species in China[J]. Environ Earth Sci, 2016, 75(9): 1-10. DOI: 10.1007/s12665-016-5289-y. [6] Moriguchi S, Onuma M, Goka K. Spatial assessment of the potential risk of avian influenza A virus infection in three raptor species in Japan[J]. J Vet Med Sci, 2016, 78(7): 1107-1115. DOI: 10.1292/jvms.15-0551. [7] Senay SD, Worner SP, Ikeda T. Novel three-step pseudo-absence selection technique for improved species distribution modelling[J]. PLoS One, 2013, 8(8): e71218. DOI: 10.1371/journal.pone.0071218. [8] 孙利谦, 夏聪聪, 李锐, 等. 基于空间点模式分析全球高致病性禽流感H5N1的空间分布特征[J]. 中华疾病控制杂志, 2016, 20(6): 555-558. DOI: 10.16462/j.cnki.zhjbkz.2016.06.005.Sun LQ, Xia CC, Li R, et al. Spatial distribution characteristics of global highly pathogenic avian influenza H5N1 based on the spatial point pattern analysis[J]. Chin J Dis Control Prev, 2016, 20(6): 555-558. DOI: 10.16462/j.cnki.zhjbkz.2016.06.005. [9] Sun L, Ward MP, Li R, et al. Global spatial risk pattern of highly pathogenic avian influenza H5N1 virus in wild birds : a knowledge-fusion based approach[J]. Prev Vet Med, 2018, 152: 32-39. DOI: 10.1016/j.prevetmed.2018.02.008. [10] Barbet-Massin M, Jiguet F, Albert CH, et al. Selecting pseudo-absences for species distribution models: How, where and how many?[J]. Methods Ecol Evol, 2012, 3(2): 327-338. doi: 10.1111/j.2041-210X.2011.00172.x [11] Hertzog LR, Besnard A, Jay-Robert P, et al. Field validation shows bias-corrected pseudo-absence selection is the best method for predictive species-distribution modelling[J]. Divers Distrib, 2015, 20(12): 1403-1413. DOI: 10.1111/ddi.12249. [12] Dhingra MS, Artois J, Robinson TP, et al. Global mapping of highly pathogenic avian influenza H5N1 and H5Nx clade 2.3.4.4 viruses with spatial cross-validation[J]. Elife, 2016, 5: e19571. DOI: 10.7554/eLife.19571. [13] Elith J, Graham CH, P. Anderson RP, et al. Novel methods improve prediction of species'distributions from occurrence data[J]. Ecography, 2010, 29(2): 129-151. DOI: 10.1111/j.2006.0906-7590.04596.x. [14] Hulse-Post DJ, Sturm-Ramirez KM, Humberd J, et al. Role of domestic ducks in the propagation and biological evolution of highly pathogenic H5N1 influenza viruses in Asia[J]. PNAS, 2005, 102(30): 10682-10687. DOI: 10.1073/pnas.0504662102. [15] Martin V, Pfeiffer DU, Zhou X, et al. Spatial distribution and risk factors of highly pathogenic avian influenza (HPAI) H5N1 in China[J]. PLoS Pathog, 2011, 7(3): e1001308. DOI: 10.1371/journal.ppat.1001308. [16] NASA Socioeconomic Data and Applications Center (SEDAC). Global One-Eighth Degree Population Base Year and Projection Grids Based on the Shared Socioeconomic Pathways, Revision 01[EB/OL]. (2020-12-05)[2020-02-01]. https://sedac.ciesin.columbia.edu/data/set/popdynamics-1-8th-pop-base-year-projection-ssp-2000-2100-rev01/maps. [17] Tian L, Liang F, Xu M, et al. Spatio-temporal analysis of the relationship between meteorological factors and hand-foot-mouth disease in Beijing, China[J]. BMC Infect Dis, 2018, 18(1): 158. DOI: 10.1186/s12879-018-3071-3. [18] DeLong ER, DeLong DM, Clarke-Pearson DL. Comparing the areas under two or more correlated receiver operating characteristic curves: a nonparametric approach[J]. Biometrics, 1988, 44(3): 837-845. DOI: 10.2307/2531595. [19] Mischler P, Kearney M, McCarroll JC, et al. Environmental and socio-economic risk modelling for Chagas disease in Bolivia[J]. Geospat Health, 2012, 6(3): S59-S66. DOI: 10.4081/gh.2012.123. [20] Hengl T, Sierdsema H, Radović A, et al. Spatial prediction of species'distributions from occurrence-only records: combining point pattern analysis, ENFA and regression-kriging[J]. Ecol Model, 2009, 220(24): 3499-3511. DOI: 10.1016/j.ecolmodel.2009.06.038. -

 点击查看大图

计量
- 文章访问数: 351
- HTML全文浏览量: 162
- PDF下载量: 42
- 被引次数: 0