

Impact of Japanese encephalitis vaccination in Shijiazhuang on the incidence of Japanese encephalitis: an interrupted time series analysis
-
摘要:
目的 评估疫苗接种对流行性乙型脑炎(简称乙脑)发病趋势的影响。 方法 采用中断时间序列设计定量评估1949-2019年石家庄市乙脑年发病率变化趋势。 结果 1949-1968年,石家庄市乙脑发病率呈上升趋势(β1=0.19, t=-2.01, P=0.048)。1969-2019年适龄人群疫苗接种,乙脑发病率当年下降(β2=-7.83, t=-2.97, P=0.004);长期下降斜率均值(β1+β3)为-0.04/10万(t=-3.24, P=0.002);疫情暴发流行致人群发病率上升(β4=3.87, t=2.36, P=0.007)。其中免疫规划前阶段(1969-2007年),接种当年发病率下降(β2=-7.22, t=-2.98, P=0.019);持续长期下降斜率为0.29(t=-2.73, P=0.008);疫情暴发流行对人群发病率的影响无统计学意义(β4=4.65, t=0.72, P=0.476)。免疫规划期(2008-2019年)与免疫规划前期相比,当年发病率下降程度无统计学意义(β2=-2.89, t=-1.56, P=0.169);免疫规划期,发病率趋势无统计学意义(β3=-0.03, t=-1.16, P=0.252);暴发流行升高了人群发病率(β4=3.62, t=4.21, P=0.001)。 结论 疫苗接种致石家庄市乙脑疫情明显下降,防控效果显著。但受发病人群年龄后移影响,免疫策略也需调整。 Abstract:Objective To analyze the impact of Japanese encephalitis(JE) vaccine administration on the trend of JE incidence. Methods Interrupted time series analysis (ITSA) and segmented regression analysis (SRA) using JE incidence data in Shi Jiazhuang from 1949 to 2019 were conducted to quantitatively assess short-term and long-term effect of JE vaccination. Results There was a statistical significant increasing trend of JE incidence from 1949 to 1968 (β1=0.19, t =-2.01, P =0.048). With the introduction of vaccine from 1969 to 2019, JE incidence decreased immediately (β2=-7.83, t =-2.97, P =0.004) in 1969; And the average decreasing slope of JE incidence (β1+β3) was -0.04/lakh with the significant difference (β3=-0.23, t =-3.24, P =0.002). However, JE incidence increased due to the outbreak in 1969-2019 (β4=3.87, t =2.36, P =0.007). Further analysis using data on the period of pre-immunization program(1969-2007) showed that the JE incidence decreased (β2=-7.22, t =-2.98, P =0.01) in 1969 and the continuous decreasing slope was 0.29 (β3=-0.29, t =-2.73, P =0.008); And JE incidence did not increase due to the outbreak (β4=4.65, t =0.72, P =0.476) in this period. However, compared with the period of pre-immunization program, in the period of immunization program, no statistically significant decreasing of JE incidence was found in 2008 (β2=-2.89, t=-1.56, P=0.169) and in this period (β3=-0.03, t=-1.16, P=0.252); Meanwhile, JE incidence still increased due to the outbreak in this period (β4=3.62, t=4.21, P=0.001). Conclusions The implementation of vaccine administration in Shi Jiazhuang has made remarkable effectiveness in the JE control. However, the immunization strategies need to be adjusted according to the change of the vulnerable population of cases moving from younger children to the older adult. -

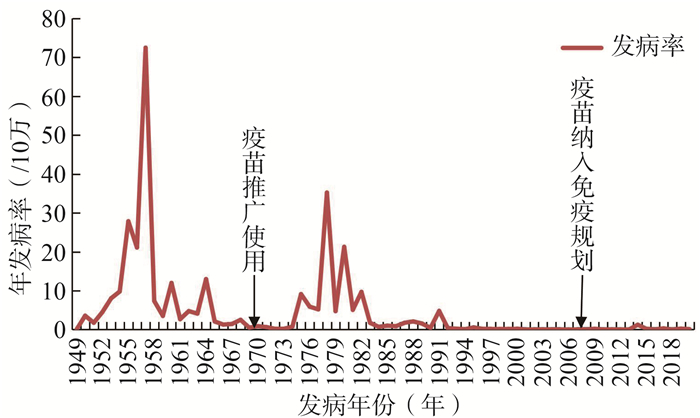
图 1 1949-2019年石家庄市流行性乙型脑炎年发病率
Figure 1. The incidence of Japanese encephalitis of Shijiazhuang from 1949 to 2019

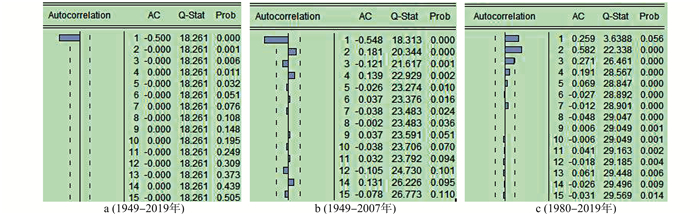
图 2 不同阶段年发病率数据序列自相关分析
Figure 2. Auto-correlation analysis on the annual incidence of Japanese encephalitis in the different immunization period
表 1a 1949-2019年石家庄市乙脑疫苗干预整体效果评估模型赋值
Table 1a. The assignments for the assessment model on the effect of the Japanese encephalitis vaccination in Shi jiazhuang from 1949 to 2019
年份(年) 序号(time) 发病率(Y, /10万) 接种(intervention) 效果(postslope) 高峰(cold) 1949 1 3.57 0 0 0 1950 2 1.75 0 0 0 1951 3 4.51 0 0 0 1952 4 8.04 0 0 0 1953 5 9.80 0 0 0 1954 6 27.84 0 0 0 1955 7 21.09 0 0 0 1956 8 72.43 0 0 1 1957 9 7.36 0 0 0 1958 10 3.52 0 0 0 1959 11 11.99 0 0 0 1960 12 2.68 0 0 0 1961 13 4.75 0 0 0 1962 14 4.11 0 0 0 1963 15 12.99 0 0 0 1964 16 2.09 0 0 0 1965 17 1.29 0 0 0 1966 18 1.45 0 0 0 1967 19 2.51 0 0 0 1968 20 0.50 0 0 0 1969 21 0.88 1 1 0 1970 22 0.64 1 2 0 1971 23 0.21 1 3 0 1972 24 0.20 1 4 0 1973 25 0.74 1 5 0 1974 26 9.12 1 6 0 1975 27 5.90 1 7 0 1976 28 5.20 1 8 0 1977 29 35.21 1 9 1 1978 30 4.75 1 10 0 1979 31 21.26 1 11 0 1980 32 5.08 1 12 0 1981 33 9.70 1 13 0 1982 34 1.74 1 14 0 1983 35 0.71 1 15 0 1984 36 1.01 1 16 0 1985 37 0.87 1 17 0 1986 38 1.76 1 18 0 1987 39 2.10 1 19 0 1988 40 1.57 1 20 0 1989 41 0.44 1 21 0 1990 42 4.80 1 22 1 1991 43 0.39 1 23 0 1992 44 0.23 1 24 0 1993 45 0.10 1 25 0 1994 46 0.57 1 26 0 1995 47 0.19 1 27 0 1996 48 0.14 1 28 0 1997 49 0.15 1 29 0 1998 50 0.17 1 30 0 1999 51 0.24 1 31 0 2000 52 0.05 1 32 0 2001 53 0.08 1 33 0 2002 54 0.07 1 34 0 2003 55 0.09 1 35 0 2004 56 0.04 1 36 0 2005 57 0.03 1 37 0 2006 58 0.09 1 38 0 2007 59 0.07 1 39 0 2008 60 0.20 1 40 0 2009 61 0.06 1 41 0 2010 62 0.06 1 42 0 2011 63 0.04 1 43 0 2012 64 0.04 1 44 0 2013 65 1.24 1 45 1 2014 66 0.21 1 46 0 2015 67 0.07 1 47 0 2016 68 0.31 1 48 0 2017 69 0.04 1 49 0 2018 70 0.25 1 50 0 2019 71 0.11 1 51 0  下载: 导出CSV
表 1b 1949-2007年石家庄市免疫规划前阶段乙脑疫苗干预效果评估模型赋值
Table 1b. The assignments for the assessment model on the effect of the Japanese encephalitis vaccination in the period of pre-immunization program from 1949 to 2007
年份(年) 序号(time) 发病率(Y, /10万) 接种(intervention) 效果(postslope) 高峰(cold) 1949 1 3.57 0 0 0 1950 2 1.75 0 0 0 1951 3 4.51 0 0 0 1952 4 8.04 0 0 0 1953 5 9.80 0 0 0 1954 6 27.84 0 0 0 1955 7 21.09 0 0 0 1956 8 72.43 0 0 1 1957 9 7.36 0 0 0 1958 10 3.52 0 0 0 1959 11 11.99 0 0 0 1960 12 2.68 0 0 0 1961 13 4.75 0 0 0 1962 14 4.11 0 0 0 1963 15 12.99 0 0 0 1964 16 2.09 0 0 0 1965 17 1.29 0 0 0 1966 18 1.45 0 0 0 1967 19 2.51 0 0 0 1968 20 0.50 0 0 0 1969 21 0.88 1 1 0 1970 22 0.64 1 2 0 1971 23 0.21 1 3 0 1972 24 0.20 1 4 0 1973 25 0.74 1 5 0 1974 26 9.12 1 6 0 1975 27 5.90 1 7 0 1976 28 5.20 1 8 0 1977 29 35.21 1 9 1 1978 30 4.75 1 10 0 1979 31 21.26 1 11 0 1980 32 5.08 1 12 0 1981 33 9.70 1 13 0 1982 34 1.74 1 14 0 1983 35 0.71 1 15 0 1984 36 1.01 1 16 0 1985 37 0.87 1 17 0 1986 38 1.76 1 18 0 1987 39 2.10 1 19 0 1988 40 1.57 1 20 0 1989 41 0.44 1 21 0 1990 42 4.80 1 22 1 1991 43 0.39 1 23 0 1992 44 0.23 1 24 0 1993 45 0.10 1 25 0 1994 46 0.57 1 26 0 1995 47 0.19 1 27 0 1996 48 0.14 1 28 0 1997 49 0.15 1 29 0 1998 50 0.17 1 30 0 1999 51 0.24 1 31 0 2000 52 0.05 1 32 0 2001 53 0.08 1 33 0 2002 54 0.07 1 34 0 2003 55 0.09 1 35 0 2004 56 0.04 1 36 0 2005 57 0.03 1 37 0 2006 58 0.09 1 38 0 2007 59 0.07 1 39 0
下载: 导出CSV
表 1c 1969-2019年石家庄市免疫规划阶段较免疫规划阶段乙脑疫苗干预效果评估模型赋值
Table 1c. The assignments for the assessment model on the effect of the Japanese encephalitis vaccination between the period of pre-immunization program and the period of immunization program from 1969 to 2019
年份(年) 序号(time) 发病率(Y, /10万) 接种(intervention) 效果(postslope) 高峰(cold) 1969 1 0.88 0 0 0 1970 2 0.64 0 0 0 1971 3 0.21 0 0 0 1972 4 0.20 0 0 0 1973 5 0.74 0 0 0 1974 6 9.12 0 0 0 1975 7 5.90 0 0 0 1976 8 5.20 0 0 0 1977 9 35.21 0 0 1 1978 10 4.75 0 0 0 1979 11 21.26 0 0 0 1980 12 5.08 0 0 0 1981 13 9.70 0 0 0 1982 14 1.74 0 0 0 1983 15 0.71 0 0 0 1984 16 1.01 0 0 0 1985 17 0.87 0 0 0 1986 18 1.76 0 0 0 1987 19 2.10 0 0 0 1988 20 1.57 0 0 0 1989 21 0.44 0 0 0 1990 22 4.80 0 0 1 1991 23 0.39 0 0 0 1992 24 0.23 0 0 0 1993 25 0.10 0 0 0 1994 26 0.57 0 0 0 1995 27 0.19 0 0 0 1996 28 0.14 0 0 0 1997 29 0.15 0 0 0 1998 30 0.17 0 0 0 1999 31 0.24 0 0 0 2000 32 0.05 0 0 0 2001 33 0.08 0 0 0 2002 34 0.07 0 0 0 2003 35 0.09 0 0 0 2004 36 0.04 0 0 0 2005 37 0.03 0 0 0 2006 38 0.09 0 0 0 2007 39 0.07 0 0 0 2008 40 0.20 1 1 0 2009 41 0.06 1 2 0 2010 42 0.06 1 3 0 2011 43 0.04 1 4 0 2012 44 0.04 1 5 0 2013 45 1.24 1 6 1 2014 46 0.21 1 7 0 2015 47 0.07 1 8 0 2016 48 0.31 1 9 0 2017 49 0.04 1 10 0 2018 50 0.25 1 11 0 2019 51 0.11 1 12 0
下载: 导出CSV
表 2 石家庄市不同防控阶段的乙脑防控分段回归分析
Table 2. Semented regression analysis on the incidence of Japanese encephalitis in the different immunization period of Shijiazhuang
免疫效果 变量 系数 估计值 t值 Se P值 1949-2019年整体免疫效果 β0 17.01 3.77 4.51 <0.001 time β1 0.19 -2.01 0.09 0.048 intervention β2 -7.83 -2.97 2.64 0.004 postslope β3 -0.23 -3.24 0.07 0.002 cold β4 3.87 2.36 5.13 0.007 1949-2007年免疫规划前阶段免疫效果 β0 17.01 3.45 0.72 0.001 time β1 0.25 0.08 3.12 0.003 intervention β2 -7.22 2.98 -2.42 0.019 postslope β3 -0.29 -2.73 0.11 0.008 cold β4 4.65 0.72 3.48 0.476 1969-2019年免疫规划阶段较免疫规划前阶段的免疫效果 β0 1.56 4.85 0.15 <0.001 time β1 -0.21 -2.61 0.08 0.012 intervention β2 -2.89 -1.56 3.06 0.169 postslope β3 -0.03 -1.16 0.39 0.252 cold β4 3.62 4.21 3.23 0.001
下载: 导出CSV
-
[1] 李阳. 山东省滨州市2013年流行性乙型脑炎疫情分析[J]. 医学动物防制, 2017, 33(7): 747-749. DOI: 10.7629/yxdwfz201707012.Li Y. Analysis of epidemic situation of epidemic type B encephalitis in Shandong Binzhou City in 2013[J]. J Med Pest Control, 2017, 33(7): 747-749. DOI: 10.7629/yxdwfz201707012. [2] 芮莉萍, 刘铭, 徐飞, 等. 贵州省2011年流行性乙型脑炎临床转归调查[J]. 疾病监测与控制, 2013, 80(11): 649-651. https://www.cnki.com.cn/Article/CJFDTOTAL-JBJK201311001.htmRui LP, Liu M, Xu F, et al. Analysis on the clinical consequence of Japanese encephalitis in Guizhou Province[J]. J Diseasea Monitor & Control, 2013, 80(11): 649-651. https://www.cnki.com.cn/Article/CJFDTOTAL-JBJK201311001.htm [3] 刘立, 王环宇, 张世勇, 等. 2013年石家庄市流行性乙型脑炎暴发疫情的流行病学分析[J]. 中国全科医学, 2016, 19(29): 3580-3583. DOI: 10.3969/j.issn.1007-9572.2016.29.015.Liu L, Wang HY, Zhang SY, et al. Epidemiological analysis of Japanese Encephalitis outbreak in Shijiazhuang city in 2013[J]. Chin Gen Pract, 2016, 19(29): 3580-3583. DOI: 10.3969/j.issn.1007-9572.2016.29.015. [4] 宋仙保, 郭建花, 张世勇. 1949-2018年石家庄市流行性乙型脑炎发病趋势分析[J]. 中国人兽共患病学报, 2019, 35(11): 1047-1050. DOI: 10.3969/j.issn.1002-2694.2019.00.167.Song XB, Guo JH, Zhang SY. Epidemic trend of Japanese encephalitis in Shi Jiazhuang City, China, 1949-2018[J]. Chin J Zoohoses, 2019, 35(11): 1047-1050. DOI: 10.3969/j.issn.1002-2694.2019.00.167. [5] 刘丽珺, 刘宇, 周兴余, 等. 四川省2008-2018年流行性乙型脑炎流行特征及ARIMA模型应用[J]. 中华疾病控制杂志, 2019, 23(8): 916-921. DOI: 10.16462/j.cnki.zhjbkz.2019.08.007.Liu LJ, Liu Y, Zhou XY, et al. Analysis of epidemiological characteristics of Japanese encephalitis in Sichuan Province from 2008 to 2018 and application of autoregressive integrated moving average model[J]. Chin J Dis Control Prev, 2019, 23(8): 916-921. DOI: 10.16462/j.cnki.zhjbkz.2019.08.007. [6] Gao XY, Li XL, Li M, et al. Vaccine strategies for the control and prevention of Japanese encephalitis in mailand China, 1951-2011[J]. PLoS Negl Trop Dis, 2014, 8(8): e3015. DOI: 10.1371/journal.pntd.0003015. [7] Yun SI, Lee YM. Japanese encephalitis: the virus and vaccines[J]. Hum Vaccin Immunother, 2014, 10(2): 263-279. DOI: 10.4161/hv.26902. [8] Yu W, Lee LA, Liu Y, et al. Vaccine-preventable disease control in the People's Republic of China: 1949-2016[J]. Vaccine, 2018, 36(52): 8131-8137. DOI: 10.1016/j.vaccine.2018.10.005. [9] Wagner AK, SCD SB, Zhang F, et al. Segmented regression analysis of interrupted time series studies in medication use research[J]. J Clin Pharm Ther, 2002, 27(4): 299-309. DOI: 10.1046/j.1365-2710.2002.00430.x. [10] 邵华, 王琦琦, 胡跃华, 等. 中断时间序列分析及其在公共卫生领域中的应用[J]. 中华流行病学杂志, 2015, 36(9): 1015-1017. DOI: 10.3760/cma.j.issn.0254-6450.2015.09.023.Shao Hua, Wang QQ, Hu YH, et al. Interrupted time-series analysis and its application in public health[J]. Chin J Epidemiol, 2015, 36(9): 1015-1017. DOI: 10.3760/cma.j.issn.0254-6450.2015.09.023. [11] Yu SC, Hao YT, Zhang J, et al. Using interrupted time series design to analyze changes of hand, food, and mouth disease incidence during the declining incidence periods of 2008-2010 in China[J]. Biomed Environ Sci, 2012, 25(6): 645-652. DOI: 10.3967/0895-3988.2012.06.006. [12] 杨才君, 蔡文芳, 沈倩, 等. 基本药物制度对新型农村合作医疗参合农民医疗服务利用率的影响分析[J]. 中国药事, 2016, 30(12): 1171-1174. DOI: 10.16153/j.1002-7777.2016.12.001.Yang CJ, Cai WF, Shen Q, et al. Impact of the implementation of essential medicines system on the hospitalization rate of the new cooperation medical system participants[J]. Chin Pharm Affairs, 2016, 30(12): 1171-1174. DOI: 10.16153/j.1002-7777.2016.12.001. [13] 常宝松, 郭娜, 陈丽, 等. 补偿机制改革对县医院医疗服务利用情况的影响分析[J]. 中国社会医学杂志, 2019, 36(3): 299-301. DOI: 10.3969/j.issn.1673-5625.2019.03.022.Chang BS, Guo N, Chen L, et al. Analisis of the impact of compensation mechanism reform on medical service utilization of county-level public hospital[J]. Chinese Journal of Social Medicine, 2019, 36(3): 299-301. DOI: 10.3969/j.issn.1673-5625.2019.03.022. [14] 郭建花, 李静, 张欣. 2007-2017年石家庄市18岁以下人群急性脑炎脑膜炎流行趋势[J]. 中华流行病学杂志, 2019, 40(4): 47-51. DOI: 10.3760/cma.j.issn.0254-6450.2019.04.009.Guo JH, Li J, ZhangX, et al. Trends on the acute meningitis and encephalitis of population under 18 years in Shijiazhuang 2007-2017[J]. Chin J Epidemiol, 2019, 40(4): 47-51. DOI: 10.3760/cma.j.issn.0254-6450.2019.04.009. -

 点击查看大图
计量
- 文章访问数: 432
- HTML全文浏览量: 170
- PDF下载量: 58
- 被引次数: 0