

Application of moving epidemic method (MEM) in the formulation of influenza epidemic threshold in Qinghai Province
-
摘要:
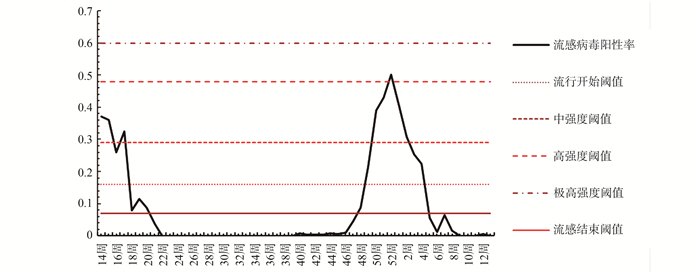
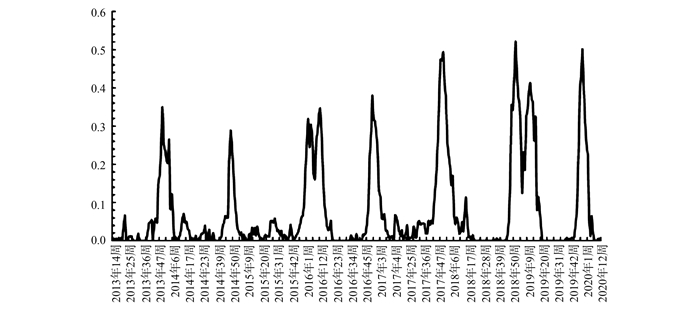
目的 利用移动流行区间法(moving epidemic method, MEM)建立流行性感冒(简称流感)预警系统,为青海省流感防控工作提供科学依据。 方法 利用《中国流感监测信息系统》获得青海省2013―2020年流感监测数据,取其中的流感病毒阳性率数据,按周进行整理,再利用MEM估计流感流行阈值和分级强度阈值,同时可用交叉验证法对MEM的预警效果进行验证。 结果 通过MEM获得相应的流感流行阈值和分级强度阈值,流行开始阈值、流行结束阈值、中强度阈值、高强度阈值和极高强度阈值分别为16%、7%、29%、48%、60%。本次研究的灵敏度为93%、特异度为96%,模型拟合效果较好。 结论 本次研究建立的MEM模型在青海省具有较高的灵敏度和特异度,可以利用此模型在青海省建立流感预警系统,指导流感预防工作。 Abstract:Objective Using moving epidemic method (MEM) to establish an influenza early warning system, so as to provide scientific basis for influenza prevention and control in Qinghai Province. Methods The influenza surveillance data of Qinghai Province from 2013-2020 were obtained in "China Influenza Surveillance Information System", and the positive rate data of influenza virus was collected and sorted weekly. Then the threshold of influenza epidemic and classification intensity were estimated by MEM, and the early warning effect of MEM was verified by cross-validation method. Results The corresponding influenza epidemic threshold and grading intensity threshold were obtained through MEM. The epidemic start threshold, epidemic end threshold, medium intensity threshold, high-intensity threshold, and extremely high-intensity threshold were 16%, 7%, 29%, 48%and 60%, respectively. The sensitivity and the specificity of this study were 93% and 96%, and the model fitting effect was good. Conclusion The MEM model established in this study has high sensitivity and specificity in Qinghai Province, which can be used to establish an influenza early warning system in Qinghai Province to guide influenza prevention. -
Key words:
- Influenza /
- Moving epidemic method /
- Epidemic trend /
- Warning
-

图 3 青海省2019-2020年流感季流行强度分析
Figure 3. Analysis of the epidemic intensity of the 2019-2020 influenza season in Qinghai Province
表 1 PR数据不同δ取值下模型的效果评价
Table 1. The effect evaluation of the model under different δ values of PR data
δ值 灵敏度 特异度 阳性预测值 阴性预测值 阳性似然比 阴性似然比 马修斯相关系数 约登指数 2.00 0.94 0.95 0.83 0.98 18.42 0.07 0.85 0.89 2.10 0.94 0.95 0.83 0.98 18.42 0.07 0.85 0.89 2.20 0.94 0.95 0.83 0.98 18.42 0.07 0.85 0.89 2.30 0.94 0.95 0.83 0.98 18.42 0.07 0.85 0.89 2.40 0.93 0.95 0.84 0.98 19.44 0.07 0.85 0.88 2.50 0.93 0.95 0.84 0.98 19.44 0.07 0.85 0.88 2.60 0.93 0.95 0.84 0.98 19.44 0.07 0.85 0.88 2.70 0.93 0.96 0.86 0.98 23.38 0.07 0.87 0.89 2.80 0.90 0.97 0.88 0.97 27.43 0.11 0.86 0.86 2.90 0.90 0.97 0.88 0.97 27.43 0.11 0.86 0.86 3.00 0.87 0.97 0.88 0.97 28.00 0.13 0.84 0.84 3.10 0.87 0.97 0.88 0.97 28.00 0.13 0.84 0.84 3.20 0.86 0.97 0.89 0.96 31.60 0.15 0.84 0.83 3.30 0.83 0.98 0.91 0.96 38.27 0.17 0.84 0.81 3.40 0.81 0.98 0.91 0.95 38.75 0.20 0.82 0.78 3.50 0.81 0.98 0.91 0.95 38.75 0.20 0.82 0.78 3.60 0.60 0.98 0.91 0.90 38.78 0.41 0.69 0.58 3.70 0.58 0.98 0.91 0.90 37.79 0.42 0.68 0.57 3.80 0.58 0.98 0.91 0.90 37.79 0.42 0.68 0.57 3.90 0.58 0.98 0.91 0.90 37.79 0.42 0.68 0.57 4.00 0.58 0.98 0.91 0.90 37.79 0.42 0.68 0.57  下载: 导出CSV
表 2 PR数据各年份历史数据所建模型的效果评价
Table 2. The effect evaluation of the model built on the historical data of each year of PR data
年份(年) 灵敏度 特异度 阳性预测值 阴性预测值 阳性似然比 阴性似然比 马修斯相关系数 约登指数 2013-2014 0.91 0.98 0.94 0.98 55.62 0.09 0.91 0.90 2014-2015 0.68 1.00 1.00 0.94 - 0.32 0.80 0.68 2015-2016 0.95 1.00 1.00 0.90 - 0.05 0.97 0.95 2016-2017 0.98 0.91 0.69 1.00 10.76 0.02 0.78 0.89 2017-2018 1.00 0.96 0.88 1.00 23.80 0.00 0.92 0.96 2018-2019 0.94 1.00 1.00 0.97 - 0.06 0.96 0.94
下载: 导出CSV
-
[1] Sato APS, Antunes JLF, Lima-Costa MFF, et al. Influenza vaccine uptake among older adults in Brazil: socioeconomic equality and the role of preventive policies and public services [J]. J Infect Public Health, 2020, 13(2): 211-215. DOI: 10.1016/j.jiph.2019.07.022 [2] 卢汉体. 浙江省流感预警技术研究[D]. 杭州: 浙江大学, 2015.Lu HT. Research on influenza early warning technology in Zhejiang Province [D]. Hangzhou: Zhejiang University, 2015. [3] 章涛, 官海滨, 李傅冬, 等. 应用Elman神经网络建立流感样病例预测模型[J]. 预防医学, 2019, 31(2): 113-118. DOI: 10.19485/j.cnki.issn2096-5087.2019.02.002.Zhang T, Guan HB, Li FD, et al. Using elman neural network to build a prediction model of influenza-like cases [J]. Preventive Medicine, 2019, 31(2): 113-118. DOI: 10.19485/j.cnki.issn2096-5087.2019.02.002. [4] Hall LM, Hill DW, Menikarachchi LC, et al. Optimizing artificial neural network models for metabolomics and systems biology: an example using HPLC retention index data [J]. Bioanalysis, 2015, 7(8): 939-955. DOI: 10.4155/bio.15.1. [5] 安晓红. 灰色系统GM(1, 1)模型在预测徐州市甲乙类呼吸道传染病发病趋势中的应用[J]. 江苏预防医学, 2019, 30(1): 33-35. DOI: 10.13668/j.issn.1006-9070.2019.01.011.An XH. Application of grey systemtic GM(1, 1) model in predicting the incidence trend of class A and B respiratory infectious diseases in Xuzhou City [J]. Jiangsu J Prev Med, 2019, 30(1): 33-35. DOI: 10.13668/j.issn.1006-9070.2019.01.011. [6] Su K, Xu L, Li G, et al. Forecasting influenza activity using self-adaptive AI model andmulti-source data in Chongqing, China [J]. EBioMedicine, 2019, 47(5): 284-292. DOI: 10.1016/j.ebiom.2019.08.024. [7] Vega T, Lozano JE, Meerhoff T, et al. Influenza surveillance in Europe: establishing epidemic thresholds by the moving epidemic method [J]. Influenza Other Respir Viruses, 2013, 7(4): 546-558. DOI: 10.1111/j.1750-2659.2012.00422.x. [8] Vega T, Lozano JE, Meerhoff T, et al. Influenza surveillance in Europe: comparing intensity levels calculated using the moving epidemic method [J]. Influenza Other Respir Viruses, 2015, 9(5): 234-246. DOI: 10.1111/irv.12330. [9] 谭亚运, 曾令佳, 秦颖, 等. 移动流行区间法在中国7个气候区流感流行阈值制定中的应用效果评价[J]. 中华预防医学杂志, 2019, 53(10): 1007-1011. DOI: 10.3760/cma.j.issn.0253-9624.2019.10.010.Tan YY, Zeng LJ, Qin Y, et al. Evaluation of the application effect of moving epidemic method in the formulation of influenza epidemic thresholds in 7 climate zones in China [J]. Chin J Prevent Med, 2019, 53(10): 1007-1011. DOI: 10.3760/cma.j.issn.0253-9624.2019.10.010. [10] Hall LM, French JP. A modified CUSUM test to control postoutbreak false alarms [J]. Stat Med, 2019, 38(11): 2047-2058. DOI: 10.1002/sim.8088. [11] 黄智峰, 刘晓剑, 吴永胜, 等. Serfling回归模型在深圳市流感超额死亡估计中的应用[J]. 中华疾病控制杂志, 2017, 21(11): 1170-1174. DOI: 10.16462/j.cnki.zhjbkz.2017.11.022.Huang ZF, Liu XJ, Wu YS, et al. Application of serlfing regression model in estimation of influenza-associated excess mortality in Shenzhen City [J]. Chin J Dis Control Prev, 2017, 21(11): 1170-1174. DOI: 10.16462/j.cnki.zhjbkz.2017.11.022. [12] 王晨, 郭倩, 周罗晶, 等. 基于R语言的ARIMA模型对流感样病例发病趋势的预测[J]. 中华疾病控制杂志, 2018, 22(9): 957-960. DOI: 10.16462/j.cnki.zhjbkz.2018.09.020.Wang C, Guo Q, Zhou LJ, et al. Prediction of the incidence trend of influenza-like cases based on the R language programming ARIMA model [J]. Chin J Dis Control Prev, 2018, 22(9): 957-960. DOI: 10.16462/j.cnki.zhjbkz.2018.09.020. [13] 丁克琴, 谷少华, 劳旭影, 等. 基于移动流行区间法的浙江省宁波市冬春季流行性感冒流行强度研究[J]. 疾病监测, 2020, 35(2): 126-131. DOI: 10.3784/j.issn.1003-9961.2020.02.010.Ding KQ, Gu SH, Lao XY, et al. Study on influenza intensity in winter and spring in Ningbo City, Zhejiang Province based on the moving epidemic method [J]. Dis Surveillance, 2020, 35(2): 126-131. DOI: 10.3784/j.issn.1003-9961.2020.02.010. [14] 程勋杰, 陈涛, 舒跃龙, 等. 移动流行区间法在我国北方15省份流感流行阈值制定中的应用效果评价[J]. 中国卫生统计, 2016, 33(6): 979-982. https://www.cnki.com.cn/Article/CJFDTOTAL-ZGWT201606017.htmCheng XJ, Chen T, Shu YL, et al. Evaluation of the application effect of moving epidemic method in the formulation of influenza epidemic threshold in 15 provinces in northern of China [J]. Chin J Health Statistics, 2016, 33(6): 979-982. https://www.cnki.com.cn/Article/CJFDTOTAL-ZGWT201606017.htm -


 点击查看大图
图(3) / 表(2)
计量
- 文章访问数: 511
- HTML全文浏览量: 217
- PDF下载量: 59
- 被引次数: 0