

Study on morbidity and mortality burden of gastric cancer attributed to excessive sodium intake in Chinese adult residents
-
摘要:
目的 分析我国各省成年居民胃癌归因于钠摄入过量的发病和死亡负担。 方法 根据2012年中国居民营养与健康状况监测获得的膳食钠消费量数据,结合协同克里金空间插值的方法估算各省成年居民的膳食钠暴露水平。2015年胃癌发病和死亡数据来自《肿瘤登记年报》,按照比例风险评估理论,分省计算胃癌发病和死亡归因于钠摄入过量的归因分值。 结果 2015年成年居民高钠饮食对胃癌发病和死亡的人口归因比例分别为29.94%和28.95%,归因于高钠饮食的胃癌发病数和死亡数分别为80 718人和56 578人,发病率和死亡率分别为8.04/10万和5.64/10万。甘肃省归因于高钠饮食的胃癌发病率和死亡率最高,分别为24.85/10万和14.51/10万。归因于高钠饮食发病率最低的省份是广东省(2.51/10万),西藏自治区居民归因于高钠饮食的胃癌死亡率最低(0.29/10万)。 结论 2015年我国成年居民胃癌归因于高钠饮食的发病和死亡负担处于较高的水平,各省间差异大。 Abstract:Objective To study the burden of gastric cancer attributable to overconsumption of sodium among Chinese adults. Methods Based on the data of dietary sodium consumption obtained from the China National Nutrition and Health Surveillance 2012, the dietary sodium intake of adults in each province was estimated by using the method of Cooperative Kriging. Data on the incidence and death of gastric cancer in 2015 were obtained from Annals of the Cancer Registry. According to the proportional risk assessment theory, the Population Attributable Fraction of the incidence and death of gastric cancer attributable to high sodium intake was calculated by province. Results In 2015, the Population Attributable Fraction of overconsumption of sodium to the incidence and death of gastric cancer in adult was 29.94% and 28.95%. The number of incidence and death of gastric cancer attributable to overconsumption of dietary sodium were 80 718 and 56 578, and the morbidity and mortality were 8.04/100 000 and 5.64/100 000. Gansu had the highest morbidity and mortality of gastric cancer attributable to overconsumption of sodium (24.85/100 000 and 14.51/100 000 respectively). The lowest morbidity of gastric cancer attributed to high sodium diet was found in Guangdong (2.51/100 000), and the lowest mortality of gastric cancer attributed to high sodium diet was found in Tibet (0.29/100 000). Conclusion In 2015, the morbidity and mortality burden of gastric cancer in Chinese adults due to overconsumption of dietary sodium was at a high level, with great differences among provinces. -
Key words:
- Gastric cancer /
- Sodium /
- The burden of disease
-

图 1 各省(自治区、直辖市)高钠饮食对胃癌发病和死亡的人口归因比例
Figure 1. Population attribution of high sodium diet to the incidence and death of gastric cancer in different provinces (autonomous region, municipality)

图 2 各省(自治区、直辖市)归因于高钠饮食的胃癌发病数和死亡数
Figure 2. The number of gastric cancer cases and deaths attributable to high sodium diets by province (autonomous region, municipality)

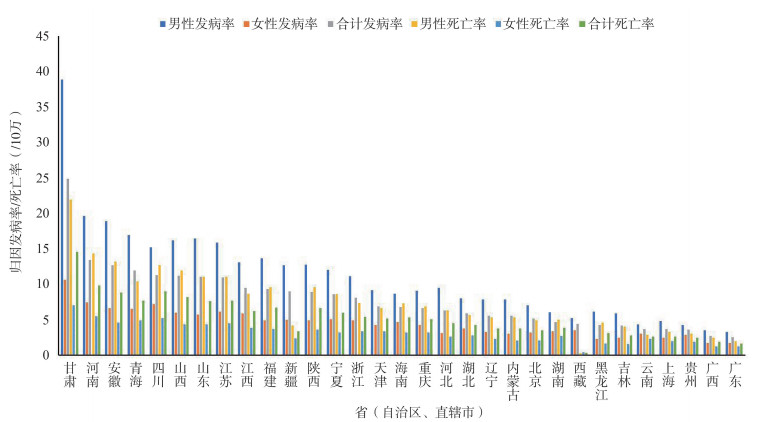
图 3 各省(自治区、直辖市)归因于高钠饮食的胃癌发病率和死亡率(/10万)
Figure 3. Provinces (autonomous region, municipality) attributed overconsumption of dietary sodium to gastric cancer morbidity and mortality(/100 000)
表 1 各年龄组高钠饮食对胃癌发病和死亡的人口归因比例
Table 1. Population attribution of high sodium diet to incidence and death of gastric cancer in different age groups
年龄组(岁) 发病人口归因比例(%) 死亡人口归因比例(%) 男性 女性 合计 男性 女性 合计 20~ < 25 37.88 34.03 36.00 37.52 33.92 36.09 25~ < 30 27.70 25.58 26.45 27.58 25.47 26.20 30~ < 35 29.96 26.95 28.08 29.81 26.99 28.06 35~ < 40 28.87 26.99 27.83 28.84 27.04 27.81 40~ < 45 40.66 35.44 38.29 40.65 35.55 38.33 45~ < 50 32.35 30.22 31.50 32.18 30.27 31.39 50~ < 55 30.24 27.48 29.29 30.10 27.47 29.16 55~ < 60 38.53 33.92 37.26 38.46 33.97 37.10 60~ < 65 39.23 34.62 37.96 39.25 34.70 37.94 65~ < 70 27.56 24.76 26.80 27.47 24.76 26.72 70~ < 75 26.17 24.45 25.68 26.06 24.50 25.61 75~ < 80 25.57 23.55 25.00 25.50 23.59 24.95 ≥80 26.53 24.22 25.84 26.46 24.23 25.77 合计 30.81 27.95 29.94 29.72 27.23 28.95  下载: 导出CSV
表 2 各年龄组归因于高钠饮食的胃癌发病数、死亡数、发病率和死亡率
Table 2. Number of gastric cancer cases, deaths, morbidity and mortality attributable to overconsumption of dietary sodium by age group
年龄组(岁) 发病数(人) 死亡数(人) 发病率(/10万) 死亡率(/10万) 男性 女性 合计 男性 女性 合计 男性 女性 合计 男性 女性 合计 20~ < 25 92 79 171 57 34 91 0.15 0.13 0.14 0.09 0.05 0.07 25~ < 30 132 175 307 60 104 163 0.26 0.35 0.31 0.12 0.21 0.16 30~ < 35 217 327 544 124 186 310 0.45 0.70 0.57 0.25 0.40 0.32 35~ < 40 476 551 1 027 258 319 577 0.80 0.96 0.88 0.43 0.56 0.49 40~ < 45 1 737 1 262 2 999 913 666 1 579 2.75 2.06 2.41 1.45 1.09 1.27 45~ < 50 2 563 1 595 4 157 1 318 869 2 187 4.79 3.09 3.96 2.46 1.69 2.08 50~ < 55 3 656 1 761 5 417 1 915 961 2 876 9.09 4.60 6.90 4.76 2.51 3.66 55~ < 60 9 202 3 101 12 304 4 882 1 870 6 753 22.46 7.73 15.18 11.92 4.66 8.33 60~ < 65 11 082 3 724 14 806 6 612 2 373 8 984 37.22 12.94 25.29 22.21 8.25 15.35 65~ < 70 7 998 2 696 10 694 5 331 1 832 7 162 38.60 13.26 26.05 25.72 9.01 17.44 70~ < 75 7 324 2 780 10 104 5 705 2 190 7 895 44.72 16.81 30.69 34.83 13.24 23.98 75~ < 80 6 694 2 426 9 120 6 140 2 322 8 462 59.45 19.34 38.31 54.53 18.50 35.54 ≥80 6 538 2 529 9 068 6 741 2 796 9 537 74.69 20.76 43.31 77.00 22.95 45.55 合计 57 712 23 006 80 718 40 057 16 520 56 578 11.41 4.62 8.04 7.92 3.32 5.64
下载: 导出CSV
-
[1] Powles J, Fahimi S, Micha R, et al. Global, regional and national sodium intakes in 1990 and 2010: a systematic analysis of 24 h urinary sodium excretion and dietary surveys worldwide[J]. BMJ Open, 2013, 3(12): e3733. DOI: 10.1136/bmjopen-2013-003733. [2] Fang K, He Y, Fang Y, et al. Dietary sodium intake and food sources among Chinese adults: data from the CNNHS 2010-2012[J]. Nutrients, 2020, 12(2): 453. DOI: 10.3390/nu12020453. [3] GBD 2017 Stomach Cancer Collaborators. The global, regional, and national burden of stomach cancer in 195 countries, 1990-2017: a systematic analysis for the Global Burden of Disease study 2017[J]. Lancet Gastroenterol Hepatol, 2020, 5(1): 42-54. DOI: 10.1016/S2468-1253(19)30328-0. [4] 方柯红, 房玥晖, 连怡遥, 等. 不同空间插值方法在钠摄入量估算中的应用[J]. 卫生研究, 2021, 50(2): 217-222. DOI: 10.19813/j.cnki.weishengyanjiu.2021.02.009.Fang KH, Fang YH, Lian YY, et al. Application of different spatial interpolation methods in sodium intake estimation[J]. J Hyg Res, 2021, 50(2): 217-222. DOI: 10.19813/j.cnki.weishengyanjiu.2021.02.009. [5] 赫捷. 2018中国肿瘤登记年报[M]. 北京: 人民卫生出版社, 2019.Hao J. China cancer registry annual report 2018[M]. Beijing: People's Medical Publishing House, 2019. [6] Forouzanfar MH, Alexander L, Anderson HR, et al. Global, regional, and national comparative risk assessment of 79 behavioural, environmental and occupational, and metabolic risks or clusters of risks in 188 countries, 1990-2013: a systematic analysis for the Global Burden of Disease Study 2013[J]. Lancet, 2015, 386(10010): 2287-2323. DOI: 10.1016/S0140-6736(15)00128-2. [7] 刘世炜, 蔡玥, 曾新颖, 等. 2013年中国居民高盐饮食对死亡和期望寿命的影响[J]. 中华流行病学杂志, 2017, 38(8): 1022-1027. DOI: 10.3760/cma.j.issn.0254-6450-2017.08.005.Liu SW, Cai Y, Zeng XY, et al. Deaths and life expectancy losses attributable to diet high in sodium in China[J]. Chin J Epidemiol, 2017, 38(8): 1022-1027. DOI: 10.3760/cma.j.issn.0254-6450-2017.08.005. [8] 李文燕. 2015年福建省分地市居民疾病负担研究[D]. 北京: 中国疾病预防控制中心, 2019.Li WY. Disease burden among residents of prefecture-level cities in Fujian Province in 2015[D]. Beijing: Chinese Center for Disease Control and Prevention, 2019. [9] Zhou M, Wang H, Zhu J, et al. Cause-specific mortality for 240 causes in China during 1990-2013: a systematic subnational analysis for the Global Burden of Disease Study 2013[J]. Lancet, 2016, 387(10015): 251-272. DOI: 10.1016/S0140-6736(15)00551-6. [10] 王宝华, 王宁, 冯雅靖, 等. 1990年与2013年中国人群胃癌疾病负担分析[J]. 中华流行病学杂志, 2016, 37(6): 763-767. DOI: 10.3760/cma.j.issn.0254-6450.2016.06.004.Wang BH, Wang N, Feng YJ, et al. Disease burden of stomach cancer in the Chinese population, in 1990 and 2013[J]. Chin J Epidemiol, 2016, 37(6): 763-767. DOI: 10.3760/cma.j.issn.0254-6450.2016.06.004. [11] He Y, Li Y, Yang X, et al. The dietary transition and its association with cardiometabolic mortality among Chinese adults, 1982-2012: a cross-sectional population-based study[J]. Lancet Diabetes Endocrinol, 2019, 7(7): 540-548. DOI: 10.1016/S2213-8587(19)30152-4. [12] Zhang T, Chen H, Yin X, et al. Changing trends of disease burden of gastric cancer in China from 1990 to 2019 and its predictions: findings from Global Burden of Disease Study[J]. Chin J Cancer Res, 2021, 33(1): 11-26. DOI: 10.21147/j.issn.1000-9604.2021.01.02. [13] Zhang J, Astell-Burt T, Seo DC, et al. Multilevel evaluation of 'China Healthy Lifestyles for All', a nationwide initiative to promote lower intakes of salt and edible oil[J]. Prev Med, 2014, 67: 210-215. DOI: 10.1016/j.ypmed.2014.07.019. [14] Millett C, Laverty AA, Stylianou N, et al. Impacts of a national strategy to reduce population salt intake in England: serial cross sectional study[J]. PLoS One, 2012, 7(1): e29836. DOI: 10.1371/journal.pone.0029836. [15] Mclaren L, Heidinger S, Dutton D J, et al. A repeated cross-sectional study of socio-economic inequities in dietary sodium consumption among Canadian adults: implications for national sodium reduction strategies[J]. Int J Equity Health, 2014, 13: 44. DOI: 10.1186/1475-9276-13-44. [16] Ikeda N, Takimoto H, Imai S, et al. Data resource profile: the Japan National Health and Nutrition Survey (NHNS)[J]. Int J Epidemiol, 2015, 44(6): 1842-1849. DOI: 10.1093/ije/dyv152. [17] Cogswell ME, Zhang Z, Carriquiry AL, et al. Sodium and potassium intakes among US adults: NHANES 2003-2008[J]. Am J Clin Nutr, 2012, 96(3): 647-657. DOI: 10.3945/ajcn.112.034413. [18] Bárbara P, Susana B, Clara C, et al. Worldwide burden of gastric cancer in 2010 attributable to high sodium intake in 1990 and predicted attributable burden for 2030 based on exposures in 2010[J]. Br J Nutr, 2016, 116(4): 728-733. DOI: 10.1017/S0007114516002518. -


 点击查看大图

计量
- 文章访问数: 662
- HTML全文浏览量: 326
- PDF下载量: 203
- 被引次数: 0