

Prediction of kidney cancer mortality trends and comparison of the two prediction models in China
-
摘要:
目的 建立并比较两种预测模型在中国肾癌死亡趋势中的应用,选取最佳模型对2020—2025年中国肾癌死亡率进行预测。 方法 收集全球健康数据交换(Global Health Data Exchange, GHDx)数据库1990—2019年中国人群全年龄组肾癌死亡率数据,使用R 4.0.2软件基于1990—2016年肾癌死亡率数据分别建立自回归移动平均模型(autoregressive integrated moving average model, ARIMA)和灰色模型(gray model, GM)(1, 1),比较2017—2019年预测值与实际值以评价两种模型的拟合和预测性能,采用最佳模型预测2020—2025年中国肾癌死亡情况。 结果 1990—2019年中国肾癌粗死亡率(crude mortality rate, CMR)呈上升趋势;在备选的ARIMA模型中,ARIMA(1, 2, 0)拟合效果最好,GM(1, 1)模型表达式为Y(t+1)=9.267 8e0.050 2(t)-8.771 0;ARIMA(1, 2, 0)模型的平均绝对误差(mean absolute error, MAE)、均方根误差(root mean squared error, RMSE)和平均绝对百分比误差(mean absolute percent error, MAPE)在拟合部分和预测部分均低于GM(1, 1)模型;根据最佳模型预测结果,2025年中国肾癌死亡率相比于2019年将增加7.74%。 结论 较于GM(1, 1)模型,ARIMA(1, 2, 0)模型对我国肾癌死亡率的拟合效果和预测性能更好。 Abstract:Objective To build and compare two forecasting models for kidney cancer mortality in China, and choose the best model to predict the mortality rate of kidney cancer in China from 2020 to 2025. Methods We collected the mortality data of kidney cancer in China among all ages in the global health data exchange (GHDx) database from 1990 to 2019. R 4.0.2 software were used to establish autoregressive integrated moving average model (ARIMA) model and gray model (GM) (1, 1) model. Based on kidney cancer mortality data from 1990 to 2016, we compared the predicted and actual values from 2017 to 2019 to evaluate the fitting and forecasting performance of the two models. Finally, we selected the optimal model to predict kidney cancer mortality in China from 2020 to 2025. Results There was an increasing trend for the crude mortality rate (CMR) of kidney cancer in China from 1990 to 201. The ARIMA (1, 2, 0) model has the best fitting effect among those alternative ARIMA models. The model expression of GM (1, 1) was Y(t+1)=9.267 8e0.050 2(t)-8.771 0. The mean absolute error (MAE), root mean squared error (RMSE) and mean absolute percent error (MAPE) of ARIMA (1, 2, 0) were lower than GM (1, 1) on fitting and forecasting performance. According to the best model prediction results, the mortality of kidney cancer in China will increase by 7.74%in 2025 compared to 2019. Conclusion Compared with GM (1, 1) model, ARIMA (1, 2, 0) model had better fitting effect and forecasting performance for kidney cancer mortality in China. -
Key words:
- Kidney neoplasms /
- Mortality /
- ARIMA model /
- Grey model /
- Prediction
-

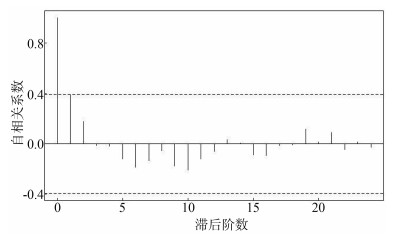
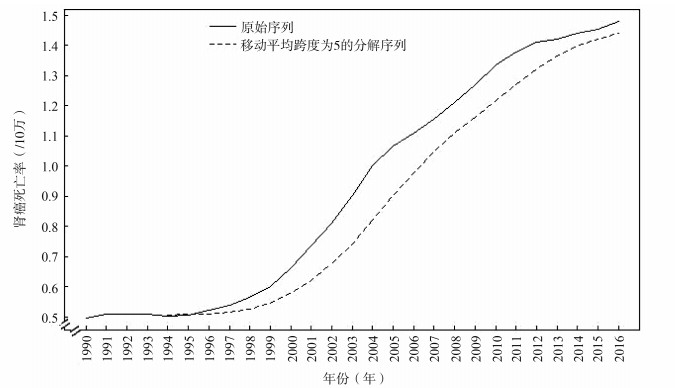
图 1 1990—2016年中国肾癌粗死亡率的原始序列以及序列分解图
Figure 1. Time series plot and time series decomposition plot of the crude mortality of kidney cancer in China from 1990 to 2016
表 1 各模型ACF图和PACF图的图形特点
Table 1. The graphic characteristics of ACF and PACF graphs for different models
模型 ACF图 PACF图 AR(p) 拖尾 >p阶后截尾 MA(q) >q阶后截尾 拖尾 ARIMA(p, q) 拖尾 拖尾  下载: 导出CSV
表 2 中国肾癌粗死亡率单位根与白噪声检验
Table 2. The unit root and white noise test of the differenced time series
变量 ADF检验 白噪声检验 t值 P值 Ljung-Box值 P值 肾癌死亡率 0.89 0.993 25.87 <0.001 肾癌死亡率对数变换后一阶差分 -1.05 0.733 22.95 <0.001 肾癌死亡率对数变换后二阶差分 -3.19 0.021 4.30 0.038
下载: 导出CSV
表 3 备选模型的拟合优度检验和残差检验
Table 3. Goodness of fit test and residual test of candidate models
参数 ARIMA(2, 2, 0) ARIMA(1, 2, 1) ARIMA(1, 2, 0) ARIMA(0, 2, 1) 估计值 统计量 P值 估计值 统计量 P值 估计值 统计量 P值 估计值 统计量 P值 AR1 0.40 1.95 0.031 0.42 1.07 0.146 0.40 2.19 0.019 — — — AR2 0.01 0.04 0.482 — — — — — — — — — MA1 — — — -0.02 -0.04 0.485 — — — 0.35 1.99 0.029 AIC -135.67 — — -135.67 — — -137.67 — — -136.88 — — BIC -132.01 — — -132.01 — — -135.23 — — -134.44 — — 对数似然值 70.84 — — 70.83 — — 70.83 — — 70.44 — — Ljung-Box残差检验 — 0.01 0.933 — 0.01 0.927 — 0.01 0.914 — 0.06 0.812
下载: 导出CSV
表 4 1990—2016年中国肾癌粗死亡率(/10万)序列及其可行性检验
Table 4. The crude mortality rate of kidney cancer (/100 000) in China from 1990 to 2016 and sequence feasibility test
年份
(年)实际死亡率
[X(t)0]累加序列
[X(t)1]紧邻均值序列
[X(t)2]光滑比
[ρ(t)]级比
[σ(t)]1990 0.50 0.50 — — — 1991 0.51 1.00 0.75 1.02 2.02 1992 0.51 1.51 1.26 0.51 1.51 1993 0.51 2.02 1.77 0.34 1.34 1994 0.50 2.53 2.27 0.25 1.25 1995 0.51 3.03 2.78 0.20 1.20 1996 0.52 3.55 3.29 0.17 1.17 1997 0.54 4.09 3.82 0.15 1.15 1998 0.56 4.65 4.37 0.14 1.14 1999 0.60 5.26 4.95 0.13 1.13 2000 0.66 5.92 5.59 0.13 1.13 2001 0.73 6.65 6.28 0.12 1.12 2002 0.81 7.46 7.06 0.12 1.12 2003 0.90 8.36 7.91 0.12 1.12 2004 1.00 9.36 8.86 0.12 1.12 2005 1.07 10.43 9.90 0.11 1.11 2006 1.11 11.54 10.98 0.11 1.11 2007 1.16 12.70 12.12 0.10 1.10 2008 1.21 13.91 13.30 0.10 1.10 2009 1.27 15.18 14.54 0.09 1.09 2010 1.34 16.51 15.84 0.09 1.09 2011 1.38 17.89 17.20 0.08 1.08 2012 1.41 19.30 18.60 0.08 1.08 2013 1.42 20.72 20.01 0.07 1.07 2014 1.44 22.16 21.44 0.07 1.07 2015 1.45 23.61 22.89 0.07 1.07 2016 1.48 25.09 24.35 0.06 1.06
下载: 导出CSV
表 5 两种模型的预测效果评价
Table 5. Evaluation of prediction effect of the two models
年份
(年)真实值 预测值 绝对误差(%) 相对误差(%) ARIMA
(1, 2, 0)
模型GM
(1, 1)
模型ARIMA
(1, 2, 0)
模型GM
(1, 1)
模型ARIMA
(1, 2, 0)
模型GM
(1, 1)
模型2017 1.53 1.51 1.76 0.02 0.24 1.41 14.78 2018 1.60 1.54 1.85 0.06 0.24 3.78 15.22 2019 1.68 1.58 1.94 0.11 0.26 6.26 15.39
下载: 导出CSV
表 6 两种模型的拟合部分和预测部分比较
Table 6. Comparison of fitting and forecasting performance of the two models
模型 拟合部分(%) 预测部分(%) R2(%)
值MAE
值RMSE
值MAPE
值MAE
值RMSE
值MAPE
值ARIMA
(1, 2, 0)0.96 0.13 1.08 6.29 0.71 3.82 99.62 GM(1, 1) 7.67 0.87 8.95 24.32 2.44 15.13 92.95
下载: 导出CSV
表 7 2020—2025年中国肾癌粗死亡率的ARIMA(1, 2, 0)模型预测值
Table 7. The prediction value of ARIMA (1, 2, 0) model for the crude mortality rate of kidney cancer in China from 2020 to 2025
年份(年) 粗死亡率
(/10万)(95% CI)下限 (95% CI)上限 2020 1.62 1.21 2.16 2021 1.65 1.09 2.49 2022 1.69 0.98 2.91 2023 1.73 0.87 3.45 2024 1.77 0.76 4.12 2025 1.81 0.66 4.98
下载: 导出CSV
-
[1] Ferlay J, Soerjomataram I, Dikshit R, et al. Cancer incidence and mortality worldwide: sources, methods and major patterns in GLOBOCAN 2012[J]. Int J Cancer, 2015, 136(5): e359-e386. DOI: 10.1002/ijc.29210. [2] Bray F, Ferlay J, Soerjomataram I, et al. Global cancer statistics 2018: GLOBOCAN estimates of incidence and mortality worldwide for 36 cancers in 185 countries[J]. CA Cancer J Clin, 2018, 68(6): 394-424. DOI: 10.3322/caac.21492. [3] Znaor A, Lortet-Tieulent J, Laversanne M, et al. International variations and trends in renal cell carcinoma incidence and mortality[J]. Eur Urol, 2015, 67(3): 519-530. DOI: 10.1016/j.eururo.2014.10.002. [4] 韩苏军, 王栋, 寿建忠, 等. 跨世纪十年中国肾癌死亡趋势分析[J]. 癌症进展, 2019, 17(10): 1143-1146. DOI: 10.11877/j.issn.1672-1535.2019.17.10.08.Han SJ, Wang D, Shou JZ, et al. Analysis of the trend of death of kidney cancer in China in the past ten years[J]. Oncology Progress, 2019, 17(10): 1143-1146. DOI: 10.11877/j.issn.1672-1535.2019.17.10.08. [5] Hofmann F, Hwang EC, Lam TB, et al. Targeted therapy for metastatic renal cell carcinoma[J]. Cochrane Database Syst Rev, 2020, 10(10): CD012796. DOI: 10.1002/14651858.cd012796.pub2. [6] Earnest A, Evans SM, Sampurno F, et al. Forecasting annual incidence and mortality rate for prostate cancer in Australia until 2022 using autoregressive integrated moving average (ARIMA) models[J]. BMJ Open, 2019, 9(8): e031331. DOI: 10.1136/bmjopen-2019-031331. [7] 曹新西, 徐晨婕, 侯亚冰, 等. 1990—2025年我国高发慢性病的流行趋势及预测[J]. 中国慢性病预防与控制, 2020, 28(1): 14-19. DOI: 10.16386/j.cjpccd.issn.1004-6194.2020.01.004.Cao XX, Xu CJ, Hou YB, et al. The epidemic trend and prediction of chronic diseases with high incidence in China from 1990 to 2025[J]. Chin J Prev Control Chron Dis, 2020, 28(1): 14-19. DOI: 10.16386/j.cjpccd.issn.1004-6194.2020.01.004. [8] 祝丽玲, 孟繁君, 杨迪. 基于GM(1, 1)模型对我国妇幼保健指标的预测[J]. 中华疾病控制杂志, 2019, 23(8): 977-980, 1007. DOI: 10.16462/j.cnki.zhjbkz.2019.08.018.Zhu LL, Meng FJ, Yang D. Prediction of maternal and child health care indicators in China based on GM (1, 1) model[J]. Chin J Dis Control Prev, 2019, 23(8): 977-980, 1007. DOI: 10.16462/j.cnki.zhjbkz.2019.08.018. [9] 胡敏, 杜成凤, 唐晓君, 等. 痛风月发病趋势预测及预测模型效果探讨[J]. 重庆医科大学学报, 2017, 42(5): 537-541. DOI: 10.13406/j.cnki.cyxb.001308.Hu M, Du CF, Tang XJ, et al. Trends prediction of monthly gout incidence and comparison of model performance among four time series models[J]. J Chongqing Med Univ, 2017, 42(5): 537-541. DOI: 10.13406/j.cnki.cyxb.001308. [10] Zhou M, Wang H, Zeng X, et al. Mortality, morbidity, and risk factors in China and its provinces, 1990-2017: a systematic analysis for the Global Burden of Disease Study 2017[J]. Lancet, 2019, 394(10204): 1145-1158. DOI: 10.1016/s0140-6736(19)30427-1. [11] GBD 2019 Diseases and Injuries Collaborators. Global burden of 369 diseases and injuries in 204 countries and territories, 1990-2019: a systematic analysis for the Global Burden of Disease Study 2019[J]. Lancet, 2020, 396(10258): 1204-1222. DOI: 10.1016/s0140-6736(20)30925-9. [12] 屈彦, 王天一, 杨津, 等. GBD数据库的数据提取方法与流程[J]. 中国循证心血管医学杂志, 2019, 11(9): 1043-1046. DOI: 10.3969/j.issn.1674-4055.2019.09.04.Qu Y, Wang TY, Yang J, et al. GBD database application and data extraction methods and processes[J]. Chin J Evid Based Cardiovasc Med, 2019, 11(9): 1043-1046. DOI: 10.3969/j.issn.1674-4055.2019.09.04. [13] Liu SF, Forrest J, Yang YJ. A brief introduction to grey systems theory[J]. Grey Syst, 2012, 2(2): 89-104. DOI: 10.1108/20439371211260081. [14] Yang X, Zou J, Kong D, et al. The analysis of GM (1, 1) grey model to predict the incidence trend of typhoid and paratyphoid fevers in Wuhan City, China[J]. Medicine (Baltimore), 2018, 97(34): e11787. DOI: 10.1097/md.0000000000011787. [15] GBD 2019 Demographics Collaborators. Global age-sex-specific fertility, mortality, healthy life expectancy (HALE), and population estimates in 204 countries and territories, 1950-2019: a comprehensive demographic analysis for the Global Burden of Disease Study 2019[J]. Lancet, 2020, 396(10258): 1160-1203. DOI: 10.1016/s0140-6736(20)30977-6. [16] Capitanio U, Bensalah K, Bex A, et al. Epidemiology of renal cell carcinoma[J]. Eur Urol, 2019, 75(1): 74-84. DOI: 10.1016/j.eururo.2018.08.036. [17] 陈黎明. ARIMA模型在上海市期望寿命预测中的应用[J]. 池州学院学报, 2016, 30(2): 49-51. DOI: 10.13420/j.cnki.jczu.2016.02.013.Chen LM. Application of ARIMA model on life expectancy prediction in Shanghai[J]. J Chi Zhou Univ, 2016, 30(2): 49-51. DOI: 10.13420/j.cnki.jczu.2016.02.013. [18] 王瑾瑶. 中国城乡子宫颈癌死亡趋势比较及其预测研究[D]. 武汉: 武汉大学, 2017.Wang JY. Comparison of secular trends in cervical cancer mortality and prediction of cervical cancer mortality in urban and rural areas of China[D]. Wuhan: Wuhan University, 2017. [19] 张静. 基于灰色系统理论的轨道交通综合评价预测研究-以杭州市为例[D]. 杭州: 浙江科技学院, 2020.Zhang J. Research on comprehensive evaluation and prediction of rail transit based on grey system theory-a case study of Hangzhou City[D]. Hangzhou: Zhejiang University of Science and Technology, 2020. [20] Gao J, Li J, Wang M. Time series analysis of cumulative incidences of typhoid and paratyphoid fevers in China using both Grey and SARIMA models[J]. PLoS One, 2020, 15(10): e0241217. DOI: 10.1371/journal.pone.0241217. [21] Lin H, Shi L, Zhang J, et al. Epidemiological characteristics and forecasting incidence for patients with breast cancer in Shantou, Southern China: 2006-2017[J]. Cancer Med, 2021, 10(8): 2904-2913. DOI: 10.1002/cam4.3843. [22] Wang YW, Shen ZZ, Jiang Y. Comparison of ARIMA and GM (1, 1) models for prediction of hepatitis B in China[J]. PLoS One, 2018, 13(9): e0201987. DOI: 10.1371/journal.pone.0201987. [23] Wang Y, Shen Z, Jiang Y. Analyzing maternal mortality rate in rural China by Grey-Markov model[J]. Medicine (Baltimore), 2019, 98(6): e14384. DOI: 10.1097/md.0000000000014384. [24] 邓芷晴, 周利华, 叶久红, 等. ARIMA模型在肺癌发病率预测中的应用[J]. 医学新知杂志, 2019, 29(4): 414-417, 466. DOI: 10.3969/j.issn.1004-5511.2019.04.020.Deng ZQ, Zhou LH, Ye JH, et al. Application of ARIMA model in forecast of the incidence of lung cancer[J]. J New Med, 2019, 29(4): 414-417, 466. DOI: 10.3969/j.issn.1004-5511.2019.04.020. -


 点击查看大图
计量
- 文章访问数: 579
- HTML全文浏览量: 253
- PDF下载量: 176
- 被引次数: 0