

Longitudinal trajectories of lifestyle index and their association with blood pressure changes among middle-aged and older adults
-
摘要:
目的 探讨中老年人生活方式指数随时间的发展轨迹特征及其与血压变化的关系。 方法 基于社区生活方式干预研究队列,2010年1月―2012年3月在广州市2个社区纵向收集50~79岁中老年人的基线及之后6、12和24个月的生活方式(吸烟、饮酒、膳食、体力活动和BMI)和血压测量数据,并计算健康生活方式指数(health lifestyle index, HLI)。采用组基础模型(group-based trajectory model, GBTM)识别HLI的发展轨迹,通过混合线性模型分析HLI轨迹组与血压变化的关系。 结果 共有393人纳入分析,其中,男性130人,年龄(58.6±7.3)岁。GBTM识别出3种HLI发展轨迹:“持续低水平组”(组1,26.7%)和“中水平-轻度改善组”(组2,52.7%)及“高水平-快速改善组”(组3,20.6%)。调整混杂因素后,与组1相比,随访期间组2的血压变化均无统计学意义(均有P>0.05);而组3表现出明显的血压下降,SBP在6、12和24个月的降低值分别为-5.2mm Hg、-8.1mm Hg和-6.7 mm Hg(均有P < 0.01),DBP在12和24个月的降低值分别为-4.7mm Hg和-2.9 mm Hg(均有P < 0.05)。 结论 中老年人的HLI随时间变化存在高、中和低三种轨迹组;高水平HLI轨迹组干预期间的血压降低优于中、低水平组,应针对不同轨迹组人群制定差异性的生活方式干预对策。 Abstract:Objective To investigate trajectories of lifestyle index and their association with blood pressure change in the middle-aged and older adults. Methods A community-based lifestyle intervention trial for adults aged 50-79 was conducted in two communities in Guangzhou from January 2010 to March 2012. Data of lifestyle factors (including smoking, alcohol drinking, diet, physical activity and BMI) and blood pressure (BP) were collected at baseline and 6, 12 and 24 months. Lifestyle indicators were used to generate a healthy lifestyle index (HLI). Trajectories of HLI were identified using a group-based trajectory modelling approach. Linear mixed models were performed to examine the association between HLI trajectories and blood pressure change after adjusting for covariates. Results A total of 393 individuals were included, of which 130 were males (33.1%) and the mean age was (58.6±7.3) years. Three distinct HLI trajectories were identified: persistently low (Group 1, 26.7%), moderate and slightly improved (Group 2, 52.7%) and high and rapidly improved (Group 3, 20.6%). Compared with Group 1, there was no apparent change in blood pressure in Group 2 (all P >0.05) during follow-up. While significant reductions in SBP (6 months: -5.2 mm Hg; 12 months: -8.2 mm Hg; 24 months: -6.7 mm Hg; all P < 0.01) and DBP (12 months: -4.7 mm Hg; 24 months: -2.9 mm Hg; all P < 0.05) were observed in Group 3. Conclusions Three distinct HLI trajectories (high, medium and low) were identified in the middle-aged and older adults. BP reductions during intervention period were greater in the high-level trajectory group compared with the medium- and low-level group. Specific lifestyle intervention measures targeting different trajectory groups should be developed. -
Key words:
- Lifestyle index /
- Trajectory /
- Group-based trajectory model /
- Blood pressure /
- Intervention study
-

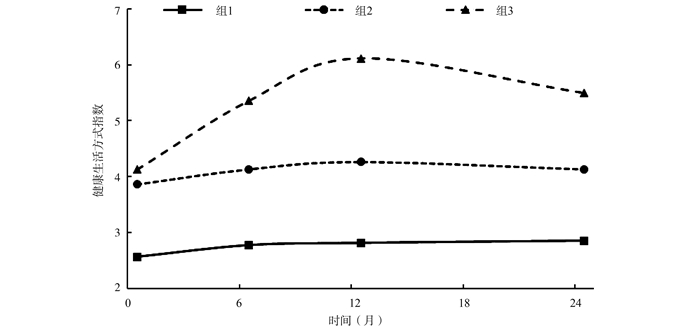
图 1 中老年人群健康生活方式指数随时间变化的轨迹
Figure 1. Healthy lifestyle index trajectories over time among middle-aged and older adults
表 1 组基础模型的拟合参数
Table 1. Goodness of fit indices for group-based trajectory models
轨迹组数 BIC 对数贝叶斯因子 平均后验概率a 正确分类OR值a 模型估算的亚组比例(%) 实际亚组比例(%) 2 -2 188.53 336.62 0.902~0.913 8.6~11.3 51.8/48.2 52.9/47.1 3 -2 100.02 177.02 0.881~0.909 7.7~35.2 25.9/52.1/22.0 26.7/52.7/20.6 4 -2 110.95 -21.86 0.860~0.894 7.4~154.9 4.4/32.1/45.4/18.1 4.6/31.6/46.6/17.3 5 -2 113.85 -5.80 0.793~0.890 7.6~175.8 4.4/31.2/44.8/9.7/9.8 4.6/30.3/47.1/9.4/8.6 注:a数据为各组参数的最小值、最大值。  下载: 导出CSV
表 2 不同HLI轨迹组研究对象的基本特征
Table 2. Basic characteristics of participants among different HLI trajectories
变量 总人群(n=393) 组1(n=105) 组2(n=207) 组3(n=81) χ2/F值 P值 综合干预组[n (%)] 191(48.6) 34(32.4) 84(40.6) 73(90.1) a, b 72.295 < 0.001 男性[n (%)] 130(33.1) 63(60.0) 47(22.7) a 20(24.7) a 47.013 < 0.001 年龄[(x±s),岁] 58.6±7.3 58.0±6.7 59.6±7.9 56.6±5.7 b 5.402 0.005 高中及以上[n (%)] 216(55.0) 59(56.2) 103(49.8) 54(66.7) b 6.811 0.033 有配偶[n (%)] 324(82.4) 89(84.8) 164(79.2) 71(87.7) 3.389 0.184 人均月收入 < 2 000元[n (%)] 244(62.1) 65(61.9) 123(59.4) 56(69.1) 2.337 0.311 基线SBP[(x±s), mm Hg] 133.6±14.4 137.8±12.8 134.2±14.9 126.5±12.2 a, b 15.644 < 0.001 基线DBP[(x±s), mm Hg] 80.7±8.8 83.1±8.1 80.7±9.1 a 77.6±7.8 a, b 9.417 < 0.001 基线高血压患病[n (%)] 194(49.4) 61(58.1) 112(54.1) 21(25.9) a, b 22.866 < 0.001 注:a与组1比较,P < 0.017;b与组2比较,P < 0.017。
下载: 导出CSV
表 3 HLI轨迹分组影响因素的多项Logistic回归
Table 3. Multinomial Logistic regression analysis of HLI trajectory class membership
变量 组1 组2 OR (95% CI)值 P值 OR (95% CI)值 P值 综合干预组
(参照:对照组)0.02(0.01, 0.06) < 0.001 0.04(0.02, 0.10) < 0.001 男性
(参照:女性)12.88(5.52, 30.03) < 0.001 1.71(0.81, 3.59) 0.159 高血压
(参照:血压正常)10.19(4.44, 23.38) < 0.001 4.71(2.33, 9.52) < 0.001 注:以组3为参照;校正基线年龄、文化程度、婚姻状况、人均月收入和血压水平。
下载: 导出CSV
表 4 三个HLI轨迹组人群随访期间的血压变化情况
Table 4. Changes in blood pressure during follow-up among three trajectories of HLI
血压变化值 组1 组2 组3 变化值差异(组2-组1) 变化值差异(组3-组1) SBP (mm Hg) 6月-基线 -1.3(-3.5, 0.8) -2.5(-4.1, -1.0) -6.5(-9.0, -4.1) -1.2(-3.8, 1.5) -5.2(-8.4, -1.9) 12月-基线 -1.0(-3.5, 1.6) -3.8(-5.6, -2.0) -9.1(-11.9, -6.2) -2.8(-5.9, 0.3) -8.1(-11.9, -4.3) 24月-基线 1.9(-0.9, 4.7) 1.3(-0.6, 3.2) -4.8(-7.9, -1.7) -0.6(-4.0, 2.8) -6.7(-10.9, -2.6) DBP (mm Hg) 6月-基线 -1.1(-2.6, 0.3) -0.9(-2.0, 0.1) -2.6(-4.3, -1.0) 0.2(-1.6, 2.0) -1.5(-3.7, 0.7) 12月-基线 -0.2(-1.8, 1.4) -1.8(-2.9, -0.7) -4.9(-6.7, -3.1) -1.6(-3.5, 0.4) -4.7(-7.1, -2.3) 24月-基线 1.8(-0.1, 3.6) 0.8(-0.5, 2.1) -1.1(-3.2, 0.9) -0.9(-3.2, 1.3) -2.9(-5.6, -0.1) 注:括号内数据为95% CI;校正干预方式、性别、基线时年龄、高血压病史、HLI和BMI。
下载: 导出CSV
表 5 三个HLI轨迹组随访期间血压异常人数的变化情况
Table 5. Changes in counts (%) of subjects with abnormal blood pressure status at baseline and follow-up by three HLI trajectories
时间 血压正常人群 高血压人群 组1 组2 组3 组1 组2 组3 基线 0/44(0.0) 0/95(0.0) 0/60(0.0) 44/61(72.1) 66/112(58.9) 9/21(42.9) 6月 3/43(7.0) 8/93(8.6) 3/60(5.0) 25/60(41.7) 46/109(42.2) 4/21(19.0) 12月 8/40(20.0) 5/85(5.9) 1/54(1.9) 22/53(41.5) 37/104(35.6) 1/20(5.0) 24月 13/34(38.2) 23/80(28.7) 2/51(2.9) 31/47(66.0) 53/88(60.2) 5/16(31.3) 注:血压异常定义为SBP/DBP>140/90 mm Hg;数据为异常人数/随访人数(%)。
下载: 导出CSV
-
[1] GBD 2019 Risk Factors Collaborators. Global burden of 87 risk factors in 204 countries and territories, 1990-2019: a systematic analysis for the Global Burden of Disease Study 2019[J]. Lancet, 2020, 396(10258): 1223-1249. DOI: 10.1016/S0140-6736(20)30752-2. [2] Mills KT, Stefanescu A, He J. The global epidemiology of hypertension[J]. Nat Rev Nephrol, 2020, 16(4): 223-237. DOI: 10.1038/s41581-019-0244-2. [3] 贺枝, 刘芳超, 李建新, 等. 中国农村地区高血压患者果蔬摄入对血压进展的影响研究[J]. 中华疾病控制杂志, 2021, 25(3): 276-283. DOI: 10.16462/j.cnki.zhjbkz.2021.03.006.He Z, Liu FC, Li JX. Influence of fruit and vegetable consumption on blood pressure progression among hypertensive patients in rural China[J]. Chin J Dis Control Prev, 2021, 25(3): 276-283. DOI: 10.16462/j.cnki.zhjbkz.2021.03.006. [4] 缪茜, 郑山, 罗妍, 等. 金昌队列人群高血压发病风险及影响因素[J]. 中华高血压杂志, 2020, 28(10): 953-959. DOI: 10.16439/j.cnki.1673-7245.2020.10.013.Miao Q, Zheng S, Luo Y, et al. The risk and influencing factors of hypertension in Jinchang cohort[J]. Chin J Hypertension, 2020, 28(10): 953-959. DOI: 10.16439/j.cnki.1673-7245.2020.10.013. [5] Fu J, Liu Y, Zhang L, et al. Nonpharmacologic interventions for reducing blood pressure in adults with prehypertension to established hypertension[J]. J Am Heart Assoc, 2020, 9(19): e016804. DOI: 10.1161/JAHA.120.016804. [6] Colpani V, Baena CP, Jaspers L, et al. Lifestyle factors, cardiovascular disease and all-cause mortality in middle-aged and elderly women: a systematic review and meta-analysis[J]. Eur J Epidemiol, 2018, 33(9): 831-845. DOI: 10.1007/s10654-018-0374-z. [7] Lelong H, Blacher J, Baudry J, et al. Combination of healthy lifestyle factors on the risk of hypertension in a large cohort of French adults[J]. Nutrients, 2019, 11(7): 1687. DOI: 10.3390/nu11071687. [8] Díaz-Gutiérrez J, Ruiz-Estigarribia L, Bes-Rastrollo M, et al. The role of lifestyle behaviour on the risk of hypertension in the SUN cohort: The hypertension preventive score[J]. Prev Med, 2019, 123: 171-178. DOI: 10.1016/j.ypmed.2019.03.026. [9] Lin A, Zhang G, Liu Z, et al. Community-based lifestyle intervention for reducing blood pressure and glucose among middle-aged and older adults in China: a pilot study. Int J Environ Res Public Health, 2014, 11(11): 11645-11663. DOI: 10.3390/ijerph111111645. [10] 潘子瑞, 孙中明, 文进博, 等. 江苏省22 083名心血管病高危人群健康生活方式的现状分析[J]. 中华疾病控制杂志, 2021, 25(8): 948-954. DOI: 10.16462/j.cnki.zhjbkz.2021.08.014.Pan ZR, Sun ZM, Wen JB, et al. Analysis of healthy lifestyle status of 22 083 high-risk populations of cardiovascular disease in Jiangsu Province[J]. Chin J Dis Control Prev, 2021, 25(8): 948-954. DOI: 10.16462/j.cnki.zhjbkz.2021.08.014. [11] 中华预防医学会, 中华预防医学会心脏病预防与控制专业委员会, 中华医学会糖尿病学分会, 等. 中国健康生活方式预防心血管代谢疾病指南[J]. 中华预防医学杂志, 2020, 54(3): 256-277. DOI: 10.3760/cma.j.issn.0253-9624.2020.03.006.Chinese Preventive Medicine Association, Branch of Heart Disease Prevention and Control, Chinese Preventive Medicine Association, Chinese Diabetes Society, et al. Chinese guideline on healthy lifestyle to prevent cardiometabolic diseases[J]. Chin J Prevent Med, 2020, 54(3): 256-277. DOI: 10.3760/cma.j.issn.0253-9624.2020.03.006. [12] Lennon H, Kelly S, Sperrin M, et al. Framework to construct and interpret latent class trajectory modelling[J]. BMJ Open, 2018, 8(7): e020683. DOI: 10.1136/bmjopen-2017-020683. [13] Imes CC, Zheng Y, Mendez DD, et al. Group-based trajectory analysis of physical activity change in a US weight loss intervention[J]. J Phys Act Health, 2018, 15(11): 840-846. DOI: 10.1123/jpah.2017-0484. [14] Aggio D, Papachristou E, Papacosta O, et al. Trajectories of self-reported physical activity and predictors during the transition to old age: a 20-year cohort study of British men[J]. Int J Behav Nutr Phys Act, 2018, 15(1): 14. DOI: 10.1186/s12966-017-0642-4. [15] Lyu J, Liu QM, Ren YJ, et al. A community-based multilevel intervention for smoking, physical activity and diet: short-term findings from the Community Interventions for Health programme in Hangzhou, China[J]. J Epidemiol Community Health, 2014, 68(4): 333-339. DOI: 10.1136/jech-2013-203356. [16] 刘敏, 倪文庆, 徐健, 等. 深圳市福田区慢性病高风险人群生活方式干预效果评价[J]. 中华预防医学杂志, 2018, 52(4): 396-401. DOI: 10.3760/cma.j.issn.0253-9624.2018.04.012.Liu M, Ni WQ, Xu J, et al. Effect of lifestyle intervention among high risk group of chronic diseases in Shenzhen Futian district[J]. Chin J Prevent Med, 2018, 52(4): 396-401. DOI: 10.3760/cma.j.issn.0253-9624.2018.04.012. [17] Jiang L, Chen S, Zhang B, et al. Longitudinal patterns of stages of change for exercise and lifestyle intervention outcomes: an application of latent class analysis with distal outcomes[J]. Prev Sci, 2016, 17(3): 398-409. DOI: 10.1007/s11121-015-0599-y. [18] King DE, Mainous AG 3rd, Carnemolla M, et al. Adherence to healthy lifestyle habits in US adults, 1988-2006[J]. Am J Med, 2009, 122(6): 528-534. DOI: 10.1016/j.amjmed.2008.11.013. [19] Barbaresko J, Rienks J, Nöthlings U. Lifestyle indices and cardiovascular disease risk: a meta-analysis[J]. Am J Prev Med, 2018, 55(4): 555-564. DOI: 10.1016/j.amepre.2018.04.046. -

 点击查看大图
计量
- 文章访问数: 450
- HTML全文浏览量: 300
- PDF下载量: 92
- 被引次数: 0