

A comparative study of three models for syphilis incidence trend analysis in China from 2011 to 2020
-
摘要:
目的 比较差分自回归移动平均(autoregressive integrated moving average model, ARIMA)模型、非线性自回归神经网络(nonlinear autoregressive neural network, NAR)模型和长短期记忆神经网络(long-short term memory neural network, LSTM)模型应用于梅毒报告发病预测的效果, 优化疫情预测模型。 方法 以中国31个省、自治区、直辖市(未包含中国台湾、香港和澳门)2011-2019年梅毒月报告发病率为拟合集, 建立ARIMA模型、NAR模型和LSTM模型, 比较3种模型的拟合效果。以2020年梅毒月报告发病率为预测集, 比较3种模型的预测效果。 结果 ARIMA模型、NAR模型和LSTM模型拟合所得的平均绝对误差(mean absolute deviation, MAD)分别为0.013、0.011和0.002, 均方根误差(root mean squared error, RMSE)分别为0.015、0.018和0.003, 平均绝对百分比误差(mean absolute percentage error, MAPE)分别为4.266%、3.810%和0.692%;预测所得的MAD分别为0.064、0.049和0.044, RMSE分别为0.069、0.068和0.060, MAPE分别为23.310%、17.629%和18.575%。 结论 LSTM模型拟合预测梅毒报告发病率的效果更好, 为梅毒疫情的防控提供数据支撑。 Abstract:Objective This study was aimed to compare the effects of the autoregressive integrated moving average (ARIMA) model, nonlinear autoregressive neural network (NAR) model and long-short term memory neural network (LSTM) model applied to predict the reported incidence of syphilis to optimize the epidemic prediction model. Methods Based on the fitting dataset of the monthly reported incidence of syphilis in 31 provinces, autonomous regions and municipalities (excluding Taiwan, Hong Kong and Macao) in China from 2011 to 2019, the ARIMA model, NAR model and LSTM model were established to compare the fitting effects of these models. Data on the incidence of syphilis in 2020 was used to compare the prediction effects of these models. Results The mean absolute deviations (MAD) of the ARIMA model, NAR model and LSTM model fitting effect were 0.013, 0.011 and 0.002, respectively. The root mean squared errors (RMSE) were 0.015, 0.018 and 0.003, respectively. The mean absolute percentage errors (MAPE) were 4.266%, 3.810% and 0.692%, respectively. The MADs of the forecasting effect were 0.064, 0.049 and 0.044, the RMSEs were 0.069, 0.068 and 0.060 and the MAPEs were 23.310%, 17.629% and 18.575%, respectively. Conclusions The LSTM model has better fitting and forecasting effects than the ARIMA and NAR models in predicting the reported incidence of syphilis, which could provide data support for the prevention and control of syphilis. -
Key words:
- Syphilis /
- ARIMA model /
- NAR model /
- LSTM model /
- Predicting
-

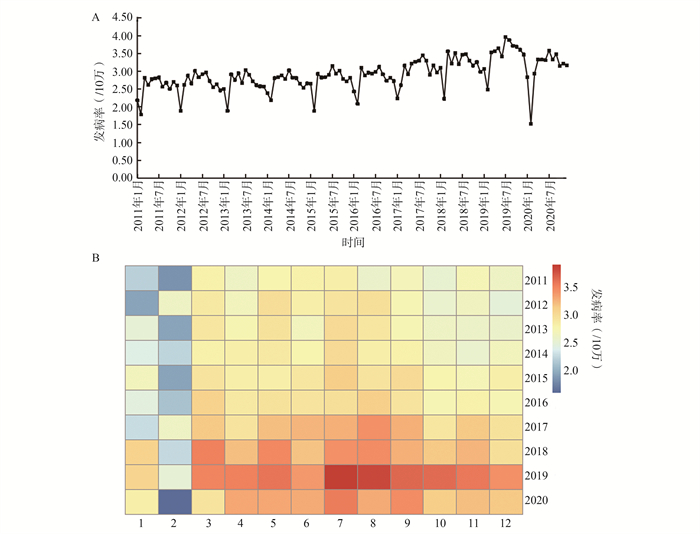
图 1 梅毒月报告发病率描述性分析(A:趋势图;B:热图)
Figure 1. Descriptive analysis of monthly reported incidence of syphilis (A: Trend chart; B: Heat map)

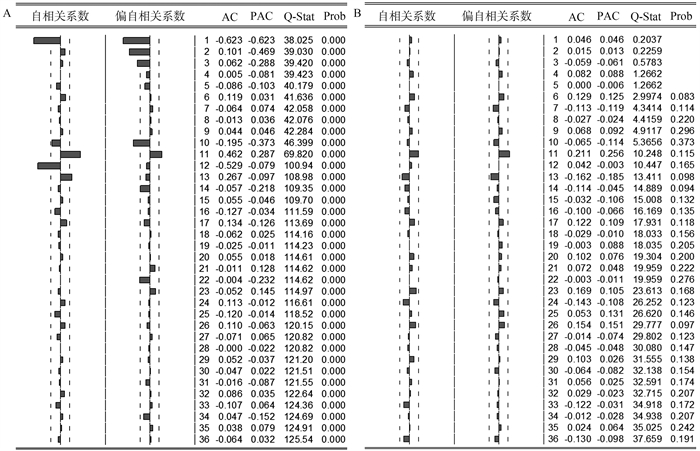
图 2 差分后序列和残差序列的自相关图和偏自相关图
注:A:差分后序列;B:残差序列。
Figure 2. ACF and PACF of the differential sequence and residual sequence

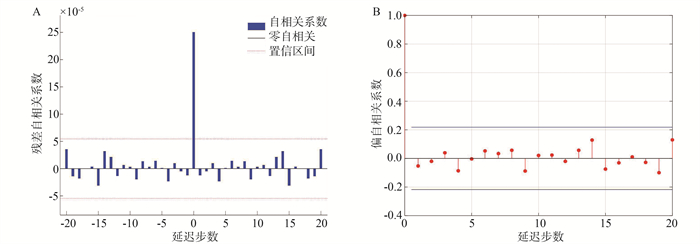
图 3 NAR模型残差序列自相关图和偏自相关图
注:A:自相关图;B:偏自相关图。
Figure 3. ACF and PACF of the residual sequence of NAR model

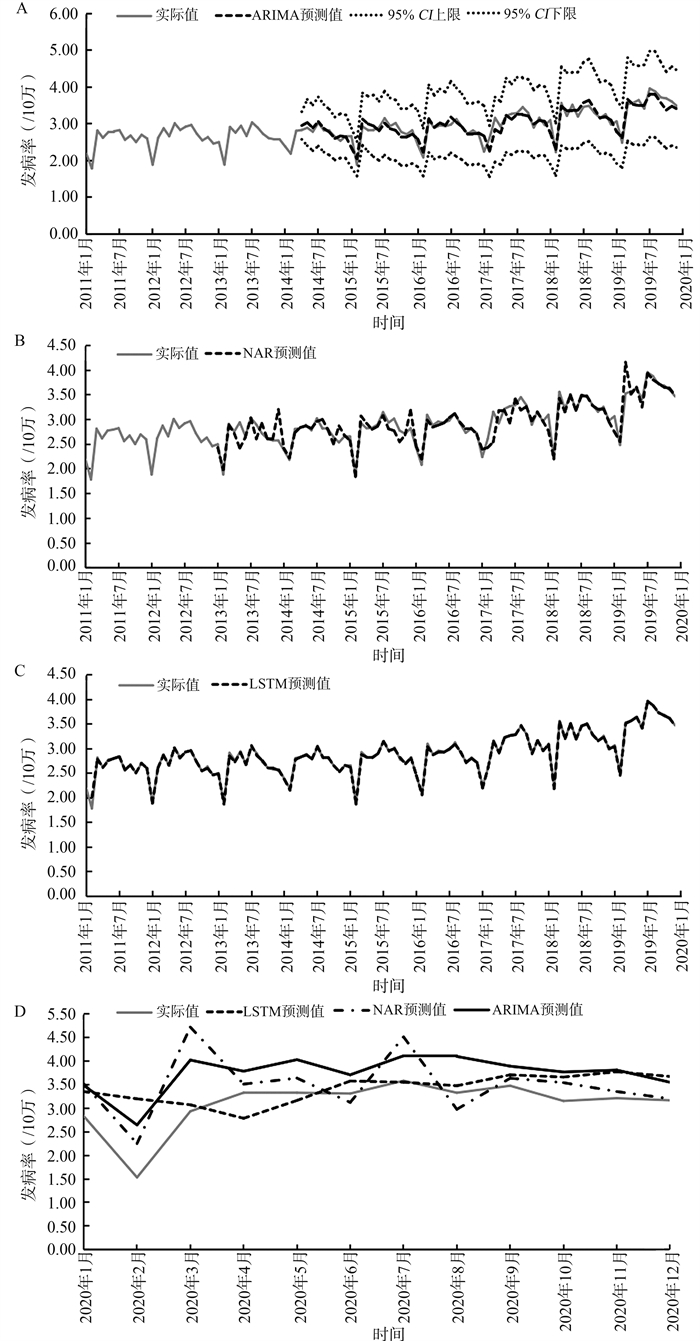
图 4 ARIMA模型、NAR模型和LSTM模型的拟合和预测效果
注:A:ARIMA模型拟合;B:NAR模型拟合; C:LSTM模型拟合;D:三种模型预测。
Figure 4. Fitting and prediction effects of ARIMA, NAR and LSTM models
表 1 ARIMA模型参数估计和拟合优度的结果
Table 1. Parameter estimation and goodness of fitting of ARIMA model
模型参数 β值 sx值 t值 P值 AR(1) -0.702 0.116 -6.042 <0.001 AR(2) -0.465 0.134 -3.482 0.001 MA(1) -0.838 0.085 -9.823 <0.001 SAR(1) -0.286 0.090 -3.185 0.002 SAR(2) -0.614 0.146 -4.208 <0.001  下载: 导出CSV
表 2 ARIMA模型的拟合效果
Table 2. The fitting effects of the ARIMA models
ARIMA模型 R2值 AIC ARIMA模型 R2值 AIC (0, 1, 1)(0, 1, 0)12 0.614 -1.866 (2, 1, 1)(1, 1, 0)12 0.819 -2.504 (1, 1, 1)(0, 1, 0)12 0.656 -1.990 (3, 1, 1)(1, 1, 0)12 0.819 -2.487 (2, 1, 1)(0, 1, 0)12 0.685 -2.052 (0, 1, 1)(2, 1, 0)12 0.772 -2.285 (3, 1, 1)(0, 1, 0)12 0.693 -2.058 (1, 1, 1)(2, 1, 0)12 0.798 -2.399 (0, 1, 1)(1, 1, 0)12 0.768 -2.274 (2, 1, 1)(2, 1, 0)12 0.829 -2.531 (1, 1, 1)(1, 1, 0)12 0.790 -2.388 (3, 1, 1)(2, 1, 0)12 0.829 -2.511
下载: 导出CSV
表 3 ARIMA模型的拟合效果
Table 3. The fitting effects of the ARIMA models
模型 拟合集 预测集 MAD RMSE MAPE(%) MAD RMSE MAPE(%) ARIMA 0.013 0.015 4.266 0.064 0.069 23.310 NAR 0.011 0.018 3.810 0.049 0.068 17.629 LSTM 0.002 0.003 0.692 0.044 0.060 18.575
下载: 导出CSV
表 4 ARIMA、NAR和LSTM模型的预测效果对比
Table 4. Comparison of the prediction effects of the ARIMA, NAR and LSTM models
月份 发病率 ARIMA模型 NAR模型 LSTM模型 预测值 相对误差率 预测值 相对误差率 预测值 相对误差率 2020年1月 0.283 0.349 0.232 0.352 0.243 0.335 0.184 2020年2月 0.153 0.264 0.727 0.225 0.470 0.320 1.090 2020年3月 0.293 0.402 0.371 0.472 0.609 0.307 0.047 2020年4月 0.333 0.379 0.137 0.351 0.055 0.279 0.163 2020年5月 0.333 0.403 0.210 0.364 0.093 0.316 0.050 2020年6月 0.331 0.371 0.120 0.312 0.057 0.358 0.080 2020年7月 0.358 0.411 0.148 0.451 0.260 0.355 0.008 2020年8月 0.333 0.410 0.231 0.298 0.105 0.348 0.044 2020年9月 0.348 0.389 0.119 0.364 0.046 0.371 0.067 2020年10月 0.315 0.377 0.195 0.354 0.123 0.366 0.161 2020年11月 0.321 0.381 0.186 0.335 0.044 0.377 0.174 2020年12月 0.317 0.355 0.121 0.320 0.011 0.367 0.160
下载: 导出CSV
-
[1] 国家卫生健康委员会. 中华人民共和国卫生行业标准WS273-2018梅毒诊断标准(2018)[EB/OL]. (2018-03-06) [2020-07-31]. http://www.nhc.gov.cn/wjw/s9491/201803/5103a5425f9e47d29b91de38434b7f74.shtml.National Health Commission. The People's Republic of China Health Industry Standard WS 273-2018 Syphilis Diagnostic Standard (2018) [EB/OL]. (2018-03-06) [2020-07-31]. http://www.nhc.gov.cn/wjw/s9491/201803/5103a5425f9e47d29b91de38434b7f74.shtml. [2] 胡冰雪, 曲波, 刘洁, 等. 中国1990-2011年梅毒流行特征分析与趋势预测[J]. 现代预防医学, 2014, 41(6): 961-963, 971. https://www.cnki.com.cn/Article/CJFDTOTAL-XDYF201406001.htmHu BX, Qu B, Liu J, et al. Epidemiological characteristics and trend prediction of syphilis in China from 1990 to 2011 [J]. Modern Prevent Med, 2014, 41(6): 961-963, 971. https://www.cnki.com.cn/Article/CJFDTOTAL-XDYF201406001.htm [3] 关鹏, 曹爽, 黄德生, 等. 2005-2011年中国大陆地区梅毒疫情时空分布[J]. 中国感染控制杂志, 2014, 13(5): 257-262. DOI: 10.3969/j.issn.1671-9638.2014.05.001.Guan P, Cao S, Huang DS, et al. Spatio-temporal distribution characteristics of syphilis in Mainland China, 2005-2011 [J]. Chin J Infect Control, 2014, 13(5): 257-262. DOI: 10.3969/j.issn.1671-9638.2014.05.001. [4] 王平. 三种预测模型在主要传染病发病率预测中的应用[D]. 杭州: 浙江大学, 2010.Wang P. Application of three prediction models in forecasting the incidence of major infectious diseases [D]. Hangzhou: Zhejiang University, 2010. [5] 包娅薇, 邵明, 陈雨婷, 等. 自回归求和滑动平均(ARIMA)模型在全球新型冠状病毒肺炎发病人数预测中的应用[J]. 中华疾病控制杂志, 2020, 24(5): 543-548. DOI: 10.16462/j.cnki.zhjbkz.2020.05.010.Bao YW, Shao M, Chen YT, et al. Application of autoregressive integrated moving average (ARIMA) model in global prediction of COVID-19 incidence [J]. Chin J Dis Control Prev, 2020, 24(5): 543-548. DOI: 10.16462/j.cnki.zhjbkz.2020.05.010. [6] Wang K, Deng C, Li J, et al. Hybrid methodology for tuberculosis incidence time-series forecasting based on ARIMA and a NAR neural network [J]. Epidemiol Infect, 2017, 145(6): 1118-1129. DOI: 10.1017/S0950268816003216. [7] 高秋菊, 周宇畅, 赵树青, 等. ARIMA乘积季节模型和LSTM深度神经网络对石家庄市手足口病疫情预测效果的比较[J]. 中华疾病控制杂志, 2020, 24(1): 73-78. DOI: 10.16462/j.cnki.zhjbkz.2020.01.015.Gao QJ, Zhou YC, Zhao SQ, et al. Comparison on predictive capacity of ARIMA model and LSTM model for incidence of hand, foot and mouth disease in Shijiazhuang [J]. Chin J Dis Control Prev, 2020, 24(1): 73-78. DOI: 10.16462/j.cnki.zhjbkz.2020.01.015. [8] Wang H, Tian CW, Wang WM, et al. Time-series analysis of tuberculosis from 2005 to 2017 in China [J]. Epidemiol Infect, 2018, 146(8): 935-939. DOI: 10.1017/S0950268818001115. [9] Zhu XL, Fu BF, Yang YD, et al. Attention-based recurrent neural network for influenza epidemic prediction [J]. BMC bioinformatics, 2019, 20(18): 575. DOI: 10.1186/s12859-019-3131-8. [10] Kafieh R, Arian R, Saeedizadeh N, et al. COVID-19 in Iran: forecasting pandemic using deep learning [J]. Comput Math Methods Med, 2021, 2021(5): 6927985. DOI: 10.1155/2021/6927985. [11] 刘刚, 唐宋, 孙文杰. 时间序列分析法在香港结核病预测中的应用[J]. 中国卫生统计, 2012, 29(2): 226-228. DOI: 10.3969/j.issn.1002-3674.2012.02.021.Liu G, Tang S, Sun WJ. Application of time series analysis in tuberculosis prediction in Hong Kong [J]. Chin J Health Statistics, 2012, 29(2): 226-228. DOI: 10.3969/j.issn.1002-3674.2012.02.021. [12] Cheng YJ, Norris J, Bao CJ, et al. Geographical information systems-based spatial analysis and implications for syphilis interventions in Jiangsu province, People's republic of China [J]. Geospat Health, 2012, 7(1): 63-72. DOI: 10.4081/gh.2012.105. [13] Zhang WJ, Du ZC, Tang SK, et al. Syphilis in the economic center of South China: results from a real-time, web-based surveillance program [J]. BMC Infect Dis, 2015, 15(1): 318. DOI: 10.1186/s12879-015-1072-z. [14] 杨振, 王念, 王宇. 中国性病疫情的时空差异与经济驱动机制-以淋病、梅毒为例[J]. 热带地理, 2016, 36(5): 761-766. DOI: 10.13284/j.cnki.rddl.002879.Yang Z, Wang N, Wang Y, et al. Spatial and temporal differences and economic driving mechanisms of STD epidemics in China: a case study of gonorrhea and syphilis [J]. Tropical Geography, 2016, 36(5): 761-766. DOI: 10.13284/j.cnki.rddl.002879. [15] 陈祥生. 我国梅毒防治面临的挑战和对策[J]. 国际流行病学传染病学杂志, 2020, 47(4): 289-292. DOI: 10.3760/cma.j.cn331340-20200709-00223.Chen XS. Responses to challenges in prevention and control of syphilis in China [J]. Inter J Epidemiol Infect Dis, 2020, 47(4): 289-292. DOI: 10.3760/cma.j.cn331340-20200709-00223. [16] 吴伟, 安淑一, 郭军巧, 等. 非线性自回归神经网络在肾综合征出血热流行趋势预测中的应用[J]. 中华流行病学杂志, 2015, 36(12): 1394-1396. DOI: 10.3760/cma.j.issn.0254-6450.2015.12.017.Wu W, An SY, Guo JQ, et al. Application of nonlinear autoregressive neural network in predicting incidence tendency of hemorrhagic fever with renal syndrome [J]. Chin J Epidemiol, 2015, 36(12): 1394-1396. DOI: 10.3760/cma.j.issn.0254-6450.2015.12.017. [17] Zhang R, Guo Z, Meng YJ, et al. Comparison of ARIMA and LSTM in Forecasting the Incidence of HFMD combined and uncombined with exogenous meteorological variables in ningbo, China [J]. Int J Environ Res Public Health, 2021, 18(11): 6174. DOI: 10.3390/ijerph18116174. [18] 付之鸥, 周扬, 陈诚, 等. 时间序列分析与机器学习方法在预测肺结核发病趋势中的应用[J]. 中国卫生统计, 2020, 37(2): 190-195. https://www.cnki.com.cn/Article/CJFDTOTAL-ZGWT202002008.htmFu ZO, Zhou Y, Chen C, et al. Application of Time Series Analysis and Machine Learning Methods in Predicting the Incidence of Tuberculosis [J]. Chin J Health Statistics, 2020, 37(2): 190-195. https://www.cnki.com.cn/Article/CJFDTOTAL-ZGWT202002008.htm [19] Blake LeBaron. Non-Linear time series models in empirical finance [J]. International Journal of Forecasting, 2003, 19(4): 751-752. DOI: 10.1016/S0169-2070(03)00054-2. [20] Dogan E. Analysis and comparison of long short-term memory networks short-term traffic prediction performance [J]. Scientific Journal of Silesian University of Technology-Series Transport, 2020, 107(5): 19-32. DOI: 10.20858/sjsutst.2020.107.2. -

 点击查看大图
计量
- 文章访问数: 541
- HTML全文浏览量: 312
- PDF下载量: 117
- 被引次数: 0