

Analysis of characteristics of injury-induced death and life loss among Shenzhen residents, 2017-2020
-
摘要:
目的 分析2017—2020年深圳市居民的主要伤害死亡特征及减寿情况, 为制定伤害预防控制策略和措施提供科学依据。 方法 使用构成比、死亡率、标化死亡率、潜在减寿年数(potential years of life lost, PYLL)、减寿率(potential years of life lost rate, PYLLR)、平均减寿年数(average years of life lost, AYLL)等指标评估伤害死亡特征及减寿情况。同时应用Joinpoint回归对主要伤害死因的年龄别死亡率进行分析比较。 结果 2017—2020年深圳市居民的伤害死亡例数为7 199, 年均粗死亡率为12.73/10万, 年均标化死亡率为20.70/10万, 男性高于女性。伤害死因及伤害所致PYLL前三位均为自杀、交通事故和意外跌落。全人群全部伤害死因年龄别死亡率的整体变化为平均每岁上升4.9%(t=5.2, P < 0.001), 自杀死亡率为平均每岁上升3.1%(t=3.8, P < 0.001), 交通事故死亡率为平均每岁上升2.7%(t=2.8, P=0.005), 意外跌落死亡率为平均每岁上升6.1%(t=6.8, P < 0.001), 男、女死亡率转折点不同, 且死亡率曲线不平行, 变化趋势不一样。4年间伤害所造成的PYLL合计为269 093.5人年, AYLL为37.38年/人, PYLLR为4.76‰。 结论 自杀是深圳市居民首要伤害死因, 男、女各伤害死因死亡率呈现不同的年龄变化趋势, 需根据重点人群采取针对性的措施。伤害导致严重的寿命损失, 给家庭和社会带来重大影响, 社会各界需加强对伤害的预防, 减少伤害尤其是致死性伤害的发生。 Abstract:Objective To analyze characteristics of the main injury-induced death and life loss among Shenzhen residents during 2017-2020 and provide a scientific basis for the targeted formulation of strategies and measures for injury prevention and control. Methods Injury-induced death characteristics and life loss were assessed using composition ratio, mortality rate, standardized mortality rate, potential years of life lost (PYLL), potential years of life lost rate (PYLLR), and average years of life lost (AYLL). Joinpoint regression was also applied to compare the age-specific mortality rates of significant injury death causes in different years and genders. Results The number of injury-induced deaths among Shenzhen residents in 2017-2020 was 7 199, with an average annual crude mortality rate of 12.73/100 000 and an average annual standardized mortality rate of 20.70/100 000, the mortality rate of males was higher than females. The top three causes of injury-induced death and injury-induced PYLL were suicide, traffic accident and accidental fall. The overall change in the age-specific mortality rate of all injury-induced in the whole population was a mean increase of 4.9% per year (t=5.2, P < 0.001);the overall suicide mortality rate was a mean increase of 3.1% per year (t=3.8, P < 0.001);the overall change of mortality rates for traffic accidents was a mean increase of 2.7% per year (t=2.8, P=0.005);the overall change in mortality rates for falls was a mean increase of 6.1% per year (t=6.8, P< 0.001). The mortality turning points of males and females were different, the mortality curves were not parallel, and the trends were not the same. The total PYLL caused by injuries during the 4-year period was 269 093.5 person-years, the AYLL was 37.38 years/person, and the PYLLR was 4.76 per 1 000. Conclusion Suicide is the primary cause of injury-induced death among Shenzhen residents, and the mortality rates of each cause of injury-induced death for men and women show different age trends. Targeted measures should be taken according to critical populations. Injuries lead to serious life loss and have a significant impact on families and society. All sectors of society need to strengthen the prevention of injuries and reduce the occurrence of injuries, especially fatal injuries. -
Key words:
- Injury /
- Mortality /
- Rank of death causes /
- Potential years of life lost
-

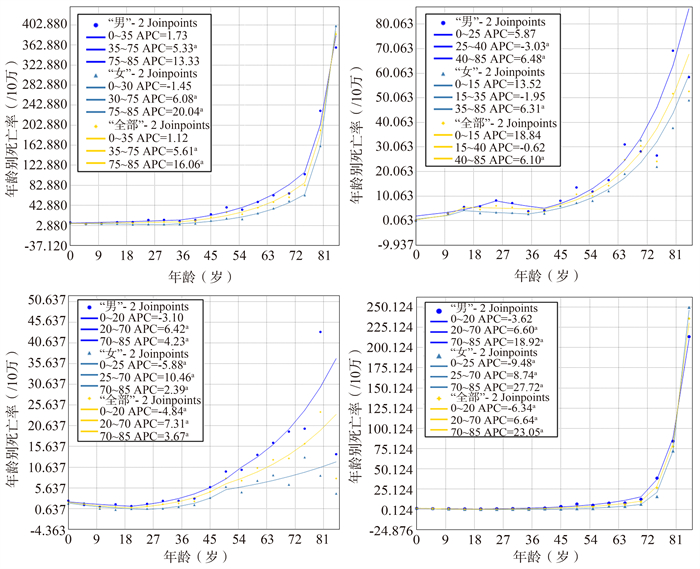
图 1 2017—2020年不同伤害死因的年龄别死亡率的Joinpoint线性转折点
注:a表示P < 0.05。
Figure 1. Joinpoint linear regression analysis on age-specific mortality rate for different injuries, 2017-2020 Bioinformatics analysis of significant differential methylation sites and genes
表 1 2017—2020年深圳市居民伤害死亡情况
Table 1. Injury deaths of Shenzhen residents, 2017-2020
年份
(年)男性 女性 全人群 死亡人数 粗死亡率
(/10万)标化死亡率
(/10万)死亡人数 粗死亡率
(/10万)标化死亡率
(/10万)死亡人数 粗死亡率
(/10万)标化死亡率
(/10万)2017 1 198 17.64 32.94 534 9.31 20.68 1 732 13.82 27.19 2018 1 396 19.77 34.39 620 10.39 22.73 2 016 15.48 29.07 2019 1 263 17.34 31.63 617 10.02 22.31 1 880 13.99 27.33 2020 1 049 10.85 13.74 522 6.61 9.97 1 571 8.95 12.03 APC值 -14.3 -24.2 -9.9 -20.5 -12.8 -22.8 t值 -1.6 -1.9 -1.2 -1.5 -1.5 -1.7 P值 0.247 0.199 0.356 0.274 0.274 0.225  下载: 导出CSV
表 2 2017—2020年深圳市居民伤害分病种死亡情况[n(%)]
Table 2. Injury deaths of Shenzhen residents by disease type, 2017-2020 [n(%)]
伤害类别 男性 女性 全人群 死亡人数 构成比
(%)死因顺位 死亡人数 构成比
(%)死因顺位 死亡人数 构成比
(%)死因顺位 自杀 2 077 42.34 1 1 085 47.32 1 3 162 43.92 1 交通事故 996 20.30 2 411 17.92 2 1 407 19.54 2 意外跌落 671 13.68 3 327 14.26 3 998 13.86 3 其他损伤中毒 350 7.13 4 160 6.98 4 510 7.08 4 意外中毒 237 4.83 5 41 1.79 8 278 3.86 5 被杀 133 2.71 8 125 5.45 5 258 3.58 6 淹死 152 3.10 6 42 1.83 7 194 2.69 7 触电 145 2.96 7 49 2.14 6 194 2.69 7 意外窒息 60 1.22 9 23 1.00 9 83 1.15 9 辗死 43 0.88 10 10 0.44 11 53 0.74 10 火灾 21 0.43 11 14 0.61 10 35 0.49 11 机器意外事故 21 0.43 11 6 0.26 12 27 0.38 12
下载: 导出CSV
表 3 2017—2020年深圳市居民伤害死亡减寿分析
Table 3. Analysis of injury-induced death and life loss of Shenzhen residents, 2017-2020
变量 男性 女性 全人群 死亡人数 PYLL
(人年)AYLL
(年/人)PYLLR
(‰)死亡人数 PYLL
(人年)AYLL
(年/人)PYLLR
(‰)死亡人数 PYLL
(人年)AYLL
(年/人)PYLLR
(‰)2017年 自杀 408 16 944.0 41.53 2.50 206 7 602.0 36.90 1.32 614 24 546.0 39.98 1.96 交通事故 310 11 245.0 36.27 1.66 126 4 905.0 38.93 0.85 436 16 150.0 37.04 1.29 意外跌落 191 5 735.5 30.03 0.84 82 930.0 11.34 0.16 273 6 665.5 24.42 0.53 全部伤害 1 198 45 779.0 38.21 6.74 534 18 259.0 34.19 3.18 1 732 64 038.0 36.97 5.11 2018年 自杀 551 22 925.5 41.61 3.25 275 10 837.5 39.41 1.82 826 33 763.0 40.88 2.59 交通事故 310 11 846.0 38.21 1.68 110 4 015.0 36.50 0.67 420 15 861.0 37.76 1.22 意外跌落 206 6 067.0 29.45 0.86 91 1 158.5 12.73 0.19 297 7 225.5 24.33 0.55 全部伤害 1 396 54 644.0 39.14 7.74 620 21 249.0 34.27 3.56 2 016 75 893.0 37.65 5.83 2019年 自杀 565 23 008.5 40.72 3.16 323 12 039.5 37.27 1.96 888 35 048.0 39.47 2.61 交通事故 231 8 590.5 37.19 1.18 95 3 243.5 34.14 0.53 326 11 834.0 36.30 0.88 意外跌落 159 4 454.5 28.02 0.61 88 1 756.0 19.95 0.29 247 6 210.5 25.14 0.46 全部伤害 1 263 48 648.5 38.52 6.68 617 20 977.5 34.00 3.41 1 880 69 626.0 37.04 5.18 2020年 自杀 553 23 127.5 41.82 2.39 281 10 532.5 37.48 1.33 834 33 660.0 40.36 1.92 交通事故 145 5 429.5 37.44 0.56 80 2 766.0 34.58 0.35 225 8 195.5 36.42 0.47 意外跌落 115 3 541.5 30.80 0.37 66 1 134.0 17.18 0.14 181 4 675.5 25.83 0.27 全部伤害 1 049 41 458.5 39.52 4.29 522 18 078.0 34.63 2.29 1 571 59 536.5 37.90 3.39 合计 自杀 2 077 86 005.5 41.41 2.79 1 085 41 011.5 37.80 1.59 3 162 127 017.0 40.17 2.25 交通事故 996 37 111.0 37.26 1.20 411 14 929.5 36.32 0.58 1 407 52 040.5 36.99 0.92 意外跌落 671 19 798.5 29.51 0.64 327 4 978.5 15.22 0.19 998 24 777.0 24.83 0.44 全部伤害 4 906 190 530.0 38.84 6.19 2 293 78 563.5 34.26 3.05 7 199 269 093.5 37.38 4.76
下载: 导出CSV
-
[1] 谢俊卿, 王佳佳, 信振江, 等. 2006-2015年北京市丰台区老年人伤害死亡特征分析及潜在减寿年数研究[J]. 实用预防医学, 2020, 27(3): 11-14. DOI: 10.3969/j.issn.1006-3110.2020.03.002.Xie JQ, Wang JJ, Xin ZJ, et al. Characteristics of elderly injury deaths and their potential years of life lost in Fengtai district of Beijing, 2006-2015 [J]. Pract Prev Med, 2020, 27(3): 11-14. DOI: 10.3969/j.issn.1006-3110.2020.03.002. [2] WHO. Injuries and violence [EB/OL]. (2021-03-19)[2021-08-25]. https://www.who.int/news-room/fact-sheets/detail/injuries-and-violence. [3] Olaisen RH, Rossen LM, Warner M, et al. Unintentional injury death rates in rural and urban areas: United States, 1999-2017 [J]. NCHS Data Brief, 2019, 343: 1-8. [4] Yao X, Skinner R, McFaull S, Thompson W. At-a-glance-2015 injury deaths in Canada [J]. Health Promot Chronic Dis Prev Can, 2019, 39(6-7): 225-231. DOI: 10.24095/hpcdp.39.6/7.03. [5] 邹亚明, 郝元涛. 我国伤害所致死亡损失生命年和经济负担分析[J]. 中华疾病控制杂志, 2016, 20(5): 495-499. DOI: 10.16462/j.cnki.zhjbkz.2016.05.016.Zou YM, Hao YT. Analysis on years of life lost and economic burden caused by injury in China [J]. Chin J Dis Control Prev, 2016, 20(5): 495-499. DOI: 10.16462/j.cnki.zhjbkz.2016.05.016. [6] 马晓曼, 谢俊卿, 王琳, 等. 北京市丰台区恶性肿瘤死亡年龄变化趋势Joinpoint回归分析[J]. 中华肿瘤防治杂志, 2019, 26(3): 137-141. DOI: 10.16073/j.cnki.cjcpt.2019.03.001.Ma XM, Xie JQ, Wang L, et al. Joinpoint regression analysis of age change trend of malignant tumor in Fengtai District, Beijing[J]. Chin J Cancer Prev Treat, 2019, 26(3): 137-141. DOI: 10.16073/j.cnki.cjcpt.2019.03.001. [7] 秦秋兰, 毛玮, 孟军. 2014-2016年广西伤害死亡状况及潜在寿命损失分析[J]. 中华疾病控制杂志, 2019, 23(10): 1246-1249. DOI: 10.16462/j.cnki.zhjbkz.2019.10.017.Qin QL, Mao W, Meng J. Analysis on status and disease burden of injury deaths in Guangxi from 2014 to 2016[J]. Chin J Dis Control Prev, 2019, 23(10): 1246-1249. DOI: 10.16462/j.cnki.zhjbkz.2019.10.017. [8] 邱琳, 飒日娜, 王维华, 等. 2015-2017年陕西省居民伤害死亡现状与潜在损失分析[J]. 中华疾病控制杂志, 2019, 23(4): 452-458. DOI: 10.16462/j.cnki.zhjbkz.2019.04.017.Qiu L, Za RN, Wang WH, et al. Status of injury death and potential losses analysis in Shanxi Province, 2015-2017[J]. Chin J Dis Control Prev, 2019, 23(4): 452-458. DOI: 10.16462/j.cnki.zhjbkz.2019.04.017. [9] 唐冬纯, 刘晓剑, 付英斌, 等. 深圳市居民1994-2013年伤害死因监测分析[J]. 伤害医学(电子版), 2019, 8(4): 7-13. DOI: 10.3868/j.issn.2095-1566.2019.04.002.Tang DC, Liu XJ, Fu YB, et al. Analysis on Injury-related Deaths in Shenzhen Residents during 1994-2013[J]. Injury Medicine(Electronic Edition), 2019, 8(4): 7-13. DOI: 10.3868/j.issn.2095-1566.2019.04.002. [10] 韩凌, 吴永胜, 卫兰, 等. 深圳市居民2013-2017年伤害死亡分析[J]. 伤害医学(电子版), 2019, 8(2): 29-33. DOI: 10.3868/j.issn.2095-1566.2019.02.007.Han L, Wu YS, Wei L, et al. Injury-induced Deaths among Residents in Shenzhen, 2013-2017[J]. Injury Medicine (Electronic Edition), 2019, 8(2): 29-33. DOI: 10.3868/j.issn.2095-1566.2019.02.007. [11] 郭洪菊, 王娟, 聂伊婧. 2017-2018年绵阳市伤害死亡特征及疾病负担分析[J]. 中国慢性病预防与控制, 2020, 28(9): 669-672. DOI: 10.16386/j.cjpccd.issn.1004-6194.2020.09.007.Guo HJ, Wang J, Nie YJ. Analysis of injury death characteristics and disease burden in Mianyang city from 2017 to 2018[J]. Chin J Prev Contr Chron Dis, 2020, 28(9): 669-672. DOI: 10.16386/j.cjpccd.issn.1004-6194.2020.09.007. [12] WHO. Integrated care for older people (ICOPE): guidelines on community-level interventions to manage declines in intrinsic capacity: evidence profile: risk of falls[EB/OL]. [2017-06-04] [2021-03-10]. https://apps.who.int/iris/handle/10665/342248. [13] Sung KC, Liang FW, Cheng TJ, et al. Trends in Unintentional Fall-Related Traumatic Brain Injury Death Rates in Older Adults in the United States, 1980-2010: A Joinpoint Analysis[J]. J Neurotrauma, 2015, 32(14): 1078-1082. DOI: 10.1089/neu.2014.3509. [14] 马丽, 王小丽. 2012-2019年上海市某社区60岁以上老年人口主要死因及减寿分析[J]. 公共卫生与预防医学, 2020, 31(4): 81-84. DOI: 10.3969/j.issn.1006-2483.2020.04.020.Ma L, Wang XL. Analysis of the main causes of death and life loss of elderly people over 60 years old in a community in Shanghai, 2012-2019[J]. J of Pub Health and Prev Med, 2020, 31(4): 81-84. DOI: 10.3969/j.issn.1006-2483.2020.04.020. -

 点击查看大图
计量
- 文章访问数: 470
- HTML全文浏览量: 279
- PDF下载量: 69
- 被引次数: 0