

Analysis and prediction of the trends of esophageal cancer mortality attributable to low fruit intake in China from 1990 to 2019
-
摘要:
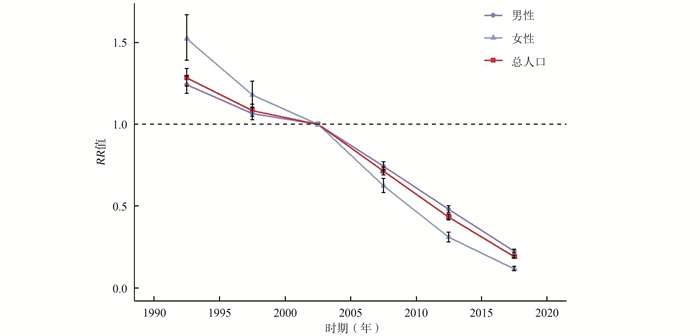
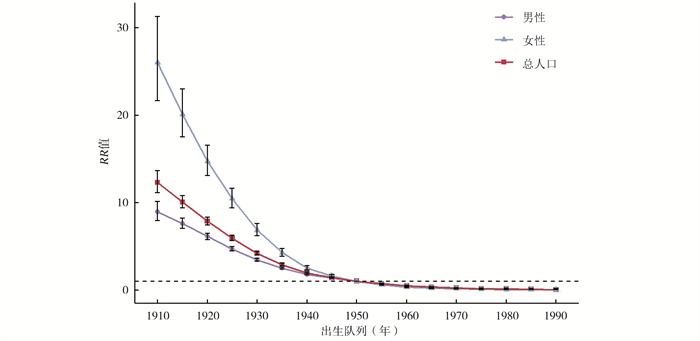
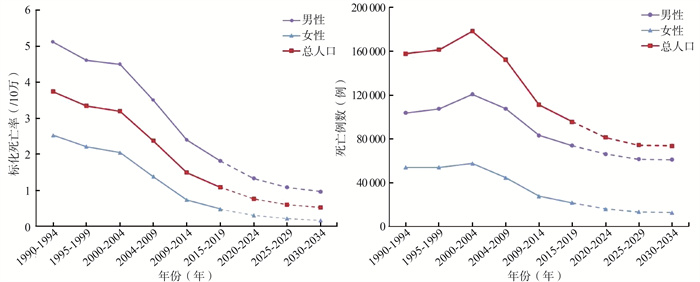
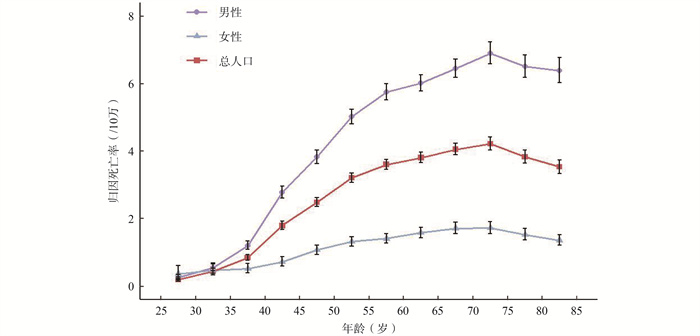
目的 分析1990-2019年中国归因于水果摄入不足的食管癌死亡率的长期趋势,并预测2020-2034年的变化,为中国食管癌的防控提供科学建议。 方法 从2019年全球疾病负担(Global Burden of Disease 2019, GBD 2019)获取1990-2019年中国归因于水果摄入不足的死亡负担数据,运用Joinpoint回归模型分析其死亡率的变化趋势,并使用年龄-时期-队列(age-period-cohort, APC)模型评估年龄、时期、队列效应。采用R软件Nordpred包对2020-2034年的死亡情况进行预测。 结果 1990-2019年中国归因于水果摄入不足的食管癌标化死亡率整体呈现下降趋势,总人口从3.86/10万降至1.02/10万、男性从5.27/10万降至1.72/10万、女性从2.61/10万降至0.44/10万,平均年度变化百分比(average annual percentage change, AAPC)分别为总人口-4.54%、男性-3.83%、女性-5.94%。APC模型分析显示,1990-2019年中国归因于水果摄入不足的食管癌纵向年龄死亡率随年龄增加呈现先上升后下降的趋势,整体呈上升趋势,总人口从0.20/10万增至3.54/10万、男性从0.26/10万增至6.40/10万、女性从0.37/10万增至1.36/10万;随着时期的推移死亡风险减小,总人口RR值从1.28降至0.19、男性RR值从1.24降至0.22、女性RR值从1.52降至0.11;越晚出生的队列其死亡风险越小,总人口RR值从12.31降至0.04、男性RR值从8.96降至0.05、女性RR值从26.04降至0.01。预计2020-2034年,死亡人数降至73 897例,死亡率降至0.52/10万。 结论 相应防控策略对1990-2019年中国归因于水果摄入不足的食管癌防制有效,须重点加强缺乏水果摄入的50岁以上男性人群的相关疾病防控和体检筛查,科学指导居民摄入水果。 Abstract:Objective To analyze the long-term trends in esophageal cancer attributable to low fruit intake in China from 1990 to 2019, and to predict the changes from 2020 to 2034, so as to provide scientific suggestions for esophageal cancer prevention and control in China. Methods Data on mortality burden of esophageal cancer attributable to low fruit intake in China from 1990 to 2019 were extracted from the Global Burden of Disease Study 2019 (GBD2019). Joinpoint regression model was used to analyze the trend of esophageal cancer mortality. Age, period, birth cohort effects were evaluated using age-period-cohort (APC) models. Deaths from 2020 to 2034 were predicted using the R software Nordpred package. Results The age-standardized mortality rates showed an overall downward trend for esophageal cancer attributable to low fruit intake from 1990 to 2019 in China, decreased from 3.86/105 to 1.02/105 in total population, from 5.27/105 to 1.72/105 in male, and from 2.61/105 to 0.44/105 in female, with the average annual percentage change (AAPC) of both -4.54%, male -3.83%, female -5.94%, respectively. The analysis of APC model showed that the longitudinal mortality rates of esophageal cancer attributable to low fruit intake showed an upward trend first and then a downward trend with age, and the overall trend was upward, the mortality increased from 0.20/105 to 3.54/105 in total population, from 0.26/105 to 6.40/105 in male, and from 0.37/105 to 1.36/105 in female. Risk of death decreased over time. The RR decreased from 1.28 to 0.19 in total population, from 1.24 to 0.22 in male, from 1.52 to 0.11 in female. Cohorts born later had lower mortality risk. The RR decreased from12.31 to 0.04 in total population, from 8.96 to 0.05 in male, and from 26.04 to 0.01 in female. From 2020 to 2034, the number of deaths will fall to 73 897 and mortality rate to 0.52/105. Conclusions The corresponding prevention and control strategies are effective for esophageal cancer attributable to low fruit intake in China from 1990 to 2019. At the same time, it is necessary to strengthen the related disease and physical examination of men over the age of 50 and scientifically guide the fruit intake of residents. -
Key words:
- Esophageal cancer /
- Low fruit intake /
- Mortality /
- Trend analysis /
- Prediction
-

图 1 中国归因于水果摄入不足的食管癌死亡率的纵向年龄曲线
Figure 1. Longitudinal age curves of low fruit intake-attributable esophageal cancer mortality in China

图 2 中国归因于水果摄入不足的食管癌死亡率时期效应
Figure 2. Period effects of low in fruit intake-attributable esophageal cancer mortality in China

图 3 中国归因于水果摄入不足的食管癌死亡率的队列效应
Figure 3. Cohort effects of low fruit intake-attributable esophageal cancer mortality in China

图 4 预测2020-2034年中国归因于水果摄入不足的食管癌死亡趋势
Figure 4. Prediction of the trends of esophageal cancer mortality attributable to low fruit intake in China from 2020 to 2034
表 1 1990年和2019年中国归因水果摄入不足的食管癌死亡负担及变化情况
Table 1. The mortality burden and changes of low in fruit intake-attributable esophageal cancer in China in 1990 and 2019
组别 死亡人数(104,95% CI值) 死亡率(/10万,95% CI值) 标化死亡率(/10万,95% CI值) 1990年 2019年 变化率(%) 1990年 2019年 变化率(%) 1990年 2019年 变化率(%) 总人口 3.09(0.97~5.56) 1.95(0.33~5.19) -36.89 2.61(0.82~4.69) 1.37(0.23~3.65) -47.51 3.86(1.22~6.92) 1.02(0.18~2.68) -73.58 男性 2.03(0.60~3.70) 1.52(0.24~4.03) -25.12 3.33(0.98~6.06) 2.09(0.33~5.55) -37.24 5.27(1.63~9.55) 1.72(0.29~4.57) -67.36 女性 1.06(0.33~1.96) 0.44(0.06~1.16) -58.49 1.85(0.58~3.42) 0.63(0.09~1.66) -65.95 2.61(0.83~4.83) 0.44(0.07~1.16) -83.14 注:变化率=(2019年指标值-1990年指标值)/1990年指标值×100%。  下载: 导出CSV
表 2 1990-2019年中国归因于水果摄入不足的食管癌死亡率的Joinpoint分析结果
Table 2. Joinpoint analysis results of low in fruit intake-attributable esophageal cancer mortality in China from 1990 to 2019
组别 总人口 男性 女性 年份(年) APC(%,95% CI)值 年份(年) APC(%,95% CI)值 年份(年) APC(%,95% CI)值 趋势1 1990-1998 -2.16(-2.38~-1.94) a 1990-1998 -2.06(-2.28~-1.84) a 1990-1993 -1.43(-2.07~-0.78) a 趋势2 1998-2004 -0.73(-1.26~-0.21) a 1998-2001 0.34(-1.90~2.63) 1993-1998 -3.06(-3.48~-2.64) a 趋势3 2004-2013 -9.08(-9.36~-8.80) a 2001-2004 -1.12(-3.51~1.34) 1998-2004 -1.19(-1.52~-0.86) a 趋势4 2013-2016 -6.33(-3.27~-9.30) a 2004-2014 -7.43(-7.66~-7.19) a 2004-2013 -11.91(-12.08~-11.73) a 趋势5 2016-2019 -2.45(-4.02~-0.85) a 2014-2017 -4.46(-7.40~-1.43) a 2013-2016 -8.46(-10.33~-6.55) a 趋势6 2017-2019 -1.67(-4.79~-1.55) 2016-2019 -3.23(-4.26~-2.20) a AAPC值 1990-2019 -4.54(-4.89~-4.18) a 1990-2019 -3.83(-4.29~-3.36) a 1990-2019 -5.94(-6.17~-5.70) a 注:a P < 0.05。
下载: 导出CSV
表 3 APC模型中可估计函数的Wald χ2检验
Table 3. Wald Chi-Square tests for estimable functions in the APC model
零假设 总人口 男性 女性 χ2值 P值 χ2值 P值 χ2值 P值 净漂移=0 939.90 < 0.001 827.86 < 0.001 452.38 < 0.001 全时期RR=1 1 280.24 < 0.001 1 125.86 < 0.001 615.63 < 0.001 全队列RR=1 4 400.18 < 0.001 3 685.07 < 0.001 2 340.58 < 0.001 所有局部漂移=净漂移 155.87 < 0.001 155.95 < 0.001 115.69 < 0.001
下载: 导出CSV
-
[1] Sung H, Ferlay J, Siegel RL, et al. Global cancer statistics 2020: GLOBOCAN estimates of incidence and mortality worldwide for 36 cancers in 185 countries[J]. CA Cancer J Clin, 2021, 71(3): 209-249. DOI: 10.3322/caac.21660. [2] Kamangar F, Nasrollahzadeh D, Safiri S, et al. The global, regional, and national burden of oesophageal cancer and its attributable risk factors in 195 countries and territories, 1990-2017: a systematic analysis for the Global Burden of Disease Study 2017[J]. Lancet Gastroenterology Hepatology, 2020, 5(6): 582-597. DOI: 10.1016/S2468-1253(20)30007-8. [3] GBD 2019 Risk Factor Collaborators. Global burden of 87 risk factors in 204 countries and territories, 1990-2019: a systematic analysis for the Global Burden of Disease Study 2019[J]. Lancet, 2020, 396(10258): 1223-1249. DOI: 10.1016/S0140-6736(20)30752-2. [4] Liu RH. Health-promoting components of fruits and vegetables in the diet[J]. Adv Nutr, 2013, 4(3): 384S-392S. DOI: 10.3945/an.112.003517. [5] Yip CSC, Chan W, Fielding R. The associations of fruit and vegetable intakes with burden of diseases: a systematic review of meta-analyses[J]. J Acad Nutr Diet, 2019, 119(3): 464-481. DOI: 10.1016/j.jand.2018.11.007. [6] 王崇民. 《中国居民膳食指南科学研究报告(2021)》正式发布[J]. 食品安全导刊, 2021, (7): 15. DOI: 10.16043/j.cnki.cfs.2021.07.004.Wang CM. The scientific research report on dietary guidelines for Chinese residents (2021) was officially released[J]. China Food Safety, 2021, (7): 15. DOI: 10.16043/j.cnki.cfs.2021.07.004. [7] Roth GA, Abate D, Abate KH, et al. Global, regional, and national age-sex-specific mortality for 282 causes of death in 195 countries and territories, 1980-2017: a systematic analysis for the global burden of disease study 2017[J]. Lancet, 2018, 392(10159): 1736-1788. DOI: 10.1016/s0140-6736(18)32203-7. [8] GBD 2017 Risk Factor Collaborators. Global, regional, and national comparative risk assessment of 84 behavioural, environmental and occupational, and metabolic risks or clusters of risks for 195 countries and territories, 1990-2017: a systematic analysis for the global burden of disease study 2017[J]. Lancet, 2018, 392(10159): 1923-1994. DOI: 10.1016/S0140-6736(18)32225-6. [9] Dai HJ, Alsalhe TA, Chalghaf N, et al. The global burden of disease attributable to high body mass index in 195 countries and territories, 1990-2017: an analysis for the global burden of disease study[J]. PLoS Med, 2020, 17(7): e1003198. DOI: 10.1371/journal.pmd.1003198. [10] Kim HJ, Fay MP, Feuer EJ, et al. Permutation tests for joinpoint regression with applications to cancer rates[J]. Stat Med, 2000, 19(3): 335-351. DOI: 10.1002/(sici)1097-0258(20000215)19:3<335::aid-sim336>3.0.co;2-z. [11] Rosenberg PS, Check DP, Anderson WF. A web tool for age-period-cohort analysis of cancer incidence and mortality rates[J]. Cancer Epidemiol Biomarkers Prev, 2014, 23(11): 2296-2302. DOI: 10.1158/1055-9965.EPI-14-0300. [12] Wang PG, Xu CL, Yu CH. Age-period-cohort analysis on the cancer mortality in rural China: 1990-2010[J]. Int J Equity Health, 2014, 13: 1. DOI: 10.1186/1475-9276-13-1. [13] Valery PC, Laversanne M, Clark PJ, et al. Projections of primary liver cancer to 2030 in 30 countries worldwide[J]. Hepatology, 2018, 67(2): 600-611. DOI: 10.1002/hep.29498. [14] Mistry M, Parkin DM, Ahmad AS, et al. Cancer incidence in the United Kingdom: projections to the year 2030[J]. Br J Cancer, 2011, 105(11): 1795-1803. DOI: 10.1038/bjc.2011.430. [15] Møller B, Fekjaer H, Hakulinen T, et al. Prediction of cancer incidence in the Nordic Countries up to the year 2020[J]. Eur J Cancer Prev, 2002, 11 suppl 1: S1-S96. [16] Hang TP, Spiritos Z, Gamboa AM, et al. Epidemiology of early esophageal adenocarcinoma[J]. Clin Endosc, 2022, 55(3): 372-380. DOI: 10.5946/ce.2021.152. [17] Domper Arnal MJ, Ferrández Arenas Á, Lanas Arbeloa Á. Esophageal cancer: risk factors, screening and endoscopic treatment in Western and Eastern Countries[J]. World J Gastroenterol, 2015, 21(26): 7933-7943. DOI: 10.3748/wjg.v21.i26.7933. [18] 肖应婷, 苏畅, 欧阳一非, 等. 中国9省(自治区)1991-2011年18~44岁人群蔬菜水果摄入状况及变化趋势[J]. 中华流行病学杂志, 2015, 36(3): 232-236. DOI: 10.3760/cma.j.issn.0254-6450.2015.03.009.Xiao YT, Su C, Ouyang YF, et al. Trends of vegetables and fruits consumption among Chinese adults aged 18 to 44 years old from 1991 to 2011[J]. Chinese J Epidemiol, 2015, 36(3): 232-236. DOI: 10.3760/cma.j.issn.0254-6450.2015.03.009. [19] 何宇纳, 赵丽云, 于冬梅, 等. 2010-2012年中国成年居民蔬菜和水果摄入状况[J]. 中华预防医学杂志, 2016, 50(3): 221-224. DOI: 10.3760/cma.j.issn.0253-9624.2016.03.006.He YN, Zhao LY, Yu DM, et al. Consumption of fruits and vegetables in Chinese adults from 2010 to 2012[J]. China J Prevent Med, 2016, 50(3): 221-224. DOI: 10.3760/cma.j.issn.0253-9624.2016.03.006. [20] Barker-Collo S, Bennett DA, Krishnamurthi RV, et al. Sex differences in stroke incidence, prevalence, mortality and disability-adjusted life years: results from the global burden of disease study 2013[J]. Neuroepidemiology, 2015, 45(3): 203-214. DOI: 10.1159/000441103. [21] Alsop BR, Sharma P. Esophageal cancer[J]. Gastroenterol Clin North Am, 2016, 45(3): 399-412. DOI: 10.1016/j.gtc.2016.04.001. [22] 张志恒, 胡文兰. 我国居民水果消费的现状、前景及其对策[J]. 中国果品研究, 1996, 16(4): 9-10. https://www.cnki.com.cn/Article/CJFDTOTAL-ZGGP604.002.htmZhang ZH, Hu WL. Present situation prospect and countermeasure of fruit consumption in China[J]. China Fruit Research, 1996, 16(4): 9-10. https://www.cnki.com.cn/Article/CJFDTOTAL-ZGGP604.002.htm [23] Luo LS, Jiang JF, Yu CH, et al. Stroke mortality attributable to low fruit intake in China: a joinpoint and age-period-cohort analysis[J]. Front Neurosci, 2020, 14: 552113. DOI: 10.3389/fnins.2020.552113. [24] Qiu HB, Cao SM, Xu RH. Cancer incidence, mortality, and burden in China: a time-trend analysis and comparison with the United States and United Kingdom based on the global epidemiological data released in 2020[J]. Cancer Commun (Lond), 2021, 41(10): 1037-1048. DOI: 10.1002/cac2.12197. [25] 文姚丽. 民国灾荒史研究述评[J]. 社会保障研究, 2012, 15(1): 166-181. https://www.cnki.com.cn/Article/CJFDTOTAL-QYDB201617141.htmWen YL. The study of review about the history of minguo famine[J]. Social Security Studies, 2012, 15(1): 166-181. https://www.cnki.com.cn/Article/CJFDTOTAL-QYDB201617141.htm [26] Li J, Li B, Zhang F, et al. Urban and rural stroke mortality rates in China between 1988 and 2013: an age-period-cohort analysis[J]. J Int Med Res, 2017, 45(2): 680-690. DOI: 10.1177/0300060516664241. [27] Cohen AK, Syme SL. Education: a missed opportunity for public health intervention[J]. Am J Public Health, 2013, 103(6): 997-1001. DOI: 10.2105/AJPH.2012.300993. -

 点击查看大图
计量
- 文章访问数: 352
- HTML全文浏览量: 236
- PDF下载量: 65
- 被引次数: 0