

Spatial characteristics and influencing factors of the incidence rate of COVID-19 in Shanghai
-
摘要:
目的 探究上海市COVID-19疫情的空间分布特征,分析各类影响因素对疫情传播的影响。 方法 收集2022年3月1日―2022年5月31日上海市各行政区卫生健康委员会官网的COVID-19疫情数据,采用GeoDa软件进行空间自相关回归分析。选择2021年上海市各行政区统计年鉴中典型的人口、经济、医疗等因素的变量,采用相关性以及多重共线性分析进行筛选,最后纳入4个自变量进入模型。在普通最小二乘线性(ordinary least square,OLS)模型、空间滞后模型(spatial lag model,SLM)、空间误差模型(spatial error model,SEM)中,优选OLS模型作为影响本轮疫情影响因素的模型。 结果 本轮上海市疫情传播具有全局空间聚集性,其中虹口区、静安区、黄浦区和徐汇区为高-高聚集区(high-high area,HH),在松江区和金山区为低-低聚集区(low-low area,LL),其余区域局部Moran’s I不显著。OLS模型提示,人口密度与人均GDP为COVID-19发病率的促进因素,单位医院数量与人均公共财政教育支出则与COVID-19发病率无显著相关性。 结论 目前在SARS-CoV-2回归“乙类乙管”防控措施后,鼓励居民自我健康管理,做好个人健康监测,外出旅游时,加强健康防护;感染COVID-19轻症状和无症状患者提倡居家隔离,重症状患者则及时前往医院治疗。 -
关键词:
- 新型冠状病毒肺炎 /
- 空间相关 /
- 空间集聚性 /
- 普通最小二乘线性模型
Abstract:Objective The spatial characteristics of COVID-19 in Shanghai were investigated based on spatial autocorrelation analysis, and the impact of various vital factors on the spread of COVID-19 was also analyzed. Methods The COVID-19 epidemic data published on the official website of the Shanghai Municipal Health Commission from March 1, 2022, to May 31, 2022, were collected. And the GeoDa software was used for spatial autocorrelation regression analysis. We selected the typical data in demongraphic, economic, medicine and policy strategies from the 2021 statistical yearbook in each Shanghai administration region. Subsequently, we screened out four variables by correlation analysis and multicollinearity analysis. The ordinary least squares model (OLS) test was preferentially selected to analyze the transmission factors among OLS model, spatial lag model (SLM) and spatial error model (SEM). Results The spread of the epidemic in Shanghai was spatially concentrated, with high-high areas (HH) in Hongkou District, Jingan District, Huangpu District and Xuhui District, low-low areas (LL) in Songjiang District and Jinshan District, and Moran's I insignificance in other areas. The OLS model indicated that population density and GDP per capita positively affected the COVID-19 prevalence rate, while number of hospitals per unit and public expenditure on education per capita had no significance. Conclusions Currently, after China manage COVID-19 with measures against Class B infectious disease, residents are encouraged to manage their own health, to do personal health monitoring, to strengthen health protection when traveling. The mild and asymptomatic COVID-19 cases should be isolated at home, while the severe cases should be treated in hospital. -
Key words:
- COVID-19 /
- Spatial autocorrelation /
- Spatial agglomeration /
- Ordinary least square model
-

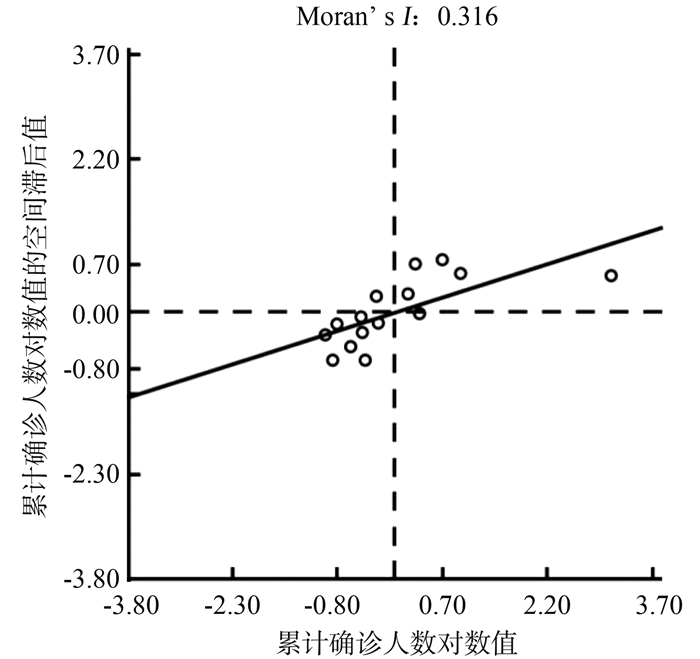
图 1 上海市16个区累计确诊患者、累计无症状感染者以及累计发病率(‰)
Figure 1. Distribution of COVID-19 cases in 16 Districts of Shanghai (‰)

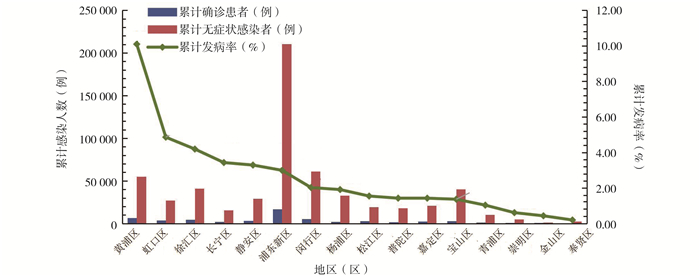
图 2 累计发病率全局Moran’s I散点图
Figure 2. Moran's I scatter plot of the cumulative incidence rate
表 1 变量名以及统计描述
Table 1. Variable name and statistical description
变量类型 分类 变量 含义 单位 最大值 最小值 平均值 标准偏差 因变量 Y 累计COVID-19确诊率 ‰ 10.09 0.20 2.55 2.35 自变量 人口 X1 年末常住人口 万人 586.60 63.94 155.56 121.11 X2 人口密度 人/km2 32 316.87 539.36 12 534.69 1 1361.94 经济 X3 人均GDP 元 397 409.26 59 716.92 153 924.63 84 537.15 X4 居民人均年可支配收入 元 88 280.00 41 990.00 70 195.75 15 051.19 医疗 X5 单位病床数 张/万人 155.64 21.37 76.34 44.89 X6 单位医院数量 个/万人 0.32 0.03 0.10 0.08 X7 诊疗人次数 万人次 4 370.72 495.60 1 345.19 922.64 X8 单位卫技人员 个/万人 328.91 31.29 116.24 83.15 政策 X9 人均财政卫生健康支出 元/人 5 227.73 621.42 1 577.69 1 065.47 X10 人均公共财政教育支出 元/人 5 990.89 1 700.52 3 208.71 1 048.56 注:国内生产总值(gross domestic product, GDP)。  下载: 导出CSV
表 2 2022年5月31日上海市COVID-19局部空间聚集分析
Table 2. Analysis of local spatial agglomeration of the cumulative incidence rate in Shanghai on May 31, 2022
空间聚集分布类型 区域 高-高聚集区 静安区、虹口区、黄浦区、徐汇区 低-高聚集区 ― 低-低聚集区 松江区、金山区 高-低聚集区 ― 注:“―”表示未发现该聚集区。
下载: 导出CSV
表 3 OLS模型结果
Table 3. The result of OLS model
自变量 相关性分析系数 方差膨胀系数 r (95% CI)值 人口密度X2 0.757 a 5.530 1.270 b 0.081~2.460 人均GDP X3 0.865 a 3.780 1.720 c 0.680~2.760 单位医院数量X6 0.823 a 3.350 -0.960 2.400~0.480 人均公共财政教育支出X10 0.776 a 2.890 0.405 1.960~3.150 注:a P<0.001; b 0.01<P<0.05; c 0.001<P<0.01。
下载: 导出CSV
-
[1] Majumder J, Minko T. Recent developments on therapeutic and diagnostic approaches for COVID-19[J]. AAPS J, 2021, 23(1): 14. DOI: 10.1208/s12248-020-00532-2. [2] 刘珍. 湖南省新冠肺炎疫情空间分异特征分析[J]. 云南地理环境研究, 2021, 33(3): 58-65. DOI: 10.3969/j.issn.1001-7852.2021.03.011.Liu Z. Analysis on the spatial differentiation characteristics of the COVID-19 epidemic in Hunan Province[J]. Yunnan Geographic Environment Research, 2021, 33(3): 58-65. DOI: 10.3969/j.issn.1001-7852.2021.03.011. [3] 潘敬菊, 周梦格, 张岚, 等. 湖北省居民2019年自杀死亡方式及空间自相关分析[J]. 中国公共卫生, 2022, 38(7): 902-907. DOI: 10.11847/zgggws1135192.Pan JJ, Zhou MG, Zhang L, et. al. Method-specific suicide mortality and its spatial autocorrelation among residents in Hubei Province, 2019: a vital registry-based analysis[J]. Chin J Public Health, 2022, 38(7): 902-907. DOI: 10.11847/zgggws1135192. [4] 段在鹏, 艾仁华. COVID-19疫情在我国的空间特征及影响因素分析[J]. 安全与环境学报, 2022, 22(2): 892-900. DOI: 10.13637/j.issn.1009-6094.2020.1524.Duan ZP, Ai RH. Analysis of the spatial characteristics and influencing factors of COVID-19 epidemic in China[J]. Journal of Safety and Environment, 2022, 22(2): 892-900. DOI: 10.13637/j.issn.1009-6094.2020.1524. [5] Mollalo A, Vahedi B, Rivera KM. GIS-based spatial modeling of COVID-19 incidence rate in the continental United States[J]. Sci Total Environ, 2020, 728: 138884. DOI: 10.1016/j.scitotenv.2020.138884. [6] 冯友建, 陈天一. 基于SEM模型的轨道交通对住宅价格的空间效应: 以杭州市为例[J]. 浙江大学学报(理学版), 2020, 47(1): 115-122. DOI: 10.3785/j.issn.1008-9497.2020.01.017.Feng YJ, Chen TY. The spatial effect of rail transit on residential prices based on SEM model: a case study of Hangzhou[J]. Journa of Zhejiang Univerdsity (Science Edition), 2020, 47(1): 115-122. DOI: 10.3785/j.issn.1008-9497.2020.01.017. [7] 沈佳莹, 林剑生, 曹广文. 新型冠状病毒的变异株进展: 起源、变异动力与防控措施[J]. 上海预防医学, 2022, 34(1): 81-86. DOI: 10.19428/j.cnki.sjpm.2022.21039.Shen JY, Lin JS, Cao GW. SARS-CoV-2 variants: origin, drivers and prevention measures[J]. Shanghai Journal of Preventive Medicine, 2022, 34(1): 81-86. DOI: 10.19428/j.cnki.sjpm.2022.21039. [8] Ganasegeran K, Jamil MFA, Ch'ng ASH, et al. Influence of population density for COVID-19 spread in Malaysia: an ecological study[J]. Int J Environ Res Public Health, 2021, 18(18): 9866. DOI: 10.3390/ijerph18189866. [9] Ueda M, Yamashita E, Tanimoto T, et al. Are less aggressive national lockdowns in COVID-19 associated with enhanced economic activity?[J]. QJM, 2021, 114(6): 359-361. DOI: 10.1093/qjmed/hcab021. -

 点击查看大图
计量
- 文章访问数: 223
- HTML全文浏览量: 156
- PDF下载量: 37
- 被引次数: 0