

Analysis of the association between ambient temperature and foodborne diseases in Anhui Province, 2016-2019
-
摘要:
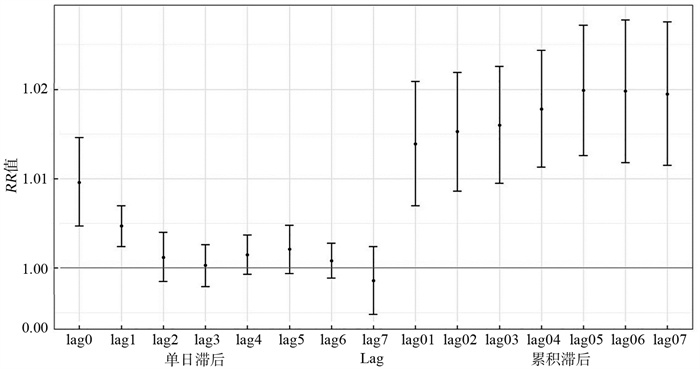
目的 分析安徽省食源性疾病与气温的关系,探讨滞后效应及识别易感人群。 方法 收集2016―2019年安徽省各市食源性疾病监测数据以及同期气象数据。采用类Poisson回归的广义线性模型分析各市日均气温和食源性疾病的关系,然后采用Meta分析合并效应值。 结果 研究期间,安徽省共填报348 958例食源性疾病病例,年均发病率0.13%。日均气温与食源性疾病发病呈线性关系,且存在一定的滞后效应。单日滞后中,其效应在当天(lag0)最大,效应值为1.009 6(95% CI:1.004 7~1.019 0),即日均气温每增加1 ℃,当日食源性疾病发生风险增加1.009 6倍。到滞后第3天及以后其效应无统计学意义。累积滞后中,lag05对应的RR值最大,为1.019 9(95% CI: 1.012 6~1.027 2)。亚组分析结果显示, < 65岁年龄组较≥65岁年龄组更易受到影响。 结论 气温升高会增加食源性疾病的发病风险,且存在滞后效应,应加强对易感人群的预防。 Abstract:Objective To examine the effect of ambient temperature on foodborne diseases in Anhui Province, identify lag effects, and pinpoint vulnerable populations. Methods Foodborne disease surveillance data and meteorological data from all Cities in Anhui Province from 2016 to 2019 were collected. A generalized linear model based on quasi-Poisson regression was used to analyze the potential association between mean temperature and foodborne diseases in each city. Meta-analysis was then applied to pool the estimated city-specific effects. Results Between 2016 and 2019, 348 958 cases of foodborne diseases were reported in Anhui Province, with an annual incidence rate of 0.13%. Mean ambient temperature exhibited a linear effect on foodborne diseases incidence and revealed a delayed effect. In single lag effect, the maximum effect occurred at lag0 with a corresponding RR of 1.009 6 (95% CI: 1.004 7-1.019 0), indicating that a 1 ℃ temperature increase would raise the risk of foodborne diseases by 1.009 6-time on the current day. As the lag day lengthened, the effect diminished gradually, becoming statistically insignificant on the third lag day. For cumulative lag effects, the maximum effect was at lag05 1.019 9(95% CI: 1.012 6-1.027 2). Subgroup analysis showed that individuals less than 65 years old were more susceptible than those aged 65 or older. Conclusions Ambient temperature can increase the risk of foodborne disease, with a lag effect observed. Prevention program on foodborne disease should be focusing on susceptible individuals. -
Key words:
- Foodborne diseases /
- Temperature /
- Distribution characteristic
-

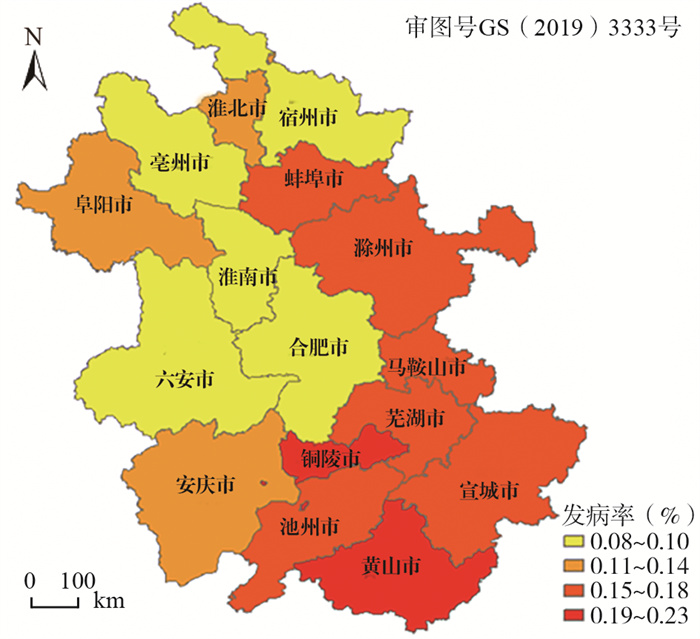
图 1 安徽省2016―2019年食源性疾病发病地区分布图
Figure 1. Distribution map of foodborne diseases between 2016-2019 in Anhui Province

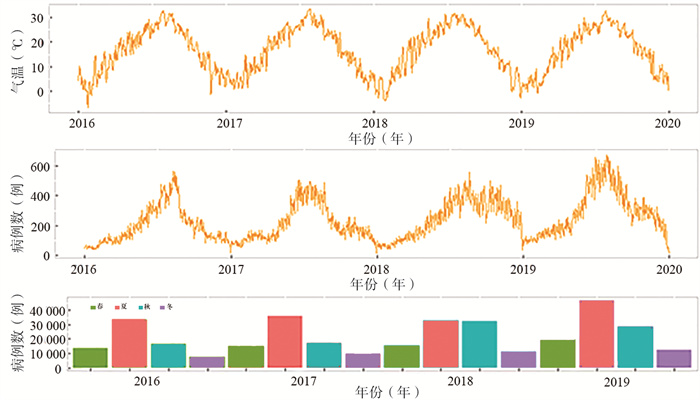
图 2 2016―2019年安徽省食源性疾病发病及每日MT的时序图
Figure 2. Time distribution of foodborne diseases and MT in Anhui Province, 2016-2019

图 3 安徽省日均气温对食源性疾病发病影响的滞后效应
Figure 3. The lag effect of the association between average daily temperature and incidence of foodborne diseases in Anhui Province

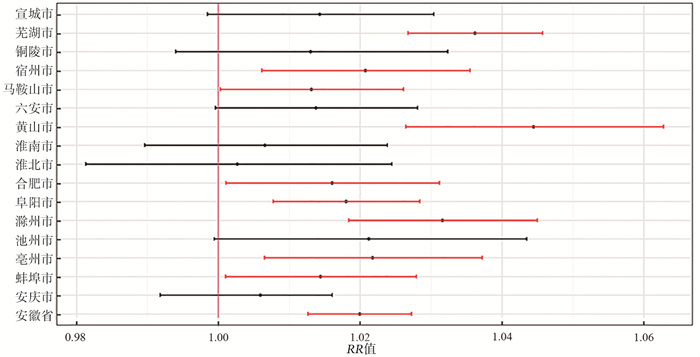
图 4 安徽省各城市日均气温(lag05)与食源性疾病发病的关系
Figure 4. The association between the daily average temperature (lag05) and foodborne diseases in Anhui Province
表 1 安徽省2016―2019年各市食源性疾病发病数及气象因素基本情况[M(IQR)]
Table 1. Basic characteristics of number of foodborne diseases and meteorological factors in cities of Anhui Province, 2016-2019 [M(IQR)]
城市 日发病数 MT(℃) 平均RH(%) 平均WS(m/s) 平均RF(mm) 平均P(hpa) 阜阳市 28.0(37.0) 17.1(17.0) 75.0(20.0) 2.1(1.3) 0.0(0.1) 1 013.4(16.1) 安庆市 17.0(14.0) 18.1(15.4) 76.0(21.0) 2.5(1.8) 0.0(1.3) 1 010.8(14.6) 滁州市 16.0(16.0) 17.0(16.2) 78.0(16.0) 1.6(1.0) 0.0(0.3) 1 013.3(14.9) 合肥市 16.0(21.0) 17.4(15.8) 77.0(17.0) 1.9(1.5) 0.0(0.9) 1 012.3(15.7) 芜湖市 14.0(11.0) 17.6(15.6) 78.0(18.0) 2.4(1.4) 0.0(0.0) 1 011.4(15.1) 蚌埠市 12.0(18.0) 16.8(16.8) 77.0(17.0) 2.3(1.4) 0.0(0.2) 1 013.7(16.0) 六安市 11.0(10.0) 17.5(15.8) 75.0(22.2) 1.7(0.9) 0.0(1.3) 1 007.7(15.5) 宿州市 11.0(20.0) 16.6(14.7) 74.0(21.0) 1.9(1.0) 0.0(2.2) 1 014.4(16.2) 马鞍山市 10.0(9.0) 17.6(15.1) 75.0(23.0) 2.5(1.5) 0.0(0.0) 1 009.4(14.5) 宣城市 10.0(11.0) 17.7(15.6) 77.0(10.0) 2.4(1.3) 0.0(1.1) 1 014.0(15.0) 亳州市 9.0(13.0) 17.2(17.8) 70.0(21.0) 2.3(1.2) 0.0(0.0) 1 012.6(16.4) 铜陵市 9.0(11.0) 18.0(15.3) 79.0(18.0) 2.3(1.5) 0.0(1.0) 1 014.6(15.8) 黄山市 8.0(8.0) 16.1(15.4) 90.0(23.0) 4.8(2.8) 0.2(3.9) 999.4(3.9) 池州市 7.0(7.0) 17.8(15.6) 82.0(15.0) 2.0(1.2) 0.0(1.3) 1 010.7(14.7) 淮南市 7.0(14.0) 16.7(16.4) 82.0(16.0) 2.1(1.4) 0.0(0.2) 1 014.4(15.6) 淮北市 6.0(9.0) 16.7(18.2) 71.0(23.0) 1.5(0.9) 0.0(0.1) 1 014.0(16.0)  下载: 导出CSV
表 2 气象因素间Spearman相关性分析
Table 2. Spearman correlation analysis between meteorological factors
气象因素 MT RH P RF WS MT 1.00 0.03 -0.84 -0.05 -0.02 RH 1.00 -0.18 0.62 0.03 P 1.00 -0.12 -0.08 RF 1.00 0.16 WS 1.00 注: 所有r均有统计学意义(均有P < 0.05)。
下载: 导出CSV
表 3 气温与食源性疾病关系敏感性分析
Table 3. Sensitivity analysis of the association between ambient temperature and foodborne diseases
分析指标 RR值(95% CI) P值 控制变量 P 1.017 0(1.007 1~1.026 8) 0.643 改变参数 υ=2 1.019 4(1.012 1~1.026 6) 0.924 υ=4 1.019 2(1.011 7~1.026 7) 0.895 υ=5 1.016 3(1.008 1~1.024 4) 0.519
下载: 导出CSV
-
[1] Havelaar AH, Kirk MD, Torgerson PR, et al. World health organization global estimates and regional comparisons of the burden of foodborne disease in 2010 [J]. PLoS Med, 2015, 12(12): e1001923. DOI: 10.1371/journal.pmed.1001923. [2] 毛雪丹, 胡俊峰, 刘秀梅. 我国细菌性食源性疾病疾病负担的初步研究[J]. 中国食品卫生杂志, 2011, 23(2): 132-136. DOI: 10.13590/j.cjfh.2011.02.018.Mao XD, Hu JF, Liu XM, et al. Epidemiological burden of bacterial foodborne diseases in China-Preliminary study [J]. Chin J Food Hyg, 2011, 23(2): 132-136. DOI: 10.13590/j.cjfh.2011.02.018. [3] 张娜, 陆姣, 程景民. 中国居民防范食源性疾病相关知识、态度、行为现状及其人群特征分析[J]. 中国公共卫生, 2022, 38(3): 280-284. DOI: 10.11847/zgggws1132064.Zhang N, Lu J, Cheng JM. Status and population characteristics of knowledge, attitude and practice about foodborne disease prevention among Chinese public [J]. Chin J Publ Heal, 2022, 38(3): 280-284. DOI: 10.11847/zgggws1132064. [4] Chen RJ, Yin P, Wang LJ, et al. Association between ambient temperature and mortality risk and burden: time series study in 272 main Chinese cities [J]. BMJ, 2018, 363: k4306. DOI: 10.1136/bmj.k4306. [5] 聂勇光, 刘风仙. 2017-2019年滨州市食源性疾病病例监测分析[J]. 职业与健康, 2021, 37(23): 3202-3205. DOI: 10.13329/j.cnki.zyyjk.2021.0736.Nie YG, Liu FX. Analysis on surveillance of foodborne disease cases in Binzhou City from 2017-2019 [J]. Occup Health, 2021, 37(23): 3202-3205. DOI: 10.13329/j.cnki.zyyjk.2021.0736. [6] 刘萍, 张锋, 刘冬. 2017-2019年西安市食源性疾病病原学主动监测结果分析[J]. 公共卫生与预防医学, 2021, 32(6): 36-39. DOI: 10.3969/j.issn.1006-2483.2021.2483.2021.06.009.Liu P, Zhang F, Liu D. Analysis of active surveillance on the etiology of foodborne diseases in Xi'an in 2017-2019 [J]. J Public Health Prev Med, 2021, 32(6): 36-39. DOI: 10.3969/j.issn.1006-2483.2021.2483.2021.06.009. [7] 杨彦玲, 赵江, 万青青, 等. 2016—2020年云南省食源性疾病病例监测结果分析[J]. 职业与健康, 2022, 38(17): 2338-2343. DOI: 10.13329/j.cnki.zyyjk.2022.0492.Yang YL, Zhao J, Wan QQ, et al. Analysis on surveillance results of foodborne diseases in Yunnan Province from 2016—2020 [J]. Occup Health, 2022, 38(17): 2338-2343. DOI: 10.13329/j.cnki.zyyjk.2022.0492. [8] 王海涛, 刘志东, 劳家辉, 等. 浙江省气温对其他感染性腹泻的滞后效应及影响因素[J]. 中华流行病学杂志, 2019, 40(8): 960-964. DOI: 10.3760/cma.j.issn.0254-6450.Wang HT, Liu ZD, Lao JH, et al. Lag effect and influencing factors of temperature on other infectious diarrhea in Zhejiang Province [J]. Chin J Epidemiol, 2019, 40(8): 960-964. DOI: 10.3760/cma.j.issn.0254-6450. [9] 陈江, 齐小娟, 张政, 等. 2016年浙江省食源性疾病监测结果分析[J]. 中国预防医学杂志, 2019, 20(1): 6-10. DOI: 10.16506/j.1009-6639.2019.01.004.Chen J, Qi XJ, Zhang Z, et al. Surveillance data analysis of foodborne diseases in Zhejiang in 2016 [J]. Chinese Preventive Medicine, 2019, 20(1): 6-10. DOI: 10.16506/j.1009-6639.2019.01.004. [10] 王若宇, 黄柏石, 潘卓林, 等. 中国居民食源性疾病的地理分布及影响因素分析[J]. 世界地理研究, 2020, 29(1): 168-180. DOI: 10.3969/j.issn.1004-9479.2020.01.2018432.Wang RY, Huang BS, Pan ZL, et al. Spatial pattern evolvement of the distribution of foodborne illness in China and its influence mechanism [J]. World Regional Studies, 2020, 29(1): 168-180. DOI: 10.3969/j.issn.1004-9479.2020.01.2018432. [11] 陶燕, 刘志明, 米生权, 等. 气象因素对其他感染性腹泻病的影响[J]. 兰州大学学报(自然科学版), 2015, 51(5): 646-651. DOI: 10.13885/j.issn.0455-2059.2015.05.009.Tao Y, Liu ZM, Mi SQ, et al. Effects of meteorological factors on other types of infectious diarrhea [J]. J Lanzhou Univ (Nat Sci), 2015, 51(5): 646-651. DOI: 10.13885/j.issn.0455-2059.2015.05.009. [12] Rosenberg A, Weinberger M, Paz S, et al. Ambient temperature and age-related notified Campylobacter infection in Israel: a 12-year time series study [J]. Environ Res, 2018, 164: 539-545. DOI: 10.1016/j.envres.2018.03.017. [13] 杨博雯, 叶玉龙, 阙凤霞, 等. 上海市金山区2012年—2017年沙门菌分布特征及与气象因素的相关性分析[J]. 中国卫生检验杂志, 2020, 30(16): 2006-2008. https://www.cnki.com.cn/Article/CJFDTOTAL-ZWJZ202016026.htmYang BW, Ye YL, Kan FX, et al. Analysis of the correlation between distribution of Salmonella and meteorological factors in Jinshan District, Shanghai, 2012-2017 [J]. Chin J Health Lab Technol, 2020, 30(16): 2006-2008. https://www.cnki.com.cn/Article/CJFDTOTAL-ZWJZ202016026.htm -

 点击查看大图
计量
- 文章访问数: 148
- HTML全文浏览量: 69
- PDF下载量: 51
- 被引次数: 0