

Analysis on association and lag effects of environmental factors on incidence of influenza like illness in Huzhou based on the distribution lag nonlinear model
-
摘要:
目的 探讨环境因素对湖州市流感样病例(influenza-like illness,ILI)流行的关联性及其滞后效应。 方法 收集2015-2019年湖州市ILI监测信息及同期环境资料,构建分布滞后非线性模型(distributed lag non-linear models, DLNM),探讨ILI与各环境因素之间的具体联系,定量评估各环境因素对ILI发病的累积滞后效应。 结果 2015-2019年湖州市共报告ILI 156 078例;各环境因素中,对ILI发病有关联的因素包括平均温度、温差、日照时长、细颗粒物(fine particulate matter, PM2.5)和SO2。其中低平均温度(0 ℃)和低日照时长(0 h)在滞后0~2周时,ILI发病风险增加,并分别在滞后1周(RR=1.385,95% CI: 1.110~1.745)和2周(RR=1.228,95% CI: 1.053~1.432)时发病风险最大。高平均温度(30.0 ℃)滞后0周(即时效应)时发病风险最大(RR=1.416,95% CI: 1.171~1.713)。PM2.5与SO2的最大发病风险分别在滞后0周和1周。 结论 2015-2019年湖州市环境因素中,高温、低温、低日照时长、高浓度PM2.5和SO2均会增加ILI的发病风险,并有一定的滞后性。其中高温的影响主要发生在滞后0周,而低温的影响可持续2周。 Abstract:Objective To explore the correlation and related lag effects of environmental factors on the prevalence of influenza-like illness (ILI) in Huzhou. Methods The weekly incidence data of ILI and environmental factors in Huzhou from 2015 to 2019 were collected. Distributed lag non-linear model (DLNM) was conducted to explore the specific relationship between ILI and various environmental factors and to quantify the cumulative lag effects of various environmental factors on ILI. Results A total of 156 078 ILI cases were reported in Huzhou from 2015 to 2019. Several environmental factors were associated with the incidence of ILI, including average temperature, temperature difference, sunshine duration, fine particulate matter (PM2.5), and SO2. Among them, the low average temperature (0 ℃) and the low sunshine duration (0 h) were significantly associated with ILI between lag 0 to lag 2 and with a maximal effect at lag1 (RR=1.385, 95% CI: 1.110-1.745) and lag 2 (RR=1.228, 95% CI: 1.053-1.432), respectively. The high average temperature (30.0 ℃) showed the maximal effect at lag0 (RR=1.416, 95% CI: 1.171-1.713). The maximum effect of PM2.5 and SO2 was lag0 and lag1, respectively. Conclusions Among the environmental factors in Huzhou from 2015 to 2019, high temperature, low temperature, low sunshine duration, and high concentrations of PM2.5 and SO2 increase the risk of ILI, and there is a certain lag. Among them, the impact of high temperature mainly occurs at lag 0, while the impact of low temperature can last for 2 weeks. -

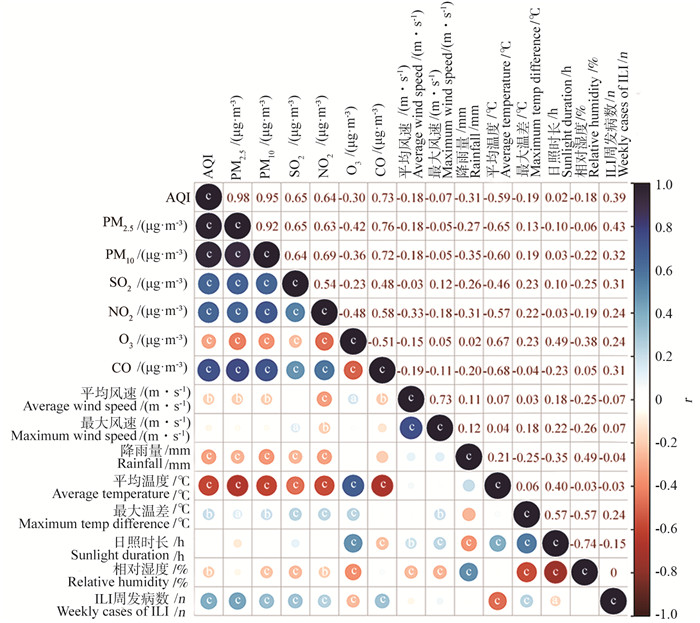
图 1 2015-2019年湖州市环境因素与ILI的相关系数
1. AQI:空气污染指数;2. a表示0.01<p≤0.05; 3. b表示0.001<p≤0.01; 4. c表示p≤0.001。
Figure 1. Correlation coefficients between environmental factors and ILI in Huzhou City from 2015 to 2019
1. AQI: air quality index; 2. a means 0.01 < p≤0.05; 3. b means 0.001 < p≤0.01; 4. c indicates p≤0.001.
表 1 2015-2019年湖州市每周ILI发病数及环境因素基本情况
Table 1. Weekly cases of ILI and basic environmental factors in Huzhou City from 2015 to 2019
因素 Factor 最小值 Min [M(P25, P75)] 最大值 Max 因素 Factor 最小值 Min [M(P25, P75)] 最大值 Max 年龄组/岁 Age group/years 气象因素 Meteorological factors 0~ < 5 105.0 298.0(383.0, 472.0) 907.0 降雨量/mm Rainfall/mm 0 0.6(2.4, 6.4) 36.2 5~ < 15 46.0 80.0(118.0, 191.0) 738.0 日照时长/h Sunlight duration/h 0 2.7(4.6, 6.7) 11.5 15~ < 25 0 6.0(9.5, 15.0) 50.0 相对湿度/% Relative humidity/% 55.3 70.9(77.9, 83.9) 95.9 25~ < 60 4.0 16.0(24.0, 37.0) 235.0 大气污染物 Atmospheric pollutant ≥60 0 4.0(6.0, 9.0) 95.0 AQI 25.3 49.2(61.8, 77.3) 181.3 合计Total 310.0 415.0(557.0, 727.0) 1 649.0 PM2.5/(μg·m-3) 10.7 27.2(37.2, 49.7) 141.4 气象因素 Meteorological factors PM10/(μg·m-3) 23.7 46.0(62.5, 81.7) 183.1 平均温度/℃ Average temperature/℃ -1.6 9.6(18.6, 24.6) 33.4 SO2/(μg·m-3) 3.5 9.7(13.1, 17.3) 33.4 最大温差/℃ Maximum temp difference/℃ 2.5 5.9(7.0, 8.9) 14.8 NO2/(μg·m-3) 10.6 28.2(35.0, 46.6) 79.7 平均风速/(m·s-1) Average wind speed/(m·s-1) 1.1 1.8(2.1, 2.4) 3.8 O3/(μg·m-3) 14.1 43.7(63.9, 81.8) 128.4 最大风速/(m·s-1) Maximum wind speed/(m·s-1) 3.2 4.2(4.6, 5.1) 7.5 CO/(μg·m-3) 0.4 0.7(0.8, 1.0) 1.6 注:AQI, 空气污染指数。
Note: AQI, air quality index. 下载: 导出CSV
表 2 2015-2019年湖州市ILI的不同影响因素RR值
Table 2. RR of different influencing factor of ILI in Huzhou City from 2015 to 2019
因素 Factor 值 Value RR值(95% CI) RR value (95% CI) 滞后0周(即时效应) Lag 0 week (Immediate effect) 滞后1周 Lag 1 week 滞后2周 Lag 2 weeks 滞后0~2周(累积效应) Lag 0-2 weeks (Cumulative effect) 平均温度/℃ Average temperature/℃ 0 1.318(1.048~1.657) ① 1.385(1.110~1.745) ① 1.339(1.066~1.680) ① 2.063(1.399~3.040) ① 15 0.995(0.974~1.016) 1.009(0.988~1.031) 1.017(0.995~1.039) 1.010(0.963~1.060) 30 1.416(1.171~1.713) ① 1.198(0.986~1.456) 1.040(0.847~1.276) 1.735(1.042~2.888) ① 最大温差/℃ Maximum temp difference/℃ 5 1.068(1.013~1.127) ① 1.007(0.957~1.059) 1.027(0.974~1.082) 1.009(0.885~1.150) 10 1.206(1.079~1.347) ① 1.034(0.928~1.153) 1.115(0.999~1.244) 1.164(0.898~1.509) 日照时长/h Sunlight duration/h 0 1.197(1.034~1.386) ① 1.188(1.024~1.378) ① 1.228(1.053~1.432) ① 2.162(1.457~3.207) ① 5 0.987(0.872~1.118) 1.068(0.938~1.216) 1.070(0.933~1.226) 1.348(0.934~1.946) PM2.5/(μg·m-3) 20 1.020(1.006~1.034) ① 1.002(0.988~1.016) 1.011(0.997~1.026) 1.041(0.998~1.085) 50 1.099(1.028~1.175) ① 1.011(0.946~1.080) 1.055(0.987~1.127) 1.208(0.990~1.474) 100 1.244(1.067~1.452) ① 1.026(0.880~1.196) 1.131(0.969~1.319) 1.548(0.976~2.455) 140 1.374(1.098~1.720) ① 1.038(0.831~1.297) 1.196(0.956~1.496) 1.888(0.965~3.694) SO2/(μg·m-3) 15 1.073(0.993~1.161) 1.093(1.012~1.180) ① 1.063(0.983~1.148) 1.264(1.004~1.590) ① 25 1.145(0.986~1.330) 1.185(1.024~1.371) ① 1.123(0.968~1.302) 1.563(1.008~2.423) ① 注:① P<0.05。
Note: ① P<0.05.
下载: 导出CSV
-
[1] 李兰娟, 任红. 传染病学[M]. 第9版. 北京: 人民卫生出版社, 2018: 67-68.Li LJ, Ren H. Infectious diseases[M]. 9 rd ed. Beijing: People's Medical Publishing House, 2018: 67-68. [2] Macias AE, McElhaney JE, Chaves SS, et al. The disease burden of influenza beyond respiratory illness[J]. Vaccine, 2021, 39(Suppl 1): A6-A14. DOI: 10.1016/j.vaccine.2020.09.048. [3] Li J, Chen YZ, Wang XL, et al. Influenza-associated disease burden in mainland China: a systematic review and meta-analysis[J]. Sci Rep, 2021, 11(1): 2886. DOI: 10.1038/s41598-021-82161-z. [4] Wang XL, Yang L, He DH, et al. Different responses of influenza epidemic to weather factors among Shanghai, Hong Kong, and British Columbia[J]. Int J Biometeorol, 2017, 61(6): 1043-1053. DOI: 10.1007/s00484-016-1284-y. [5] Soebiyanto RP, Clara W, Jara J, et al. The role of temperature and humidity on seasonal influenza in tropical areas: Guatemala, El Salvador and Panama, 2008-2013[J]. PLoS One, 2014, 9(6): e100659. DOI: 10.1371/journal.pone.0100659. [6] 国家卫生和计划生育委员会办公厅. 国家卫生计生委办公厅关于印发全国流感监测方案(2017年版)的通知[EB/OL]. (2017-04-01)[2022-10-10]. http://www.nhc.gov.cn/jkj/s3577/201704/ed1498d9e64144738cc7f8db61a39506.shtml .Office of the National Health and Family Planning Commission. National influenza surveillance programme (2017)[EB/OL]. (2017-04-01)[2022-10-10].http://www.nhc.gov.cn/jkj/s3577/201704/ed1498d9e64144738cc7f8db61a39506.shtml .[7] Cowling BJ, Wong IOL, Ho LM, et al. Methods for monitoring influenza surveillance data[J]. Int J Epidemiol, 2006, 35(5): 1314-1321. DOI: 10.1093/ije/dyl162. [8] Chan PKS, Mok HY, Lee TC, et al. Seasonal influenza activity in Hong Kong and its association with meteorological variations[J]. J Med Virol, 2009, 81(10): 1797-1806. DOI: 10.1002/jmv.21551. [9] Lowen AC, Mubareka S, Steel J, et al. Influenza virus transmission is dependent on relative humidity and temperature[J]. PLoS Pathog, 2007, 3(10): 1470-1476. DOI: 10.1371/journal.ppat.0030151. [10] Caini S, Spreeuwenberg P, Donker G, et al. Climatic factors and long-term trends of influenza-like illness rates in the Netherlands, 1970-2016[J]. Environ Res, 2018, 167: 307-313. DOI: 10.1016/j.envres.2018.07.035. [11] Bao JZ, Wang ZK, Yu CH, et al. The influence of temperature on mortality and its Lag effect: a study in four Chinese Cities with different latitudes[J]. BMC Public Health, 2016, 16: 375. DOI: 10.1186/s12889-016-3031-z. [12] Ge WZ, Xu F, Zhao ZH, et al. Association between diurnal temperature range and respiratory tract infections[J]. Biomed Environ Sci, 2013, 26(3): 222-225. DOI: 10.3967/0895-3988.2013.03.009. [13] Feng C, Li J, Sun WJ, et al. Impact of ambient fine particulate matter (PM2.5) exposure on the risk of influenza-like-illness: a time-series analysis in Beijing, China[J]. Environ Health, 2016, 15: 17. DOI: 10.1186/s12940-016-0115-2. [14] Xing YF, Xu YH, Shi MH, et al. The impact of PM2.5 on the human respiratory system[J]. J Thorac Dis, 2016, 8(1): E69-E74. DOI: 10.3978/j.issn.2072-1439.2016.01.19. [15] Committee of the Environmental and Occupational Health Assembly of the American Thoracic Society. Health effects of outdoor air pollution[J]. Am J Respir Crit Care Med, 1996, 153(1): 3-50. 10.1164/ajrccm.153.1.8542133. doi: 10.1164/ajrccm.153.1.8542133 [16] Zhang YZ, Ye CC, Yu JX, et al. The complex associations of climate variability with seasonal influenza A and B virus transmission in subtropical Shanghai, China[J]. Sci Total Environ, 2020, 701: 134607. DOI: 10.1016/j.scitotenv.2019.134607. -

 点击查看大图
计量
- 文章访问数: 385
- HTML全文浏览量: 226
- PDF下载量: 46
- 被引次数: 0