

Predictive effect of obesity indexes on hypertension in people aged 35-75 years in Inner Mongolia
-
摘要:
目的 比较9个肥胖指标单独和联合使用对高血压患病风险的预测效果。 方法 基于内蒙古地区“心血管病高危人群早期筛查与综合干预”项目初筛数据,通过logistic回归分析模型分析肥胖指标对高血压患病的影响,并采用受试者工作特征曲线(receiver operator characteristic, ROC)分析预测高血压患病风险的效果。 结果 本研究共纳入48 570名35~75岁人群。调整混杂因素后,男性人群中体格指数(ponderal index,PI)每增加1个s对高血压患病增加的风险最高(OR=1.529, 95% CI: 1.476~1.584),而女性(OR=1.432, 95% CI: 1.395~1.470)和全人群(OR=1.473, 95% CI: 1.443~1.503)均受体质指数(body mass index,BMI)影响最大。BMI预测高血压患病风险的曲线下面积(area under the curve,AUC)最大为0.665,而BMI和脂质蓄积指数(lipid accumulation product index, LAP)联合预测的AUC为0.668,仅增加0.45%。BMI预测高血压的切点值为25.7 kg/m2。 结论 BMI预测高血压患病风险的效果最好,应采取措施将BMI控制在25.7 kg/m2以下。 Abstract:Objective To compare the predictive effect of nine obesity indicators alone and in combination on the risk of hypertension. Methods Primary screening data collected in the baseline survey of "Early Screening and Comprehensive Intervention Project for High Risk Groups of Cardiovascular Diseases" was analyzed. The logistics regression was used to analyze the influence of obesity indicators on the prevalence of HTN, And the receiver operator characteristic (ROC) curve analysis was applied to predict the effect of the risk of HTN. Results A total of 48 570 people aged 35-75 years were included in this study. After adjusting for confounding factors, each increase in standard deviation in PI of the male population had the highest risk of increased prevalence of hypertension (OR=1.529, 95% CI: 1.476-1.584), while the female population (OR=1.432, 95% CI: 1.395-1.470) and the whole population (OR=1.473, 95% CI: 1.443-1.503) had the highest BMI effect. The maximum area under the curve (AUC) for predicting the risk of HTN by BMI was 0.665, while the AUC for the combined prediction of BMI and LAP was 0.668, with an increase of only 0.45%. The optimal cut off value for BMI was 25.7 kg/m2. Conclusions BMI is the most effective in predicting the risk of HTN, and measures should be taken to control BMI below 25.7 kg/m2. -
Key words:
- Obesity index /
- Hypertension /
- Receiver operating characteristic curve
-

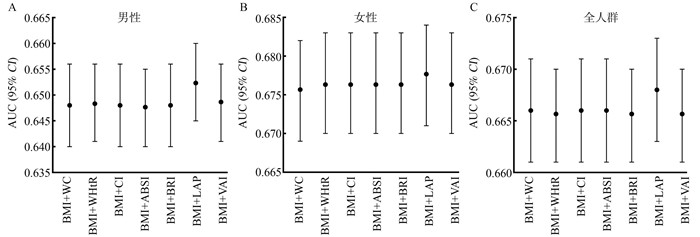
图 1 周围型肥胖指标与中心型肥胖指标联合预测高血压患病的ROC曲线结果分析
1. BMI: 体质指数;2. WC: 腰围;3. WHtR: 腰高比;4. PI: 体格指数;5. CI: 锥度指数;6. ABSI:身体形态指数;7. BRI: 身体圆度指数;8. LAP: 脂质蓄积指数;9. VAI: 内脏脂肪指数;10. AUC: 曲线下面积。
Figure 1. The ROC Curve result analysis of overall obesity index and central obesity index in predicting hypertension
1. BMI: body mass index; 2. WC: waist circumference; 3. WHtR: waist height ratio; 4. PI: ponderal index; 5. CI: conicity index; 6. ABSI: a body shape index; 7. BRI: body roundness index; 8. LAP: lipid accumulation product index; 9. VAI: visceral adiposity index; 10. AUC: area under the curvex.
表 1 不同特征组间高血压患病情况比较
Table 1. Comparison of hypertension prevalence among groups with different characteristics
分组 Grouping 男性 Male 女性 Female 合计 Total 人数(占比/%) Number of people (proportion/%) P值 P value 人数(占比/%) Number of people (proportion/%) P值 P value 人数(占比/%) Number of people (proportion/%) P值 P value 合计 Total 8 291(40.4) 9 784(34.9) 18 075(37.2) 年龄组/岁 Age group/years < 0.001 < 0.001 < 0.001 35~ < 45 1 257(31.1) 1 193(19.2) 2 450(23.9) 45~ < 55 2 592(38.3) 3 532(32.6) 6 124(34.8) 55~ < 65 2 957(44.5) 3 508(42.8) 6 465(43.6) 65~75 1 485(48.0) 1 551(55.7) 3 036(51.7) 民族 Nationality < 0.001 < 0.001 0.709 汉族 Han 7 332(39.9) 8 720(35.2) 16 042(37.2) 蒙族 Mongol 827(44.6) 908(33.3) 1 735(37.9) 其他 Other minority ethnic 134(44.2) 148(31.4) 282(36.4) 地区 Area 0.794 0.008 0.010 城市 Rural 2 395(40.2) 3 057(33.8) 5 452(36.4) 农村 Urban 5 896(40.4) 6 727(35.4) 12 623(37.6) 在婚 Married < 0.001 < 0.001 < 0.001 是 Yes 7 592(39.6) 8 636(34.2) 16 228(36.5) 否 No 699(50.8) 1 148(41.3) 1 847(44.5) 农民 Farmer 0.109 < 0.001 < 0.001 是 Yes 3 836(39.8) 4 984(37.8) 8 820(38.6) 否 No 4 455(40.9) 4 800(32.4) 9 255(36.0) 教育水平 Educational level < 0.001 < 0.001 < 0.001 高中以下 Below high school 6 222(79.8) 6 444(61.4) 12 666(69.8) 高中及以上 High school and above 1 450(43.3) 1 867(36.7) 3 317(39.3) 家庭年收入/元 Annual household income/yuan 0.258 0.002 < 0.001 < 50 000 7 325(40.2) 8 867(35.5) 16 111(37.5) ≥50 000 1 056(41.4) 908(30.1) 1 964(35.3) 具有医疗保险 Health insurance < 0.001 < 0.001 < 0.001 是 Yes 7 093(39.5) 8 324(34.6) 15 417(36.7) 否 No 1 198(46.2) 1 460(36.5) 2 658(40.3) 吸烟 Smoking < 0.001 < 0.001 < 0.001 是 Yes 3 823(36.8) 661(31.0) 4 484(35.8) 否 No 4 468(43.9) 9 123(35.3) 13 591(37.7) 饮酒 Drinking < 0.001 < 0.001 < 0.001 是 Yes 4 757(43.5) 900(33.2) 5 657(41.4) 否 No 3 451(36.6) 8 795(35.1) 12 246(35.5) 糖尿病 Diabetes mellitus < 0.001 < 0.001 < 0.001 是 Yes 1 824(50.3) 1 913(46.6) 3 737(48.3) 否 No 6 467(38.2) 7 871(32.9) 14 338(35.1) 血脂异常 Dyslipidemia < 0.001 < 0.001 < 0.001 是 Yes 3 276(43.8) 2 857(41.6) 6 133(42.7) 否 No 5 006(38.4) 6 923(32.8) 11 929(34.9)  下载: 导出CSV
表 2 控制混杂因素后肥胖指标对高血压患病影响的logistic回归分析模型
Table 2. Adjusted binary logistic regression model analysis of the impact of obesity indicators on hypertension
肥胖指标 Obesity indicators Q1 OR值(95% CI) Q1 OR value (95% CI) Q2 OR值(95% CI) Q2 OR value (95% CI) Q3 OR值(95% CI) Q3 OR value (95% CI) Q4 OR值(95% CI) Q4 OR value (95% CI) Q5 OR值(95% CI) Q5 OR value (95% CI) s OR值(95% CI) s OR value (95% CI) 男性 Male WC 1.000 0.875(0.750~1.021) 0.860(0.699~1.058) 0.823(0.642~1.055) 0.866(0.651~1.152) 1.356(1.313~1.400) ① WHtR 1.000 0.940(0.677~1.305) 0.836(0.573~1.220) 0.909(0.597~1.385) 0.903(0.575~1.418) 1.384(1.339~1.430) ① BMI 1.000 1.202(1.047~1.381) 1.321(1.092~1.597) ② 1.486(1.176~1.877) ① 1.744(1.319~2.306) ① 1.519(1.469~1.570) ① PI 1.000 1.245(1.088~1.425) ① 1.313(1.095~1.576) ① 1.448(1.157~1.813) ① 1.645(1.253~2.159) ① 1.529(1.476~1.584) ① CI 1.000 1.298(1.095~1.538) ① 1.191(0.945~1.502) 1.279(0.962~1.701) 1.224(0.873~1.717) 1.102(1.069~1.137) ① ABSI 1.000 0.955(0.820~1.111) 0.933(0.769~1.133) 0.947(0.755~1.188) 0.901(0.686~1.182) 0.986(0.956~1.060) BRI 1.000 1.091(1.791~1.504) 1.178(0.817~1.699) 0.989(1.656~1.491) 0.907(0.585~1.405) 1.376(1.332~1.422) ① LAP 1.000 1.274(1.123~1.444) ① 1.424(1.213~1.670) ① 1.916(1.582~2.320) ① 2.592(2.058~3.264) ① 1.400(1.352~1.349) ① VAI 1.000 0.898(0.814~0.990) 0.753(0.667~0.849) ① 0.695(0.596~0.810) ① 0.626(0.514~0.764) ① 1.174(1.129~1.220) ① 女性 Female WC 1.000 0.928(0.825~1.054) 1.000(0.853~1.174) 1.035(0.847~1.264) 1.040(0.817~1.325) 1.363(1.325~1.402) ① WHtR 1.000 0.918(0.643~1.309) 1.007(0.682~1.486) 1.168(0.765~1.783) 1.339(0.856~2.095) 1.374(1.338~1.411) ① BMI 1.000 0.974(0.852~1.113) 0.929(0.779~1.108) 0.901(0.729~1.114) 0.964(0.750~1.240) 1.432(1.395~1.470) ① PI 1.000 1.146(1.002~1.311) 1.304(1.095~1.553) ① 1.524(1.236~1.878) ① 1.755(1.371~2.248) ① 1.422(1.386~1.460) ① CI 1.000 0.951(0.839~1.079) 0.892(0.745~1.068) 0.878(0.698~1.105) 0.785(0.588~1.047) 1.134(1.104~1.165) ① ABSI 1.000 1.046(0.935~1.171) 1.031(0.886~1.201) 1.046(0.871~1.256) 0.934(0.741~1.176) 1.013(0.897~1.041) BRI 1.000 1.272(0.891~1.814) 1.350(0.918~1.984) 1.199(0.787~1.827) 1.221(0.750~1.910) 1.358(1.323~1.394) ① LAP 1.000 1.147(1.018~1.291) ② 1.333(1.151~1.544) ① 1.513(1.272~1.801) ① 1.774(1.441~2.184) ① 1.348(1.305~1.392) ① VAI 1.000 0.995(0.901~1.099) 0.933(0.835~1.043) 0.818(0.720~0.929) ② 0.826(0.707~0.966) 1.134(1.099~1.170) ① 合计 Total WC 1.000 0.960(0.879~1.049) 1.057(0.943~1.185) 1.099(0.954~1.266) 1.201(1.015~1.423) 1.371(1.343~1.399) ① WHtR 1.000 0.961(0.757~1.219) 0.954(0.730~1.245) 1.070(0.798~1.434) 1.106(0.810~1.510) 1.384(1.357~1.413) ① BMI 1.000 1.096 0.998~1.212) 1.160(1.027~1.311) 1.247(1.075~1.448) ① 1.451(1.212~1.736) ① 1.473(1.443~1.503) ① PI 1.000 1.189(1.086~1.303) ① 1.258(1.118~1.416) ① 1.369(1.185~1.581) ① 1.479(1.241~1.763) ① 1.433(1.404~1.462) ① CI 1.000 1.089(0.985~1.203) 1.024(0.890~1.179) 1.052(0.882~1.255) 0.970(0.781~1.205) 1.139(1.116~1.161) ① ABSI 1.000 1.033(0.970~1.150) 1.013(0.930~1.170) 1.025(0.920~1.220) 0.935(0.810~1.140) 1.018(0.998~1.038) BRI 1.000 1.109(1.876~1.403) 1.144(0.883~1.482) 0.972(1.730~1.295) 0.926(0.683~1.254) 1.371(1.344~1.399) ① LAP 1.000 1.146(1.056~1.245) ① 1.293(1.166~1.434) ① 1.562(1.381~1.767) ① 1.928(1.663~2.236) ① 1.377(1.345~1.409) ① VAI 1.000 0.941(0.878~1.080) 0.857(0.786~0.922) ① 0.764(0.695~0.840) ① 0.727(0.645~0.820) ① 1.144(1.114~1.171) ① 注:BMI, 体质指数; WC, 腰围; WHtR, 腰高比; PI, 体格指数; CI, 锥度指数; ABSI:身体形态指数; BRI, 身体圆度指数; LAP, 脂质蓄积指数; VAI, 内脏脂肪指数; Q, 五分位数。① P < 0.001。② P < 0.05。
Note: BMI, body mass index; WC, waist circumference; WHtR, waist height ratio; PI, ponderal index; CI, conicity index; ABSI, a body shape index; BRI, body roundness index; LAP, lipid accumulation product index; VAI, visceral adiposity index; Q, quintile.① P < 0.001. ② P < 0.05.
下载: 导出CSV
表 3 各项肥胖指标预测高血压患病的ROC曲线分析
Table 3. ROC curve analysis of obesity indicators in predicting hypertension
肥胖指标 Obesity indicators AUC (95% CI) 切点值 Cutoff value 灵敏度 Sensitivity 特异度 Specificity 约登指数 Youden index P值 P value 男性 Male WC 0.632 (0.624~0.639) 86.500 0.599 0.528 0.127 < 0.001 WHtR 0.633 (0.625~0.641) 0.500 0.680 0.460 0.140 < 0.001 BMI 0.647 (0.640~0.655) 25.830 0.509 0.641 0.150 < 0.001 PI 0.642 (0.634~0.649) 14.660 0.654 0.500 0.155 < 0.001 CI 0.608 (0.600~0.615) 1.210 0.621 0.456 0.078 < 0.001 ABSI 0.603 (0.595~0.610) 0.075 0.785 0.255 0.041 < 0.001 BRI 0.632 (0.624~0.640) 3.472 0.670 0.471 0.140 < 0.001 LAP 0.632 (0.624~0.640) 31.900 0.450 0.635 0.132 < 0.001 VAI 0.608 (0.601~0.616) 1.630 0.407 0.666 0.073 < 0.001 女性 Female WC 0.668 (0.661~0.674) 82.700 0.578 0.587 0.166 < 0.001 WHtR 0.671 (0.664~0.677) 0.510 0.662 0.525 0.177 < 0.001 BMI 0.676 (0.669~0.682) 25.630 0.534 0.621 0.155 < 0.001 PI 0.675 (0.669~0.682) 16.100 0.580 0.586 0.167 < 0.001 CI 0.652 (0.646~0.659) 1.200 0.575 0.554 0.129 < 0.001 ABSI 0.648 (0.642~0.655) 0.075 0.652 0.432 0.085 < 0.001 BRI 0.670 (0.664~0.677) 3.662 0.655 0.533 0.188 < 0.001 LAP 0.665 (0.658~0.671) 30.660 0.600 0.571 0.170 < 0.001 VAI 0.652 (0.645~0.658) 1.230 0.682 0.416 0.098 < 0.001 合计 Total WC 0.655 (0.650~0.660) 82.700 0.649 0.507 0.156 < 0.001 WHtR 0.656 (0.651~0.661) 0.510 0.633 0.530 0.163 < 0.001 BMI 0.665 (0.660~0.670) 25.700 0.521 0.629 0.151 < 0.001 PI 0.660 (0.655~0.665) 15.360 0.613 0.530 0.143 < 0.001 CI 0.636 (0.631~0.641) 1.200 0.623 0.489 0.113 < 0.001 ABSI 0.631 (0.626~0.636) 0.075 0.704 0.369 0.073 < 0.001 BRI 0.655 (0.650~0.660) 3.609 0.644 0.521 0.165 < 0.001 LAP 0.651 (0.647~0.656) 30.150 0.569 0.581 0.150 < 0.001 VAI 0.634 (0.629~0.639) 1.610 0.470 0.611 0.081 < 0.001 注:BMI, 体质指数; WC, 腰围; WHtR, 腰高比; PI, 体格指数; CI, 锥度指数; ABSI:身体形态指数; BRI, 身体圆度指数; LAP, 脂质蓄积指数; VAI, 内脏脂肪指数; AUC, 曲线下面积。
Note: BMI, body mass index; WC, waist circumference; WHtR, waist height ratio; PI, ponderal index; CI, conicity index; ABSI, a body shape index; BRI, body roundness index; LAP, lipid accumulation product index; VAI, visceral adiposity index; AUC, area under the curve.
下载: 导出CSV
-
[1] Roth GA, Mensah GA, Johnson CO, et al. Global burden of cardiovascular diseases and risk factors, 1990-2019: update from the GBD 2019 study[J]. J Am Coll Cardiol, 2020, 76(25):2982-3021. DOI: 10.1016/j.jacc.2020.11.010. [2] Lu JP, Lu Y, Wang XC, et al. Prevalence, awareness, treatment, and control of hypertension in China: data from 1·7 million adults in a population-based screening study (China PEACE Million Persons Project)[J]. Lancet, 2017, 390(10112):2549-2558. DOI: 10.1016/S0140-6736(17)32478-9. [3] Xu XQ, Bao H, Tian ZX, et al. Prevalence, awareness, treatment, and control of hypertension in Northern China: a cross-sectional study[J]. BMC Cardiovasc Disord, 2021, 21(1): 525. DOI: 10.1186/s12872-021-02333-7. [4] 付莹, 袁倩, 陈旭嘉, 等. 深圳市自然人群不同肥胖指标与高血压关系的研究[J]. 中国预防医学杂志, 2021, 22(10):746-751. DOI: 10.16506/j.1009-6639.2021.10.004.Fu Y, Yuan Q, Chen XJ, et al. The association between different obesity indices and hypertension among local residents in Shenzhen[J]. Chi J Prev Med, 2021, 22(10):746-751. DOI: 10.16506/j.1009-6639.2021.10.004. [5] Dzudie A, Njedock N, Boombhi J, et al. Association between measures of adiposity and blood pressure levels in adult Cameroonians[J]. Health Sci Rep, 2021, 4(2):e259. DOI: 10.1002/hsr2.259. [6] 汪宏莉, 韩延柏, 陈涛, 等. 老年人高血压风险预测肥胖指标筛选[J]. 中国公共卫生, 2020, 36(1):105-109. DOI: 10.11847/zgggws1125126.Wang HL, Han YB, Chen T, et al. Screening on obesity indexes for predicting hypertension risk in 60-69 years old community residents[J]. Chin J Publ Heal, 2020, 36(1):105-109. DOI: 10.11847/zgggws1125126. [7] Xie X, Li Q, Zhang LM, et al. Lipid accumulation product, visceral adiposity index, and Chinese visceral adiposity index as markers of cardiometabolic risk in adult growth hormone deficiency patients: a cross-sectional study[J]. Endocr Pract, 2018, 24(1):33-39. DOI: 10.4158/EP-2017-0007. [8] Tuan NT, Adair LS, Stevens J, et al. Prediction of hypertension by different anthropometric indices in adults: the change in estimate approach[J]. Public Health Nutr, 2010, 13(5):639-646. DOI: 10.1017/S1368980009991479. [9] Gou J, Wu HY. Secular trends of population attributable risk of overweight and obesity for hypertension among Chinese adults from 1991 to 2011[J]. Sci Rep, 2021, 11(1):6371. DOI: 10.1038/s41598-021-85794-2. [10] 杨静, 王飞, 韩煦, 等. 人体测量学指标与老年人群高血压发病风险的前瞻性队列研究[J]. 中华预防医学杂志, 2019, 53(3):272-278. DOI: 10.3760/cma.j.issn.0253-9624.2019.03.011.Yang J, Wang F, Han X, et al. Different anthropometric indices and incident risk of hypertension in elderly population: a prospective cohort study[J]. Chin J Prev Med, 2019, 53(3):272-278. DOI: 10.3760/cma.j.issn.0253-9624.2019.03.011. [11] Zhou ZQ, Hu DY, Chen J. Association between obesity indices and blood pressure or hypertension: which index is the best?[J]. Public Health Nutr, 2009, 12(8):1061-1071. DOI: 10.1017/s1368980008003601. [12] Chen YZ, Zhang ZL, Wang JH, et al. Sex differences in the association of abdominal adipose tissue and anthropometric data with untreated hypertension in a Chinese population[J]. Biol Sex Differ, 2020, 11(1):38. DOI: 10.1186/s13293-020-00317-4. [13] Dzudie A, Njedock N, Boombhi J, et al. Association between measures of adiposity and blood pressure levels in adult Cameroonians[J]. Health Sci Rep, 2021, 4(2):e259. DOI: 10.1002/hsr2.259. [14] 史青云, 陈炳华, 罗婉榕, 等. 成年人不同肥胖评价指标对高血压患病风险预测效果的比较[J]. 西安交通大学学报(医学版), 2022, 43(4): 581-587. DOI: 10.7652/jdyxb202204017.Shi QY, Chen BH, Luo WR, et al. Comparison of different obesity indices in predicting risk of hypertension among adults in Gansu Province[J]. Journal of Xi'an Jiaotong University (Medcical Sciences), 2022, 43(4):581-587. DOI: 10.7652/jdyxb202204017. [15] Zhang P, Wang R, Gao CS, et al. Types of obesity and its association with the clustering of cardiovascular disease risk factors in Jilin Province of China[J]. Int J Environ Res Public Health, 2016, 13(7):685. DOI: 10.3390/ijerph13070685. [16] 中国肥胖问题工作组数据汇总分析协作组. 我国成人体重指数和腰围对相关疾病危险因素异常的预测价值:适宜体重指数和腰围切点的研究[J]. 中华流行病学杂志, 2002(1):10-15. DOI: 10.3760/j.issn:0254-6450.2002.01.003.China Obesity Working Group Data Aggregation and Analysis Collaborative Group. Predictive value of adult body mass index and waist circumference on abnormal risk factors of related diseases in my country: a study of appropriate body mass index and waist circumference cut-off points[J]. Chin J Epidemiol, 2002(1):10-15. DOI: 10.3760/j.issn:0254-6450.2002.01.003. -

 点击查看大图
计量
- 文章访问数: 157
- HTML全文浏览量: 76
- PDF下载量: 9
- 被引次数: 0