

-
摘要:
目的 基于代谢组学的方法,揭示纳米塑料长期暴露对机体代谢的动态影响。 方法 13月龄的C57BL/6J雄鼠以0、1、10 mg/kg剂量的纳米聚苯乙烯(polystyrene nanoparticles, PS-NPs)进行灌胃,灌胃暴露时长为9个月。分别于暴露第1、3、6、9个月,处死部分小鼠并收集其血液。最后采用TM广靶代谢组学技术对血清差异代谢物进行分析。 结果 同剂量组内不同暴露时间节点(暴露第1、3、6、9个月)的样本点均能明显分离,发现尿胆素含量随暴露时长的增加而减少,并与卟啉与叶绿素代谢通路密切相关。在长期暴露结束后(暴露第9个月),在对照组与不同暴露剂量组间比较中共发现135个差异代谢物。其中50个代谢物含量上调,85个代谢物含量下调。聚类分析发现,花生四烯酸代谢和嘌呤代谢通路是主要的受干扰通路,与该通路相关的差异代谢物含量(2,3-dinor-8异前列腺素F2α、黄嘌呤、2-脱氧肌苷、腺苷-3′-磷酸、次黄嘌呤等)均明显上调。 结论 小鼠在长期的PS-NPs暴露过程(中年-老年)中,其血清代谢谱发生改变。其中,尿胆素与PS-NPs暴露时长相关,是潜在的敏感标志物。2,3-dinor-8异前列腺素F2α、黄嘌呤等是潜在的特异性标志物,这些代谢物提示花生四烯酸代谢和嘌呤代谢通路是研究PS-NPs暴露损伤的可能机制通路。 Abstract:Objective To exposure the dynamic effects of nano-plastics on the body′s metabolism during long-term exposure based on the method of metabolomics. Methods Male C57BL/6J mice, aged 13 months, were exposed to polystyrene nanoparticles (PS-NPs) at doses of 0, 1 and 10 mg/kg over a period of 9 months via gastric lavage. After one, three, six, and nine months intervals post-exposure, random selected mice from each group were killed and their blood samples collected. Subsequently, the technique of TM wide-target metabolomics was utilized for the classification of serum differential metabolites. Results The sample points of different exposure time nodes (first, third, sixth, and ninth months) within the same dose group were distinguishable. It was discovered that the urobilin content decreased as exposure time increased and was closely related to the metabolic pathways of porphyrin and chlorophyll. After long-term exposure (nine months), 135 distinct metabolites were identified in the comparison between the control group and groups with varying exposure doses. Out of these, 50 metabolites were upregulated and 85 metabolites were downregulated. Cluster analysis revealed that arachidonic acid metabolism and purine metabolism pathway were the most perturbed. The contents of differential metabolites associated with these pathways (e.g., 2,3-dinor-8-iso Prostaglandin F2α, Xanthine, 2′-Deoxyinosine, 3′-Aenylic Acid, Hypoxanthine) were markedly upregulated. Conclusions The serum metabolic profile of mice changed exposed to PS-NPs for extended exposure was altered (from middle age to old age). Among the altered differential metabolites, urobilin is linked to the duration of PS-NPs exposure and is a potential sensitive marker. In addition, 2,3-dinor-8-iso Prostaglandin F2α and Xanthine are potential specific markers. These metabolites suggest the pathways for the metabolism of arachidonic acid and purines are potential mechanisms for studying PS-NPs exposure damage. -
Key words:
- Nano polystyrene /
- Metabonomics /
- Arachidonic acid metabolism /
- Purine metabolism
-

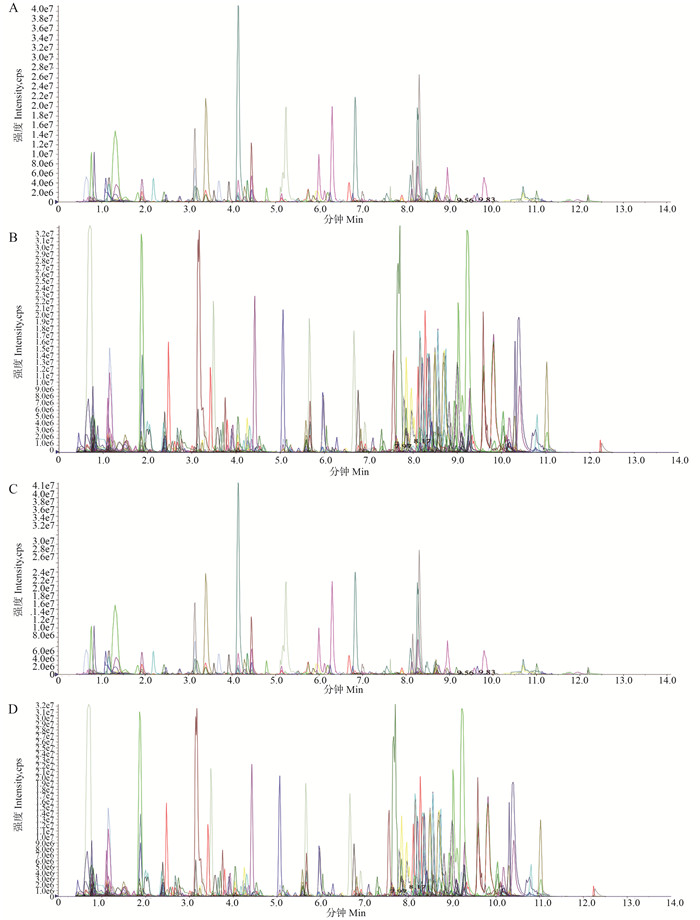
图 1 QC样本质谱检测总离子流图和MRM代谢物质谱检测多峰图
QC:质控样本;MRM:三重四极杆质谱的多反应监测模式。
①横坐标为代谢物检测的保留时间(retention time, Rt),纵坐标为离子检测的离子流强度(强度单位为cps, count per second)。②图 1A负离子模式下,QC样本质谱检测总离子流图;图 1B正离子模式下,QC样本质谱检测总离子流图;图 1C负离子模式下,MRM代谢物质谱检测离子流图;图 1D正离子模式下,MRM代谢物质谱检测离子流图。Figure 1. QC sample mass spectrum detection total ion flow figure and MRM metabolite mass spectrum detection multi-peak figure
QC: Quality control sample; MRM: Triple quadrupole mass spectrometry multiple reaction monitoring.
①The horizontal coordinate is the retention time (Rt) of metabolite detection, and the vertical coordinate is the ion current intensity of ion detection (the intensity unit is cps, count per second). ②Figure 1A, QC sample mass spectrum detection total ion flow figure in the negative ion mode; Figure 1B, QC sample mass spectrum detection total ion flow figure in positive ion mode; Figure 1C, Ion flow pattern detected by MRM metabolic mass spectrometry in negative ion mode; Figure 1D, Ion flow diagram of MRM metabolic mass spectrometry detection in positive ion mode.
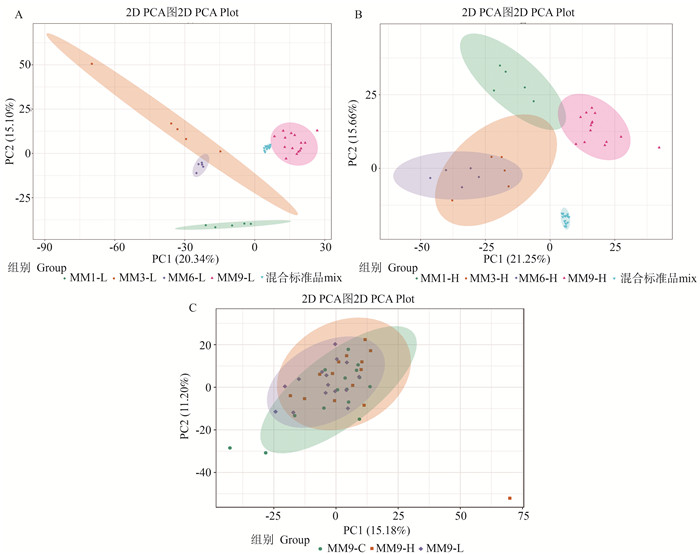
图 2 PCA得分图
1. PCA:主成分分析。
①图 2A低剂量组小鼠在PS-NPs暴露过程血清代谢物的PCA得分图;图 2B高剂量组小鼠在PS-NPs暴露过程血清代谢物的PCA得分图;图 2C各组小鼠在PS-NPs暴露第9个月时的血清代谢物的PCA得分图。②组名命名格式为M(雄鼠)+M(暴露时长单位:月)+数字(暴露时长)-C/L/H(剂量组名),如MM1-L vs MM3-L表示为雄鼠低剂量暴露第1个月和第3个月的比较(暴露第1个月为对照组)。Figure 2. PCA score chart
1. PCA: principal component analysis.
①Figure 2A PCA score of serum metabolites in low-dose group during PS-NPs exposure; Figure 2B PCA score of serum metabolites in high-dose group during PS-NPs exposure; Figure 2C PCA scores of serum metabolites of mice in each group at 9 months of PS-NPs exposure. ②The format of group name was M (male mice)+M (unit of exposure duration: month)+number (exposure duration)-C/L/H (name of dose group), such as MM1-L∶MM3-L represented in the comparison between the first and third months of low dose exposure of male mice (the first month of exposure during was the control group).
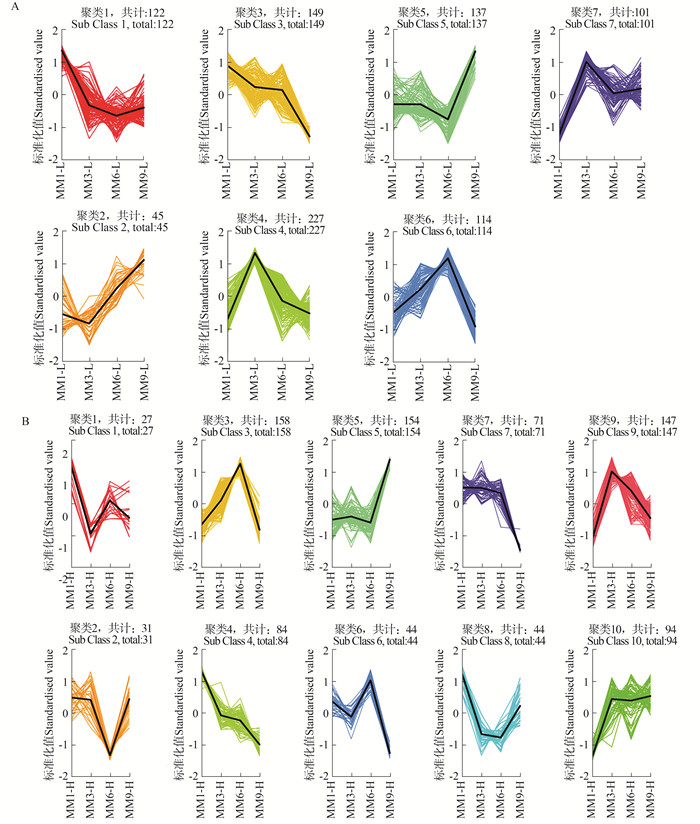
图 3 不同剂量组内不同时间节点差异代谢物的聚类分析图
①图 3A为低剂量暴露不同时间节点差异代谢物的聚类分析图;图 3B为高剂量暴露不同时间节点差异代谢物的聚类分析图。②组名命名格式为M(雄鼠)+M(暴露时长单位:月)+数字(暴露时长)-C/L/H(剂量组名),如MM1-L vs MM3-L表示为雄鼠低剂量暴露第1个月和第3个月的比较(暴露第1个月为对照组)。
Figure 3. Cluster analysis figure of different metabolites at different time points in different dose groups
①Figure 3A shows the cluster analysis of differential metabolites at different time nodes of low dose exposure; Figure 3B shows the cluster analysis of different metabolites at different time nodes of high dose exposure. ②The format of group name was M (male mice) +M (unit of exposure duration: month)+number (exposure duration)-C/L/H (name of dose group), such as MM1-L vs MM3-L represented in the comparison between the first and third months of low dose exposure of male mice (the first month of exposure during was the control group).

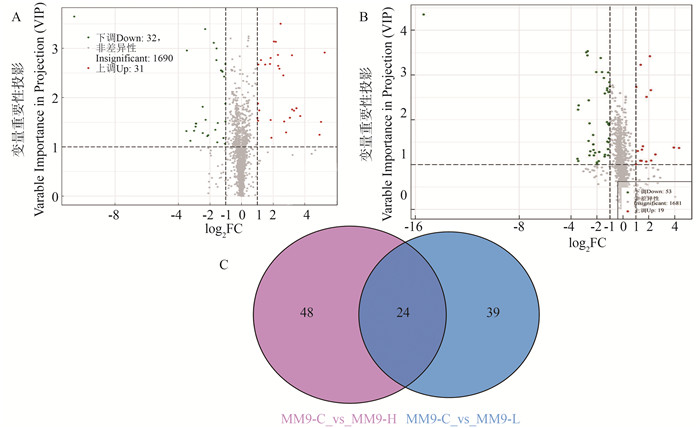
图 4 暴露终点时,对照组与不同暴露剂量组间差异代谢物图
①图 4A为对照组与低剂量比较差异代谢物火山图;图 4B为对照组与高剂量比较差异代谢物火山图;图 4C为各组差异代谢物韦恩图。②组名命名格式为M(雄鼠)+M(暴露时长单位:月)+数字(暴露时长)-C/L/H(剂量组名),如MM9-C vs MM9-H表示为雄鼠暴露第9个月时,对照组和高剂量组的比较。
Figure 4. Metabolite map of difference between control group and different exposure dose groups at the end point of exposure
① Figure 4A shows the volcanic map of different metabolites in comparison between the control group and low dose group. Figure 4B shows the volcanic map of the difference metabolites in the comparison between the control group and the high dose group. Figure 4C shows the Venn diagram of different metabolites in each group. ②The format of group name was M (male mice)+M (unit of exposure duration: month)+number (exposure duration)-C/L/H (name of dose group), such as MM9-C vs MM9-H represented in the comparison between the control group and high dose group of male mice after nine months exposure.

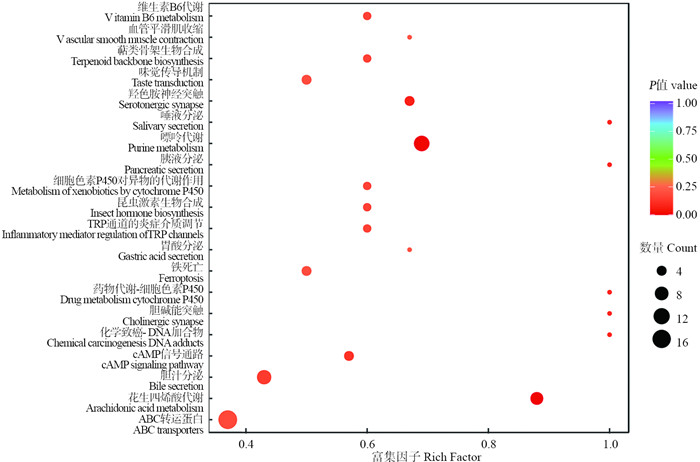
图 5 各组差异代谢物KEGG富集分析气泡图
TRP: 瞬时受体电位; cAMP: 一种环状核苷酸; ABC: 腺苷三磷酸结合盒。
横坐标为每个通路对应的富集因子(Rich factor),纵坐标为通路名称,点的颜色为P值,越红表示富集越显著。点越大代表富集到的差异代谢物越多。Figure 5. KEGG enrichment analysis bubble chart of different metabolites in each group
TRP: transient receptor potential; cAMP: Cyclic Adenosine monophosphate; ABC: ATP-binding cassette.
The horizontal coordinate is the Rich factor which corresponding to each pathway, the vertical coordinate is the path name, the color of the dot is P value, the more red the concentration, the more significant. The larger of the dot, which means the more differentiated metabolites are enriched.表 1 暴露过程中动态变化的敏感性代谢物
Table 1. Sensitive metabolites that dynamically change during exposure
物质Compounds 变化趋势Change trend 差异倍数Fold change MM1-L∶ MM3-L MM1-L∶ MM6-L MM1-L∶ MM9-L MM1-H∶ MM3-H MM1-H∶ MM6-H MM1-H∶ MM9-H 尿胆素Urobilin ↓ 0.30 0.19 0.16 0.37 0.31 0.23 肉碱C10∶1异构体1 arnitine C10∶1 Isomer1 ↓ 0.37 0.44 0.29 0.44 0.46 0.27 肉碱C10∶1 Carnitine C10∶1 ↓ 0.41 0.43 0.36 0.39 0.44 0.32 N, N-Bis (2-hydroxyethyl) dodecanamide ↓ 0.43 0.40 0.40 0.37 0.39 0.38 Ile-Trp-OH ↓ 0.38 0.39 0.32 0.42 0.48 0.30 1-花生四烯酰甘油1-Arachidonoylglycerol ↑ 12 807.18 40 984.89 35 542.59 7 638.76 39 517.11 32 862.78 His-Gln-Thr ↑ 4.53 4.76 7.73 6.31 3.17 6.48 注:①变化趋势=暴露组/对照组,大于1则含量上调,反之则含量下调。②组名命名格式为M(雄鼠)+M(暴露时长单位:月)+数字(暴露时长)-C/L/H(剂量组名),如MM1-L vs MM3-L表示为雄鼠低剂量暴露第1个月和第3个月的比较(暴露第1个月为对照组)。
Note: ① Change trend=exposure group/control group, if the content is greater than 1, the content is up-regulated, and vice versa. ② The format of group name was M (male mice)+M (unit of exposure duration: month)+number (exposure duration)-C/L/H (name of dose group), such as MM1-L∶MM3-L represented in the comparison between the first and third months of low dose exposure of male mice (the first month of exposure during was the control group). 下载: 导出CSV
表 2 暴露终点时与特异性差异代谢物相关的代谢通路
Table 2. Metabolic pathways associated with specific differential metabolites at the end point of exposure
物质Compounds 变化趋势Change trend VIP值value 代谢通路名称Metabolic pathway name 代谢通路P值Metabolic pathway P value 2,3-dinor-8异前列腺素F2α 2,3-dinor-8-iso Prostaglandin F2α ↑ 1.64 花生四烯酸代谢Arachidonic acid metabolism 0.0012 15-脱氧-δ12,14-前列腺素J215-deoxy-δ-12,14-PGJ2 ↑ 1.05 花生四烯酸代谢Arachidonic acid metabolism 黄嘌呤Xanthine ↑ 3.10 嘌呤代谢Purine metabolism 0.0013 L-谷氨酰胺L-Glutamine ↑ 1.50 嘌呤代谢Purine metabolism 2-脱氧肌苷2′-Deoxyinosine ↑ 3.71 嘌呤代谢Purine metabolism 腺苷-3′-磷酸3′-Aenylic Acid ↑ 1.46 嘌呤代谢Purine metabolism 腺苷Adenosine ↑ 1.67 嘌呤代谢Purine metabolism 2′-脱氧鸟苷Deoxyguanosine ↑ 1.67 嘌呤代谢Purine metabolism 鸟苷Guanosine ↑ 3.05 嘌呤代谢Purine metabolism 次黄嘌呤Hypoxanthine ↑ 1.38 嘌呤代谢Purine metabolism 肌苷Inosine ↑ 1.88 嘌呤代谢Purine metabolism 注:1.VIP:变量重要性投影。
①变化趋势=暴露组/对照组,大于1则含量上调,反之则含量下调。②VIP:该值越大,差异代谢物越有意义。
Note: 1.VIP: variable importance in projection.
①Change trend=exposure group/control group, if the content is greater than 1, the content is up-regulated, and vice versa. ②VIP: The differential metabolites are more significant if the value is greater.
下载: 导出CSV
-
[1] Andrady AL, Neal MA. Applications and societal benefits of plastics[J]. Philos Trans R Soc Lond B Biol Sci, 2009, 364(1526): 1977-1984. DOI: 10.1098/rstb.2008.0304. [2] Thompson RC, Moore CJ, vom Saal FS, et al. Plastics, the environment and human health: current consensus and future trends[J]. Philos Trans R Soc Lond B Biol Sci, 2009, 364(1526): 2153-2166. DOI: 10.1098/rstb.2009.0053. [3] van Wijnen J, Ragas AMJ, Kroeze C. Modelling global river export of microplastics to the marine environment: sources and future trends[J]. Sci Total Environ, 2019, 673: 392-401. DOI: 10.1016/j.scitotenv.2019.04.078. [4] Huerta Lwanga E, Mendoza Vega J, Quej VK, et al. Field evidence for transfer of plastic debris along a terrestrial food chain[J]. Sci Rep, 2017, 7(1): 14071. DOI: 10.1038/s41598-017-14588-2. [5] Toussaint B, Raffael B, Angers-Loustau A, et al. Review of micro- and nanoplastic contamination in the food chain[J]. Food Addit Contam Part A Chem Anal Control Expo Risk Assess, 2019, 36(5): 639-673. DOI: 10.1080/19440049.2019.1583381. [6] Yee MSL, Hii LW, Looi CK, et al. Impact of microplastics and nanoplastics on human health[J]. Nanomaterials (Basel), 2021, 11(2): 496. DOI: 10.3390/nano11020496. [7] Zarus GM, Muianga C, Hunter CM, et al. A review of data for quantifying human exposures to micro and nanoplastics and potential health risks[J]. Sci Total Environ, 2021, 756: 144010. DOI: 10.1016/j.scitotenv.2020.144010. [8] Bisesi JH, Merten J, Liu K, et al. Tracking and quantification of single-walled carbon nanotubes in fish using near infrared fluorescence[J]. Environ Sci Technol, 2014, 48(3): 1973-1983. DOI: 10.1021/es4046023. [9] Manabe M, Tatarazako N, Kinoshita M. Uptake, excretion and toxicity of nano-sized latex particles on medaka (Oryzias latipes) embryos and larvae[J]. Aquat Toxicol, 2011, 105(3-4): 576-581. DOI: 10.1016/j.aquatox.2011.08.020. [10] van Pomeren M, Brun NR, Peijnenburg WJGM, et al. Exploring uptake and biodistribution of polystyrene (nano) particles in zebrafish embryos at different developmental stages[J]. Aquat Toxicol, 2017, 190: 40-45. DOI: 10.1016/j.aquatox.2017.06.017. [11] Duis K, Coors A. Microplastics in the aquatic and terrestrial environment: sources (with a specific focus on personal care products), fate and effects[J]. Environ Sci Eur, 2016, 28(1): 2. DOI: 10.1186/s12302-015-0069-y. [12] Baldwin AK, Corsi SR, Mason SA. Plastic debris in 29 great lakes tributaries: relations to watershed attributes and hydrology[J]. Environ Sci Technol, 2016, 50(19): 10377-10385. DOI: 10.1021/acs.est.6b02917. [13] Lithner D, Larsson A, Dave G. Environmental and health hazard ranking and assessment of plastic polymers based on chemical composition[J]. Sci Total Environ, 2011, 409(18): 3309-3324. DOI: 10.1016/j.scitotenv.2011.04.038. [14] Sadri SS, Thompson RC. On the quantity and composition of floating plastic debris entering and leaving the Tamar Estuary, Southwest England[J]. Mar Pollut Bull, 2014, 81(1): 55-60. DOI: 10.1016/j.marpolbul.2014.02.020. [15] Della Torre C, Bergami E, Salvati A, et al. Accumulation and embryotoxicity of polystyrene nanoparticles at early stage of development of sea urchin embryos Paracentrotus lividus[J]. Environ Sci Technol, 2014, 48(20): 12302-12311. DOI: 10.1021/es502569w. [16] Qiao RX, Deng YF, Zhang SH, et al. Accumulation of different shapes of microplastics initiates intestinal injury and gut microbiota dysbiosis in the gut of zebrafish[J]. Chemosphere, 2019, 236: 124334. DOI: 10.1016/j.chemosphere.2019.07.065. [17] Lai WC, Xu D, Li JM, et al. Dietary polystyrene nanoplastics exposure alters liver lipid metabolism and muscle nutritional quality in carnivorous marine fish large yellow croaker (Larimichthys crocea)[J]. J Hazard Mater, 2021, 419: 126454. DOI: 10.1016/j.jhazmat.2021.126454. [18] Pang MX, Wang Y, Tang YJ, et al. Transcriptome sequencing and metabolite analysis reveal the toxic effects of nanoplastics on tilapia after exposure to polystyrene[J]. Environ Pollut, 2021, 277: 116860. DOI: 10.1016/j.envpol.2021.116860. [19] Amereh F, Eslami A, Fazelipour S, et al. Thyroid endocrine status and biochemical stress responses in adult male wistar rats chronically exposed to pristine polystyrene nanoplastics[J]. Toxicol Res (Camb), 2019, 8(6): 953-963. DOI: 10.1039/c9tx00147f. [20] Xu DH, Ma YH, Han XD, et al. Systematic toxicity evaluation of polystyrene nanoplastics on mice and molecular mechanism investigation about their internalization into Caco-2 cells[J]. J Hazard Mater, 2021, 417: 126092. DOI: 10.1016/j.jhazmat.2021.126092. [21] Bai ZA, Wang N, Wang MH. Effects of microplastics on marine copepods[J]. Ecotoxicol Environ Saf, 2021, 217: 112243. DOI: 10.1016/j.ecoenv.2021.112243. [22] Chen S, Zhang MY, Bo L, et al. Metabolomic analysis of the toxic effect of chronic exposure of cadmium on rat urine[J]. Environ Sci Pollut Res Int, 2018, 25(4): 3765-3774. DOI: 10.1007/s11356-017-0774-8. [23] Tanaka M, Fukui M, Okada H, et al. Low serum bilirubin concentration is a predictor of chronic kidney disease[J]. Atherosclerosis, 2014, 234(2): 421-425. DOI: 10.1016/j.atherosclerosis.2014.03.015. [24] Kang HM, Ahn SH, Choi P, et al. Defective fatty acid oxidation in renal tubular epithelial cells has a key role in kidney fibrosis development[J]. Nat Med, 2015, 21(1): 37-46. DOI: 10.1038/nm.3762. [25] Miyazaki Y, Nakamura T, Takenouchi S, et al. Urinary 8-iso PGF2α and 2,3-dinor-8-iso PGF2α can be indexes of colitis-associated colorectal cancer in mice[J]. PLoS One, 2021, 16(1): e0245292. DOI: 10.1371/journal.pone.0245292. [26] Tusa NV, Abuelo A, Levy NA, et al. Peripheral biomarkers of oxidative stress in dogs with acute pancreatitis[J]. J Vet Intern Med, 2022, 36(6): 1958-1965. DOI: 10.1111/jvim.16535. [27] Wang TQ, Fu XJ, Chen QF, et al. Arachidonic acid metabolism and kidney inflammation[J]. Int J Mol Sci, 2019, 20(15): 3683. DOI: 10.3390/ijms20153683. [28] Cao J, Liao YC, Yang WS, et al. Enhanced microalgal toxicity due to polystyrene nanoplastics and cadmium co-exposure: from the perspective of physiological and metabolomic profiles[J]. J Hazard Mater, 2022, 427: 127937. DOI: 10.1016/j.jhazmat.2021.127937. [29] Roy S, Rizvi ZA, Awasthi A. Metabolic checkpoints in differentiation of helper T cells in tissue inflammation[J]. Front Immunol, 2019, 9: 3036. DOI: 10.3389/fimmu.2018.03036. [30] Jiang QC, Chen XH, Jiang HC, et al. Effects of acute exposure to polystyrene nanoplastics on the channel catfish larvae: insights from energy metabolism and transcriptomic analysis[J]. Front Physiol, 2022, 13: 923278. DOI: 10.3389/fphys.2022.923278. -

 点击查看大图
计量
- 文章访问数: 136
- HTML全文浏览量: 32
- PDF下载量: 4
- 被引次数: 0