The application of the sum of single effects regression model for colocalization analysis in multi-omics data
-
摘要:
目的 探讨单效应汇总(sum of single effects, SuSiE)回归模型在多组学数据共定位分析中的应用。 方法 以多组学模拟数据为例,介绍单效应汇总回归模型的基本原理和R软件分析。 结果 SuSiE回归模型通过利用单核苷酸多态性(single nucleotide polymorphism,SNPs)位点之间因连锁不平衡(linkage disequilibrium,LD)产生的相关性,允许在有多个因果变异的情况下,正确识别两个组学数据与表型相关的共定位点。 结论 相对于传统方法,SuSiE回归模型拓展了单一因果变异假设这一适用条件,且计算效率较高,从而有助于利用多组学数据检测多个潜在与疾病相关联位点。 Abstract:Objective To explore the application of the sum of single effects (SuSiE) regression model for colocalization analysis with multi-omics data. Methods Taking the simulated data as an example, we introduced the basic principle of SuSiE regression model and the statistical analysis procedures using R software. Results The results showed that the SuSiE regression model could identify the shared casual variants as associated with traits through taking account the linkage disequilibrium (LD) between single nucleotide polymorphisms (SNPs). Despite the presence of multiple causal variants, the colocalization results were still stable. Conclusions Compared with those traditional approaches for colocalization, SuSiE regression model expands the applicability of the single causal variant hypothesis and it has higher computational efficiency, thus helping to detect multiple potential shared casual variants using multi-omics data. -
Key words:
- Multi-omics /
- Colocalization /
- Approximate Bayes factor /
- Casual variants
-
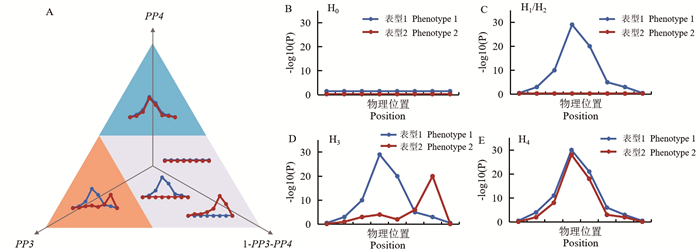
图 1 共定位分析后验概率及检验假设示意图
A为三元图,蓝色区域对应于共定位的高概率(PP4>50%),橙色区域对应于两种表型为不同因果变异的高概率(PP3>50%),灰色区域对应于未能确定或拒绝共定位的概率。B、C、D、E分别为H0~H4示意图。
Figure 1. The schematic diagram of the posteriori probabilities of colocalization analyse and the five hypotheses
A is a triplet plot, where the blue area corresponds to a high probability of colocalization (PP4 > 50%), the orange area corresponds to a high probability of the two phenotypes having different causal variations (PP3 > 50%), and the gray area corresponds to a probability of failing to determine or rejecting colocalization. B, C, D and E are H0-H4 respectively.
图 4 SuSiE共定位分析先验概率p12敏感性分析结果
左侧是基因组和转录组的局部曼哈顿图。右侧为不同p12值时H0~H4假设的先验概率和后验概率,绿色框表示PP4 > 0.9,虚线表示当前的p12值,该值位于绿色框内,表明p12设为当前值时PP4 > 0.9的结论稳定。
Figure 4. The sensitivity analysis result of the prior probability p12 for SuSiE colocalization analysis
On the left is a local Manhattan map of the genome and transcriptome. The right side is the prior probability and posterior probability of H0-H4 hypothesis with different p12 values, and the green box represents PP4 > 0.9, the dotted line indicates the current p12 value. The value is in the green box, indicating that when the p12 is set to the current value PP4 > The conclusion of 0.9 is stable.
-
[1] Tam V, Patel N, Turcotte M, et al. Benefits and iimitations of genome-wide association studies[J]. Nat Rev Genet, 2019, 20(8): 467-484. DOI: 10.1038/s41576-019-0127-1. [2] Kia DA, Zhang D, Guelfi S, et al. Identification of candidate parkinson disease genes by integrating genome-wide association study, expression, and epigenetic data sets[J]. JAMA Neurol, 2021, 78(4): 464-472. DOI: 10.1001/jamaneurol.2020.5257. [3] Giambartolomei C, Vukcevic D, Schadt EE, et al. Bayesian test for colocalisation between pairs of genetic association studies using summary statistics. PLoS Genet[J]. PLoS Genet, 2014, 10(5): e1004383. DOI: 10.1371/journal.pgen.1004383. [4] Wallace C. A more accurate method for colocalisation analysis allowing for multiple causal variants[J]. PLoS Genet, 2021, 17(9): e1009440. DOI: 10.1371/journal.pgen.1009440. [5] Barbeira AN, Dickinson SP, Bonazzola R, et al. Exploring the phenotypic consequences of tissue specific gene expression variation inferred from GWAS summary statistics[J]. Nat Commun, 2018, 9(1): 1825. DOI: 10.1038/s41467-018-03621-1. [6] Wang G, Sarkar A, Carbonetto P, et al. A simple new approach to variable selection in regression, with application to genetic fine mapping[J]. J R Stat Soc Series B Stat Methodol, 2020, 82(5): 1273-1300. DOI: 10.1111/rssb.12388. [7] Berisa T, Pickrell JK. Approximately independent linkage disequilibrium blocks in human populations[J]. Bioinformatics, 2016, 32(2): 283-285. DOI: 10.1093/bioinformatics/btv546. [8] Chung RH, Kang CY. A multi-omics data simulator for complex disease studies and its application to evaluate multi-omics data analysis methods for disease classification[J]. Gigascience, 2019, 8(5): giz045. DOI: 10.1093/gigascience/giz045. [9] Wallace C. Eliciting priors and relaxing the single causal variant assumption in colocalisation analyses[J]. PLoS Genet, 2020, 16(4): e1008720. DOI: 10.1371/journal.pgen.1008720. [10] Lin JF, Zhou JW, Xu Y. Potential drug targets for multiple sclerosis identified through Mendelian randomization analysis[J]. Brain, 2023, 146(8): 3364-3372. DOI: 10.1093/brain/awad070. [11] Yuan MN, Wei LX, Zhou RS, et al. Four FCRL3 gene polymorphisms (FCRL3_3, _5, _6, _8) confer susceptibility to multiple sclerosis: results from a case-control study[J]. Mol Neurobiol, 2016, 53(3): 2029-2035. DOI: 10.1007/s12035-015-9149-7. [12] O'Connell P, Blake MK, Godbehere S, et al. SLAMF7 modulates B cells and adaptive immunity to regulate susceptibility to CNS autoimmunity[J]. J Neuroinflammation, 2022, 19(1): 241. DOI: 10.1186/s12974-022-02594-9. [13] Albert FW, Kruglyak L. The role of regulatory variation in complex traits and disease[J]. Nat Rev Genet, 2015, 16(4): 197-212. DOI: 10.1038/nrg3891. -


 下载:
下载:


