

Analysis of mortality status and cause-eliminated life expectancy by region in China
-
摘要:
目的 分析1990―2019年中国慢性肾病的发病时间趋势,评估年龄、时期和队列效应,并预测2020―2034年中国慢性肾病的发病情况,为慢性肾病相关防治政策和措施提供参考依据。 方法 利用2019全球疾病负担研究(Global Burden of Disease Study 2019, GBD 2019)数据,应用Joinpoint回归模型分析不同性别慢性肾病发病趋势变化并计算年度变化百分比(annual percentage change, APC)与平均年度变化百分比(average annual percentage change, AAPC);借助年龄-时期-队列模型分析年龄、时期及队列因素对不同性别慢性肾病发病率的影响;采用贝叶斯年龄-时期-队列分析方法预测2020―2034年不同性别慢性肾病的发病率和发病人数。 结果 1990―2019年中国全人群和男、女性慢性肾病标准化发病率总体均呈上升趋势(AAPC=0.30%、0.30%、0.29%, 均P < 0.001),女性在1993―1996年(APC=-0.54%, P=0.073)无规律变化,女性较男性有更高的发病率, 但近年男性发病率增长速度远高于女性。中国慢性肾病发病率变化受年龄、时期、队列因素影响(均P < 0.001),慢性肾病发病风险总体上随年龄增加而增加,在60岁之后明显上升;在1995年之后随时期持续上升;在2005年之前随出生队列上升,在2005年之后随出生队列下降。2020―2034年中国慢性肾病标化发病率和发病人数预计呈上升趋势,且男性增长幅度高于女性。 结论 1990―2019年中国慢性肾病发病率和发病人数总体不断升高。建议加强对老年人以及高血压和糖尿病患者等高危人群的防护和婴幼儿的营养摄入和健康检查。 Abstract:Objective To analyze the incidence time trend of chronic kidney disease (CKD) in China from 1990 to 2019, evaluate its age, period and cohort effect, and predict the incidence of chronic kidney disease in China from 2020 to 2034, so as to provide reference for relevant prevention and treatment policies and measures of CKD. Methods Based on the data of the Global Burden of Disease Study 2019(GBD 2019), the Joinpoint regression model was used to analyze the trend change of chronic kidney disease in different genders, and the annual percentage change (APC) and the average annual percentage change (AAPC) were calculated. With the help of age-period-cohort model, the influence of age, period and cohort factors on the incidence of CKD in different sexes was analyzed. Bayesian age-period-cohort analysis was used to predict the incidence and number of CKD in different gender from 2020 to 2034. Results From 1990 to 2019, the standardized incidence rate of CKD in the entire population, as well as among men and women in China, demonstrated an overall upward trajectory (AAPC=0.30%, 0.30%, 0.29%, all P < 0.001). Notably, there was an irregular variation observed in women during the years 1993-1996 (APC=-0.54%, P=0.073), with females exhibiting a higher incidence rate than males. However, the incidence rate in males has escalated at a significantly higher pace than that in females in recent years. The fluctuations in chronic kidney disease incidence in China were influenced by age, period, and cohort factors (all P < 0.001). The overall risk of CKD increased with age, experiencing a notable rise after the age of 60. Furthermore, the incidence continued to rise post-1995, associated with birth cohorts before 2005, and demonstrated a decline after 2005. Projections for the period from 2020 to 2034 anticipate an upward trend in the standardized incidence rate and the number of cases of chronic kidney disease in China, with a more pronounced increase among males compared to females. Conclusions From 1990 to 2019, the incidence rate and the number of cases of CKD in China demonstrated a continuous upward trend. It is advisable to bolster preventive measures for the elderly and high-risk populations, particularly individuals with hypertension and diabetes. Moreover, careful consideration should be given to the nutritional intake and health assessments of infants and young children. -
Key words:
- Mortality /
- Rank order of death causes /
- Life expectancy /
- Trend
-

图 1 2010、2015、2020年东(A)、中(B)、西(C)部地区人口主要疾病死因寿命延长数
Figure 1. Cause-eliminated life expectancy extention in regions East(A), Central(B), West(C) in 2000, 2015 and 2020

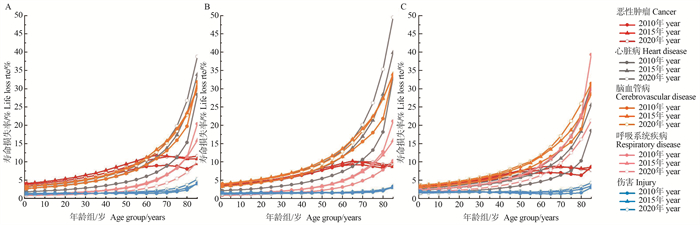
图 2 2010、2015、2020年东(A)、中(B)、西(C)部地区人口主要疾病死因寿命损失率
Figure 2. Potential years of life lost rate of major diseases in regions East(A), Central(B), West(C) in 2000, 2015 and 2020
表 1 2010、2015、2020年分地区人口死亡率
Table 1. Mortality rate by region in 2010, 2015 and 2020
地区Region 粗死亡率/100 000-1
Crude death rate/100 000-1年龄标化死亡率/100 000-1
Age-standardized death rate/100 000-1Z值value P值value 东部Eastern region 52.08 < 0.001 2020年year 680.25 628.57 2015年year 674.00 747.71 2010年year 573.93 910.68 中部Central region 55.55 < 0.001 2020年year 676.25 722.55 2015年year 629.66 819.23 2010年year 588.01 1 051.98 西部Western region 54.78 < 0.001 2020年year 674.22 789.82 2015年year 640.63 838.66 2010年year 561.70 1 056.37 注:Z值,各地区的粗死亡率进行Cochran-Armitage趋势检验的Z统计量。
Note: Z value, Z-statistic after Cochran-Armitage trend test for regional crude death rate. 下载: 导出CSV
表 2 2010、2015、2020年分地区人口期望寿命表
Table 2. Life expectancy table by region in 2010, 1015 and 2020
年龄组/岁
Age group/years东部Eastern region 中部Central region 西部Western region 2010年
year2015年
year2020年
year2010年
year2015年
year2020年
year2010年
year2015年
year2020年
year0~ < 1 78.01 79.22 81.16 76.28 78.09 79.67 75.37 77.31 78.44 1~ < 5 77.30 78.48 80.29 75.61 77.37 78.82 75.08 76.73 77.64 5~ < 10 73.42 74.57 76.35 71.77 73.49 74.89 71.40 72.93 73.74 10~ < 15 68.48 69.62 71.40 66.85 68.55 69.94 66.54 68.03 68.83 15~ < 20 63.55 64.69 66.46 61.94 63.64 65.01 61.65 63.13 63.91 20~ < 25 58.65 59.77 61.55 57.03 58.72 60.10 56.79 58.26 59.01 25~ < 30 53.78 54.84 56.63 52.16 53.80 55.18 51.99 53.39 54.13 30~ < 35 48.91 49.96 51.70 47.30 48.96 50.28 47.22 48.60 49.27 35~ < 40 44.08 45.12 46.82 42.48 44.13 45.43 42.48 43.87 44.44 40~ < 45 39.29 40.29 41.98 37.70 39.32 40.60 37.77 39.11 39.67 45~ < 50 34.58 35.54 37.21 33.01 34.61 35.85 33.17 34.49 34.95 50~ < 55 29.97 30.87 32.50 28.44 29.96 31.19 28.69 29.91 30.37 55~ < 60 25.43 26.41 27.92 23.98 25.65 26.68 24.27 25.72 26.40 60~ < 65 21.04 22.00 23.47 19.71 21.28 22.37 20.00 21.35 22.14 65~ < 70 16.89 17.92 19.30 15.76 17.26 18.20 16.05 17.45 17.95 70~ < 75 12.95 14.31 15.36 12.07 13.75 14.36 12.28 13.82 14.11 75~ < 80 9.33 10.95 11.83 8.79 10.62 11.01 8.95 10.60 10.64 80~ < 85 6.10 7.96 8.71 5.79 7.84 8.16 5.86 7.81 7.87 ≥85 3.14 5.55 6.12 3.08 5.77 6.04 3.03 5.63 5.92
下载: 导出CSV
表 3 2010、2015、2020年分地区人口死因顺位分析
Table 3. Analysis of population cause of death rank by region in 2010, 2015 and 2020
疾病Disease 东部Eastern region 2010年year 2015年year 2020年year 顺序
Rank死亡率/100 000-1
Mortality rate/100 000-1顺序
Rank死亡率/100 000-1
Mortality rate/100 000-1顺序
Rank死亡率/100 000-1
Mortality rate/100 000-1恶性肿瘤Cancer 1 148.24 1 181.08 1 180.12 脑血管病Cerebrovascular disease 2 129.50 2 147.00 2 148.11 心脏病Heart disease 3 90.19 3 123.31 3 137.61 呼吸系统疾病Respiratory disease 4 59.14 4 58.79 5 40.97 伤害Injury 5 46.88 5 45.44 4 44.92 感染病和寄生虫病Infectious and parasitic diseases 6 18.40 6 17.79 7 14.25 糖尿病Diabetes 7 12.04 7 15.33 6 18.26 消化系统疾病Digestive diseases 8 11.51 8 12.35 9 13.72 神经系统和精神障碍疾病Neurological and mental disorders 9 9.29 9 11.59 8 14.08 泌尿生殖系统疾病Genitourinary diseases 10 6.15 10 5.95 10 5.60 疾病Disease 中部Central region 2010年year 2015年year 2020年year 顺序
Rank死亡率/100 000-1
Mortality rate/100 000-1顺序
Rank死亡率/100 000-1
Mortality rate/100 000-1顺序
Rank死亡率/100 000-1
Mortality rate/100 000-1恶性肿瘤Cancer 2 142.00 2 146.15 2 157.49 脑血管病Cerebrovascular disease 1 144.86 1 153.13 1 164.25 心脏病Heart disease 3 97.41 3 124.36 3 153.53 呼吸系统疾病Respiratory disease 4 63.62 4 54.47 4 42.90 伤害Injury 5 51.37 5 46.55 5 42.85 感染病和寄生虫病Infectious and parasitic diseases 6 15.88 6 16.24 7 13.68 糖尿病Diabetes 8 10.07 7 12.09 6 16.95 消化系统疾病Digestive diseases 7 10.74 8 10.84 8 11.43 神经系统和精神障碍疾病Neurological and mental disorders 10 5.87 10 6.13 9 9.00 泌尿生殖系统疾病Genitourinary diseases 9 7.53 9 7.03 10 7.48 疾病Disease 西部Western region 2010年year 2015年year 2020年year 顺序
Rank死亡率/100 000-1
Mortality rate/100 000-1顺序
Rank死亡率/100 000-1
Mortality rate/100 000-1顺序
Rank死亡率/100 000-1
Mortality rate/100 000-1恶性肿瘤Cancer 2 114.70 1 137.96 2 139.82 脑血管病Cerebrovascular disease 1 117.96 2 133.40 1 150.98 心脏病Heart disease 4 61.79 4 90.12 3 113.58 呼吸系统疾病Respiratory disease 3 96.61 3 92.94 4 79.47 伤害Injury 5 57.19 5 54.91 5 50.34 感染病和寄生虫病Infectious and parasitic diseases 6 27.69 6 24.77 7 19.48 糖尿病Diabetes 8 7.89 8 12.69 8 17.39 消化系统疾病Digestive diseases 7 18.62 7 21.07 6 23.27 神经系统和精神障碍疾病Neurological and mental disorders 10 7.18 9 8.47 9 11.34 泌尿生殖系统疾病Genitourinary diseases 9 7.78 10 8.28 10 8.77 注:心脏病包括缺血性、风湿性心脏病;感染病和寄生虫病包括传染病、寄生虫病和呼吸系统感染性疾病。
Note: Heart disease includes ischemic and rheumatic heart disease; Infectious and parasitic diseases include infectious diseases, parasitic diseases and infectious diseases of the respiratory system.
下载: 导出CSV
-
[1] GBD 2019 Demographics Collaborators. Global age-sex-specific fertility, mortality, healthy life expectancy (HALE), and population estimates in 204 countries and territories, 1950-2019: a comprehensive demographic analysis for the Global Burden of Disease Study 2019[J]. Lancet, 2020, 396(10258): 1160-1203. DOI: 10.1016/S0140-6736(20)30977-6. [2] Collaborators G2DAI. Global burden of 369 diseases and injuries in 204 countries and territories, 1990-2019: a systematic analysis for the Global Burden of Disease Study 2019[J]. Lancet, 2020, 396(10258): 1204-1222. DOI: 10.1016/S0140-6736(20)30925-9. [3] 张冉, 秦奕, 高东平, 等. 近70年我国居民主要死因变化情况分析[J]. 医学信息学杂志, 2019, 40(8): 9-14. DOI: 10.3969/j.issn.1673-6036.2019.08.002.Zhang R, Qin Y, Gao DP, et al. Analysis of the changes in the main causes of death of Chinese residents in the last 70 years[J]. J Med Inform, 2019, 40(8): 9-14. DOI: 10.3969/j.issn.1673-6036.2019.08.002. [4] 丁仁船, 张吕瑾, 严晓雨, 等. 中部地区人口死因状况及去死因寿命表分析[J]. 中国卫生统计, 2022, 39(2): 222-224, 227. DOI: 10.3969/j.issn.1002-3674.2022.02.014.Ding RC, Zhang LJ, Yan XY, et al. Analysis of the death causes and life table of the population in central China[J]. Chinese Journal of Health Statistics, 2022, 39(2): 222-224, 227. DOI: 10.3969/j.issn.1002-3674.2022.02.014. [5] 魏双翼, 付英斌, 高钰杰, 等. 2016-2020年深圳市户籍居民死因分析[J]. 中国公共卫生管理, 2022, 38(6): 812-815. DOI: 10.19568/j.cnki.23-1318.2022.06.0026.Wei SY, Fu YB, Gao YJ, et al. Causes of death of registered residents in Shenzhen City from 2016 to 2020[J]. Chin J PHM, 2022, 38(6): 812-815. DOI: 10.19568/j.cnki.23-1318.2022.06.0026. [6] 中国疾病预防控制中心慢性非传染性疾病预防控制中心, 国家卫生健康委统计信息中心. 中国死因监测数据集-2020[M]. 北京: 中国科学技术出版社, 2021: 10-244.Chinese Center for Disease Control and Prevention Center for Chronic Noncommunicable Diseases, National Health and Family Planning Commission Statistical Information Center. China cause-of-death surveillance dataset 2020[M]. Beijing: China Science and Technology Press, 2021: 10-244. [7] 郭玉玲. 中国人均预期寿命时空变化及影响因素分析[J]. 中国卫生政策研究, 2018, 11(8): 44-49. DOI: 10.3969/j.issn.1674-2982.2018.08.007.Guo YL. Analysis of spatio-temporal changes in life expectancy and its influencing factors in China[J]. Chin J Health Policy, 2018, 11(8): 44-49. DOI: 10.3969/j.issn.1674-2982.2018.08.007. [8] Zheng RS, Zhang SW, Zeng HM, et al. Cancer incidence and mortality in China, 2016[J]. J Natl Cancer Cent, 2022, 2(1): 1-9. DOI: 10.1016/j.jncc.2022.02.002. [9] 杜玉慧, 施学忠, 张卫萍, 等. 中国人口老龄化时间空间变化趋势分析[J]. 中国卫生统计, 2018, 35(4): 522-526. https://www.cnki.com.cn/Article/CJFDTOTAL-ZGWT201804010.htmDu YH, Shi XZ, Zhang WP, et al. Exploration on the trend of temporal and spatial distribution of population aging in China[J]. Chinese Journal of Health Statistics, 2018, 35(4): 522-526. https://www.cnki.com.cn/Article/CJFDTOTAL-ZGWT201804010.htm [10] 高蓓, 初海超, 芦文丽, 等. 1990—2019年中国恶性肿瘤疾病负担变化趋势分析[J]. 中华疾病控制杂志, 2022, 26(4): 430-436, 489. DOI: 10.16462/j.cnki.zhjbkz.2022.04.012.Gao B, Chu HC, Lu WL, et al. Changing trend concerning the burden of cancer between 1990 and 2019 in China[J]. Chin J Dis Control Prev, 2022, 26(4): 430-436, 489. DOI: 10.16462/j.cnki.zhjbkz.2022.04.012. [11] 蔡倩, 李传苍, 周雅冰, 等. 2019年恶性肿瘤死亡对中国居民期望寿命的影响[J]. 现代肿瘤医学, 2023, 31(6): 1131-1135. DOI: 10.3969/j.issn.1672-4992.2023.06.029.Cai Q, Li CC, Zhou YB, et al. lmpact of cancer death on life expectancy of Chinese residents in 2019[J]. J Mod Oncol, 2023, 31(6): 1131-1135. DOI: 10.3969/j.issn.1672-4992.2023.06.029. [12] Li LL, Shao MY, He XS, et al. Risk of lung cancer due to external environmental factor and epidemiological data analysis[J]. Math Biosci Eng, 2021, 18(5): 6079-6094. DOI: 10.3934/mbe.2021304. [13] 《中国心血管健康与疾病报告》编写组. 《中国心血管健康与疾病报告2020》要点解读[J]. 中国心血管杂志, 2021, 26(3): 209-218. DOI: 10.3969/j.issn.1007-5410.2021.03.001.The Writing Committee of the Report on Cardiovascular Health and Diseases in China. Interpretation of report on cardiovascular health and diseases in China 2020[J]. Chin J Cardiovasc Med, 2021, 26(3): 209-218. DOI: 10.3969/j.issn.1007-5410.2021.03.001. [14] Astell-Burt T, Zhang M, Feng XQ, et al. Geographical variation and correlates of tobacco smoking, second-hand smoke exposure, workplace tobacco prohibition, and protobacco and counter-tobacco advertising in mainland China: a cross-sectional study of 98058 participants[J]. Lancet, 2015, 386: S17. DOI: 10.1016/S0140-6736(15)00595-4. [15] 胡盛寿, 杨进刚. 新时代中国心血管疾病防控策略[J]. 中国循环杂志, 2022, 37(12): 1177-1180. DOI: 10.3969/j.issn.1000-3614.2022.12.001.Hu SS, Yang JG. Prevention and control strategies of cardiovascular diseases in China in the new era[J]. Chin Circ J, 2022, 37(12): 1177-1180. DOI: 10.3969/j.issn.1000-3614.2022.12.001. [16] Luo LS, Zhang YQ, Jiang JF, et al. Short-term effects of ambient air pollution on hospitalization for respiratory disease in Taiyuan, China: a time-series analysis[J]. Int J Environ Res Public Health, 2018, 15(10): 2160. DOI: 10.3390/ijerph15102160. [17] 张聪颖, 耳玉亮, 叶鹏鹏, 等. 2020年中国老年人伤害死亡特征分析[J]. 中国健康教育, 2022, 38(11): 968-972. DOI: 10.16168/j.cnki.issn.1002-9982.2022.11.002.Zhang CY, Er YL, Ye PP, et al. Analysis on the characteristics of injury deaths among the elderly in China, 2020[J]. Chinese Journal of Health Education, 2022, 38(11): 968-972. DOI: 10.16168/j.cnki.issn.1002-9982.2022.11.002. [18] Zhang KT, Qi JL, Zuo PJ, et al. The mortality trends of falls among the elderly adults in the mainland of China, 2013-2020: a population-based study through the National Disease Surveillance Points system[J]. Lancet Reg Health West Pac, 2021, 19: 100336. DOI: 10.1016/j.lanwpc.2021.100336. [19] Fang EF, Xie CL, Schenkel JA, et al. A research agenda for ageing in China in the 21st century (2nd edition): focusing on basic and translational research, long-term care, policy and social networks[J]. Ageing Res Rev, 2020, 64: 101174. DOI: 10.1016/j.arr.2020.101174. -

 点击查看大图

计量
- 文章访问数: 75
- HTML全文浏览量: 16
- PDF下载量: 14
- 被引次数: 0