

Trend analysis on dietary diversity and quality among urban residents with health examination in Beijing from 2008 to 2018
-
摘要:
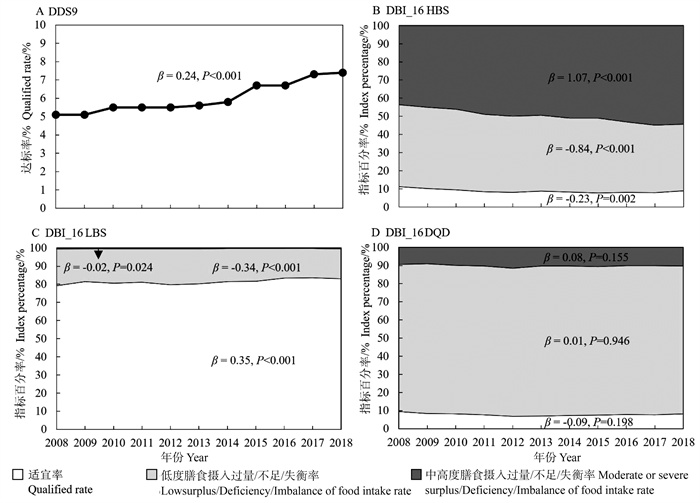
目的 了解2008―2018年北京城区某体检人群膳食多样化及膳食质量变化趋势。 方法 选择2008―2018年在北京某体检中心完成体检问卷的北京城区居民为研究对象,利用半定量食物频率问卷计算主要食物组每日摄入量,根据2010年全国人口普查数据中北京市≥20岁城市居民性别和年龄构成对膳食多样化评分-9分类(diet diversity score-9 classification,DDS9)和中国膳食平衡指数(Chinese diet balance index,DBI_16)的得分和指标百分率标准化,采用Meta回归分析探究变化趋势。 结果 共纳入224 178人次,标准化后DDS9得分11年间增加0.2分,达标率从5.1%增至7.4%(P < 0.001)。2008―2018年北京城区居民DBI_16总分呈上升趋势(β=0.16, P < 0.001),对应达标率从4.9%降至3.8%,其中正端分中高度摄入过量率从43.7%增至54.3%(β=1.07, P < 0.001),负端分适宜率从79.3%增至83.1%(β=0.35, P < 0.001),膳食质量距的各百分率无长期变化趋势(P>0.05)。 结论 2008―2018年北京市城区居民膳食摄入不足的问题有所改善,膳食摄入过量的问题逐年加重,膳食多样化状况不佳。应采取干预措施指导居民理解膳食多样化、促进居民膳食均衡、提高膳食质量。 Abstract:Objective To explore the long-term trend of dietary diversity and quality among Beijing urban residents with health examinations from 2008 to 2018. Methods The urban residents who completed physical examination questionnaires in a physical examination center in Beijing between 2008 and 2018 were selected. A semi-quantitative food frequency questionnaire was used to calculate the daily intakes of major food groups. The scores and index percentages of diet diversity score-9 classification (DDS9) and Chinese diet balance index (DBI_16) were standardized to the gender and age composition of urban residents aged 20 and above in Beijing from the 2010 national census data, and meta-regression analysis was used to explore the long-term trend. Results Among the 224 178 subjects, the standardized DDS9 score increased by 0.2 over 11 years, with the qualified rate rising from 5.1% to 7.4% (P < 0.001). From 2008 to 2018, DBI_16 total score for urban residents in Beijing showed an increasing trend (β=0.16, P < 0.001), while the corresponding qualified rate decreased from 4.9% to 3.8%. The moderate or severe surplus of food intake rate increased from 43.7% to 54.3% (β=1.07, P < 0.001), and the qualified rate of the low bound score increased from 79.3% to 83.1% (β=0.35, P < 0.001), but no significant long-term trend was observed in any rate of dietary quality distance (P>0.05). Conclusions From 2008 to 2018, the insufficient dietary intake of Beijing′s urban residents improves, while the excessive dietary intake worses year after year, and the average dietary diversity is poor. Intervention measures, such as promoting a balanced diet and improving dietary quality, should be implemented to guide residents toward dietary diversity. -
Key words:
- Dietary quality /
- Dietary diversity /
- Long-term trend
-

图 1 2008―2018年北京城区居民DDS9和DBI_16标化百分率变化趋势
DDS9:膳食多样化评分-9分类;DBI_16:中国膳食平衡指数;HBS:正端分;LBS:负端分;DQD:膳食质量距。
Figure 1. Trends in the standardized percentages of DDS9 and DBI_16 of Beijing urban residents from 2008 to 2018
DDS9:diet diversity score-9 classification; DBI_16:Chinese diet balance index; HBS: high bound score; LBS: low bound score; DQD: diet quality distance.
表 1 研究对象的一般特征
Table 1. Characteristics of the study population
年份
Year人数
Numberof people性别① Gender① 年龄组/岁① Age group/years① 本科及以上教育①
Bachelor degree or above①个人年收入≥15万元①
Annual income ≥150 000 yuan①男
Men女
Women20~<40岁years 40~<60岁years 60~<100岁years 2008 15 647 56.9 43.1 52.7 41.4 5.9 69.9 21.6 2009 16 666 54.9 45.1 51.2 43.1 5.7 71.2 23.5 2010 17 488 56.0 44.0 49.2 44.1 6.7 71.5 26.7 2011 19 670 54.7 45.3 47.8 46.0 6.2 72.6 29.4 2012 24 820 53.6 46.4 44.0 49.6 6.4 71.0 26.3 2013 27 643 53.2 46.8 45.4 47.5 7.1 72.4 25.9 2014 23 634 53.9 46.1 49.9 42.1 8.0 76.4 28.3 2015 22 011 52.6 47.4 51.9 40.4 7.6 75.4 28.6 2016 17 875 51.0 49.0 43.1 47.9 9.0 75.3 34.9 2017 17 764 51.5 48.5 42.8 48.5 8.7 76.5 38.7 2018 20 960 51.2 48.8 42.4 49.2 8.4 77.6 37.9 合计Total 224 178 53.5 46.5 47.1 45.6 7.3 73.7 29.2 注:①以占比/%表示。
Note: ① Proportion/%. 下载: 导出CSV
表 2 2008―2018年北京城区居民DDS9和DBI_16得分变化趋势
Table 2. Trends in DDS9 and DBI_16 scores of Beijing urban residents from 2008 to 2018
年份
YearDDS9 谷类
Cereal蔬菜水果
Vegetable and fruit奶类和豆类
Dairy and beans动物性食物
Animal food纯能量食物
Empty energy food食物种类
Diet variety总分
Total pointsHBS LBS DQD 2008① 4.3(1.3) 9.2(4.0) -1.1(1.7) -5.2(2.1) 1.6(3.7) 0.8(1.3) -2.1(1.1) 3.3(7.3) 12.6(4.8) 9.4(4.3) 22.0(5.4) 2009① 4.2(1.3) 9.3(4.0) -1.0(1.6) -5.2(2.1) 1.8(3.6) 0.8(1.3) -2.1(1.1) 3.6(7.2) 12.8(4.7) 9.2(4.1) 22.1(5.1) 2010① 4.3(1.3) 9.4(3.9) -1.1(1.6) -5.2(2.0) 1.9(3.6) 0.8(1.3) -2.1(1.1) 3.7(7.0) 13.0(4.7) 9.3(4.1) 22.3(5.2) 2011① 4.3(1.3) 9.6(3.8) -1.1(1.6) -5.2(2.0) 2.1(3.7) 0.8(1.3) -2.0(1.1) 4.1(7.1) 13.3(4.7) 9.2(4.1) 22.5(5.1) 2012① 4.3(1.3) 9.6(3.8) -1.1(1.7) -5.3(2.1) 2.2(3.7) 0.8(1.3) -2.1(1.1) 4.1(7.1) 13.4(4.6) 9.3(4.1) 22.7(5.2) 2013① 4.3(1.3) 9.5(3.9) -1.1(1.7) -5.3(2.1) 2.1(3.6) 0.8(1.3) -2.1(1.1) 4.0(7.1) 13.3(4.6) 9.3(4.1) 22.6(5.1) 2014① 4.3(1.3) 9.6(3.8) -1.0(1.6) -5.3(2.1) 2.2(3.6) 0.8(1.3) -2.1(1.1) 4.3(7.0) 13.4(4.6) 9.1(4.1) 22.6(5.1) 2015① 4.4(1.3) 9.6(3.8) -0.9(1.6) -5.3(2.1) 2.4(3.6) 0.8(1.2) -2.0(1.1) 4.4(7.0) 13.5(4.6) 9.1(4.1) 22.6(5.1) 2016① 4.4(1.3) 9.6(3.9) -0.9(1.6) -5.3(2.1) 2.7(3.6) 0.8(1.2) -2.0(1.1) 4.8(7.1) 13.7(4.7) 8.9(4.0) 22.5(5.1) 2017① 4.5(1.3) 9.5(3.9) -0.9(1.6) -5.3(2.1) 2.9(3.6) 0.8(1.2) -1.9(1.1) 5.1(7.1) 13.9(4.7) 8.7(4.0) 22.6(5.2) 2018① 4.4(1.4) 9.3(4.2) -1.0(1.6) -5.3(2.2) 3.0(3.5) 0.8(1.2) -1.9(1.1) 4.8(7.3) 13.7(4.8) 8.9(4.1) 22.6(5.2) β值value 0.02 0.01 0.02 -0.01 0.13 0 0.02 0.16 0.11 -0.06 0.05 P值value < 0.001 0.328 0.002 0.057 < 0.001 0.050 < 0.001 < 0.001 < 0.001 < 0.001 0.002 注:DDS9,膳食多样化评分-9分类;DBI_16,中国膳食平衡指数;HBS,正端分;LBS,负端分;DQD,膳食质量距。
①以均值(标准差)表示。
Note:DDS9,diet diversity score-9 classification;DBI_16,Chinese diet balance index;HBS,high bound score;LBS,low bound score;DQD,diet quality distance.
① Standard deviation (averge).
下载: 导出CSV
表 3 2008―2018年北京城区居民亚组人群DBI_16标准化中位百分率及变化趋势
Table 3. The standardized median percentages and trends of DBI_16 among subgroups from 2008 to 2018
DBI_16指标DBI_16 index 男性① Men① 女性① Women① 20~<40岁years 40~<60岁years 60~<100岁years 20~<40岁years 40~<60岁years 60~<100岁years 正端分High bound score 适宜率Qualified rate 8.9(-0.26)② 4.3(-0.33)② 4.3(-0.16) 13.6(-0.25) 8.1(-0.13) 5.1(-0.07) 低度摄入过量率Low surplus of food intake rate 41.2(-0.70)② 38.1(-0.58)② 39.3(-1.28)② 41.5(-0.78)② 45.1(-1.00)② 44.4(-1.67)② 中高度摄入过量率Moderate or severe surplus of food intake rate 50.0(0.98)② 56.7(0.93)② 54.3(1.50)② 46.7(1.03)② 46.9(1.09)② 50.6(1.64)② 负端分Low bound score 适宜率Qualified rate 80.4(0.92)② 81.9(0.28)② 85.9(0.47) 79.1(-0.05) 81.8(0.10) 84.4(0.42) 低度摄入不足率Low deficiency of food intake rate 19.2(-0.91)② 17.9(-0.27)② 13.8(-0.46)② 20.3(0.08) 17.9(-0.07) 14.8(-0.38)② 中高度摄入不足率Moderate or severe deficiency of food intake rate 0.3(-0.03) 0.3(-0.02)② 0.1(0.01) 0.5(-0.03) 0.4(-0.02) 0.1(-0.04) 膳食质量距Dietary quality distance 适宜率Qualified rate 8.3(0.15) 4.5(-0.20)② 6.0(-0.29)② 10.7(-0.14) 6.6(-0.17)② 5.3(-0.09) 低度摄入失衡率Low imbalance of food intake rate 79.4(-0.01) 80.4(0.16) 83.2(0.23) 81.5(-0.03) 85.1(-0.03) 86.9(-0.11) 中高度摄入失衡率Moderate or severe imbalance of food intake rate 11.2(-0.13) 14.6(0.07) 9.5(0.10) 8.2(0.20)② 8.2(0.19)② 7.1(0.20) 注:DBI_16,中国膳食平衡指数。
①以中位百分率[年均变化率(β值)]表示;② P < 0.05。
Note:DBI_16,Chinese diet balance index.
①Median percentage [annual rate of change (β value)];② P<0.05.
下载: 导出CSV
-
[1] 金瑛, 李艳平, 胡小琪, 等. 我国成人膳食多样化与营养素摄入充足状态的关系[J]. 营养学报, 2009, 31(1): 21-25, 29. DOI: 10.3321/j.issn:0512-7955.2009.01.005.Jin Y, Li YP, Hu XQ, et al. Association between dietary diversity and nutrients adequacy in Chinese adults[J]. Acta Nutr Sin, 2009, 31(1): 21-25, 29. DOI: 10.3321/j.issn:0512-7955.2009.01.005. [2] 金瑛. 我国居民膳食多样化与营养状况及慢性疾病关系的研究[D]. 北京: 中国疾病预防控制中心, 2009: 32-34.Jin Y. Study on associations of dietary diversity with nutrients adequacy and nutrition related chronic disease in Chinese audlts[D]. Beijing: Chinese Center for Disease Control and Prevention, 2009: 32-34. [3] 申思, 吕晓华. 膳食多样化与健康关系的研究进展[J]. 川北医学院学报, 2017, 32(3): 475-478. DOI: 10.3969/j.issn.1005-3697.2017.03.044.Shen S, Lyu XH. Research advances in dietary diversity and health[J]. J N Sichuan Med Coll, 2017, 32(3): 475-478. DOI: 10.3969/j.issn.1005-3697.2017.03.044. [4] Dietary recommendations in the report of a joint WHO/FAO expert consultation on diet nutrition and the prevention of chronic diseases[J]. World Health Organ Tech Rep Ser, 2003: 916: i-viii, 1-149. https://www.cnki.com.cn/Article/CJFDTOTAL-SPHS202402010.htm [5] DeSalvo KB, Olson R, Casavale KO. Dietary guidelines for americans[J]. JAMA, 2016, 315(5): 457-458. DOI: 10.1001/jama.2015.18396. [6] 中国营养学会. 中国居民膳食指南: 2022[M]. 第5版. 北京: 人民卫生出版社, 2022: 3-27.Chinese Nutrition Society. Chinese dietary guidelines: 2022[M]. 5th. Beijing: People's Medical Publishing House, 2022: 3-27. [7] Sun QF, Wen QR, Lyu J, et al. Dietary pattern derived by reduced-rank regression and cardiovascular disease: a cross-sectional study[J]. Nutr Metab Cardiovasc Dis, 2022, 32(2): 337-345. DOI: 10.1016/j.numecd.2021.10.008. [8] 中国营养学会. 中国居民膳食指南: 2016[M]. 第4版. 北京: 人民卫生出版社, 2016: 285-292.Chinese Nutrition Society. Chinese dietary guidelines: 2016[M]. 4th. Beijing: People's Medical Publishing House, 2016: 285-292. [9] 杨月欣, 中国疾病预防控制中心营养与健康所. 中国食物成分表标准版[M]. 第6版. 北京: 北京大学医学出版社, 2018: 27-123.Yang YX, Institute of Nutrition and Health, Chinese Center for Disease Control and Prevention. China food composition tables standard edition[M]. 6th. Beijing: Peking University Medical Press, 2018: 27-123. [10] 潘烺, 刘秋萍, 林运欣, 等. 2008-2018年北京市城区某体检人群主要食物摄入的变化趋势分析[J]. 中国慢性病预防与控制, 2022, 30(6): 447-451, 456. DOI: 10.16386/j.cjpccd.issn.1004-6194.2022.06.010.Pan L, Liu QP, Lin YX, et al. Trend in main food intake among residents with health examination in urban area of Beijing from 2008 to 2018[J]. Chin J Prev Contr Chronic Dis, 2022, 30(6): 447-451, 456. DOI: 10.16386/j.cjpccd.issn.1004-6194.2022.06.010. [11] 何宇纳, 房玥晖, 夏娟. 中国膳食平衡指数的修订: DBI_16[J]. 营养学报, 2018, 40(6): 526-530. DOI: 10.13325/j.cnki.acta.nutr.sin.2018.06.003.He YN, Fang YH, Xia J. Update of the Chinese diet balance index: DBI_16[J]. Acta Nutr Sin, 2018, 40(6): 526-530. DOI: 10.13325/j.cnki.acta.nutr.sin.2018.06.003. [12] 中华人民共和国国家统计局. 2010年第六次全国人口普查主要数据公报[EB/OL]. (2012-04-20)[2022-12-20]. https://www.gov.cn/guoqing/2012-04/20/content_2582698.htm?eqid=cfea055c0001bc8c000000026477ef59 .[13] 赵耀, 金庆中. 应用中国膳食平衡指数评价北京地区18~59岁人群膳食质量[J]. 首都公共卫生, 2018, 12(2): 71-73. DOI: 10.16760/j.cnki.sdggws.2018.02.004.Zhao Y, Jin QZ. Measuring diet quality of Beijing 18-59 years adults using Chinese diet balance index[J]. Capital Journal of Public Health, 2018, 12(2): 71-73. DOI: 10.16760/j.cnki.sdggws.2018.02.004. [14] Du HD, Guo Y, Bennett DA, et al. Red meat, poultry and fish consumption and risk of diabetes: a 9 year prospective cohort study of the China Kadoorie Biobank[J]. Diabetologia, 2020, 63(4): 767-779. DOI: 10.1007/s00125-020-05091-x. [15] Huang LN, Wang HJ, Wang ZH, et al. Association of red meat usual intake with serum ferritin and the risk of metabolic syndrome in Chinese adults: a longitudinal study from the China health and nutrition survey[J]. Biomed Environ Sci, 2020, 33(1): 19-29. DOI: 10.3967/bes2020.003. [16] Fang YH, Xia J, Lian YY, et al. The burden of cardiovascular disease attributable to dietary risk factors in the provinces of China, 2002-2018: a nationwide population-based study[J]. Lancet Reg Health West Pac, 2023, 37: 100784. DOI: 10.1016/j.lanwpc.2023.100784. [17] 何宇纳, 翟凤英, 杨晓光, 等. 修订中国膳食平衡指数[J]. 营养学报, 2009, 31(6): 532-536. DOI: 10.3321/j.issn:0512-7955.2009.06.003.He YN, Zhai FY, Yang XG, et al. The Chinese diet balance index revised[J]. Acta Nutr Sin, 2009, 31(6): 532-536. DOI: 10.3321/j.issn:0512-7955.2009.06.003. [18] 何宇纳, 翟凤英. 中国成年人膳食质量的影响因素分析[J]. 卫生研究, 2005, 34(5): 611-612. DOI: 10.3969/j.issn.1000-8020.2005.05.031.He YN, Zhai FY. Relative factors effecting dietary quality of Chinese adults[J]. J Hyg Res, 2005, 34(5): 611-612. DOI: 10.3969/j.issn.1000-8020.2005.05.031. [19] 苏畅. 经济因素对我国成年居民膳食结构和营养状况影响的研究[D]. 北京. 中国疾病预防控制中心, 2010: 36-44.Su C. The impact of economic factor to dietary patterns and nutritional status among Chinese adults[D]. Beijing. Chinese Center for Disease Control and Prevention, 2010: 36-44. [20] 林彤, 赵霞, 张勍烨, 等. 应用膳食平衡指数评价中老年人膳食质量[J]. 职业与健康, 2019, 35(13): 1781-1786. DOI: 10.13329/j.cnki.zyyjk.2019.0468.Lin T, Zhao X, Zhang QY, et al. Evaluation of dietary quality of middle-aged and elderly people by Chinese Diet Balance Index[J]. Occup Health, 2019, 35(13): 1781-1786. DOI: 10.13329/j.cnki.zyyjk.2019.0468. -

 点击查看大图
计量
- 文章访问数: 33
- HTML全文浏览量: 6
- PDF下载量: 8
- 被引次数: 0