

Study on the epidemic trend of Omicron in Shanghai based on the reproduction number
-
摘要:
目的 基于截至2022年5月9日上海市奥密克戎(Omicron)的流行趋势,估计封控管理之前的早期再生数(R)以及后续的有效再生数(Rt)变化情况。 方法 利用指数增长法、最大似然法和下一代矩阵法估计R,利用贝叶斯方法、时依法和新时变法估计Rt。 结果 截至2022年3月29日上海市奥密克戎疫情呈指数增长模式。3种方法估计的R值分别为2.36(95% CI:2.33~2.38),2.14(95% CI:2.11~2.18)和2.29(95% CI:2.22~2.38)。 结论 R值较大,上海市早期疫情形势较为严峻。自4月7日起,Rt呈下降趋势,表明封控管理措施有效地减缓了疫情增长。Rt的计算方法中,时依法和新时变法可以较快地响应疫情的动态变化趋势;而贝叶斯法反应较为迟缓,且当报告数据波动较大时,会出现分母为0导致无法计算的情况。 Abstract:Objective To study the epidemic trend of Omicron in Shanghai as of May 9, 2022 by estimating the early reproduction number (R) before closed management and the subsequent changes of effective reproduction number (Rt). Methods Exponential growth method, maximum likelihood method and next generation matrix method were used to estimate R, and Bayesian method, Time-Dependent and New Time-Varying were used to estimate Rt. Results As of March 29, 2022, the growth of Omicron epidemic in Shanghai followed the exponential growth. The early reproduction number R estimated by three methods was 2.36(95% CI: 2.33-2.38), 2.14(95% CI: 2.11-2.18) and 2.29(95% CI: 2.22-2.38), respectively. Conclusion s As the values of R were relatively large, the early epidemic situation in Shanghai was severe. The turning point of the epidemic was on April 7, and the implementation of sealing and control management measures had effectively slowed down the increment of the epidemic cases. Among the methods for calculating the Rt, the Time-Dependent and New Time-Varying can quickly respond to the dynamic trend of the epidemic, while the Bayesian method was relatively slow. Besides, when the reported data fluctuated greatly, the denominator would be zero, thus Rt would be unable to calculate. -
Key words:
- COVID-19 /
- Omicron /
- Reproduction number
-

图 2 2022年3月1日―4月13日指数增长拟合的RNew值
Figure 2. RNew value of exponential growth fitting from March 1 to April 13, 2022

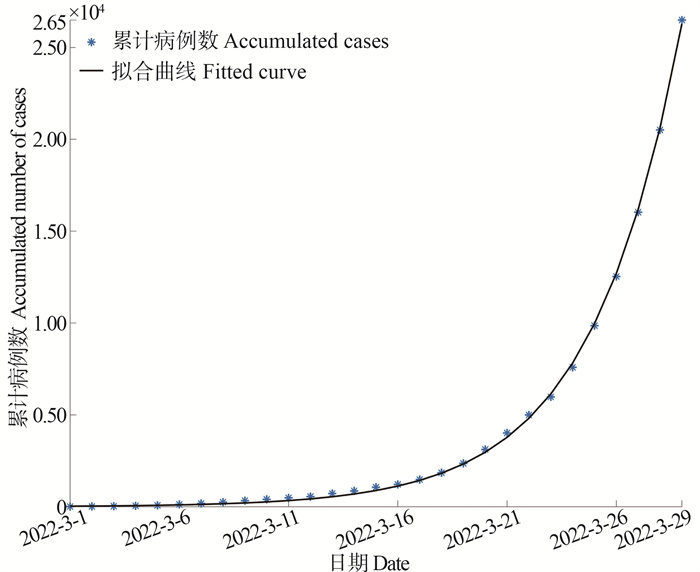
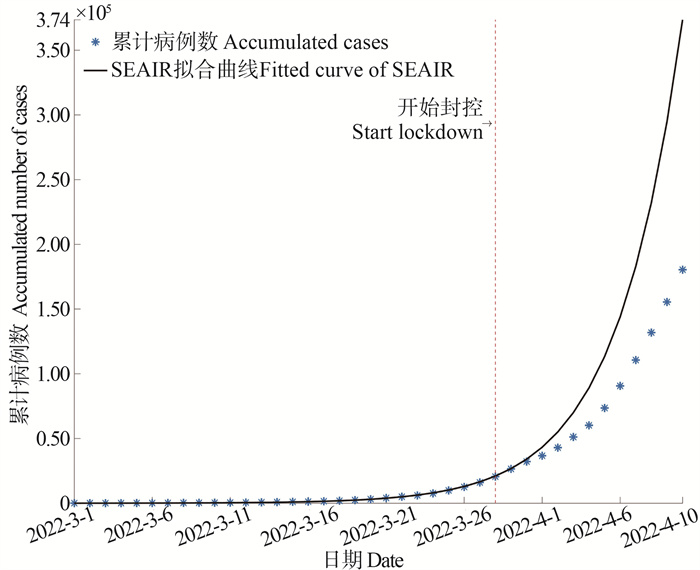
图 3 指数增长曲线拟合2022年3月1―29日累计感染病例数
Figure 3. Exponential growth curve fitting cumulative number of infected cases from March 1 to March 29, 2022

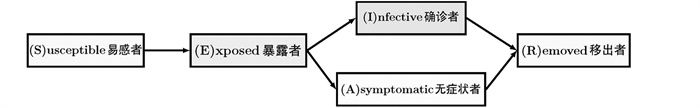
图 4 SEAIR模型中人群转化关系图
S: 易感者仓室; E: 暴露者仓室; A: 无症状者仓室; I: 确诊者仓室; R: 移出者仓室。
Figure 4. The transformation relationship diagram of the SEAIR model
S: compartment of susceptible individuals; E: compartment of exposed individuals; A: compartment of asymptomatic individuals; I: compartment of infective individuals; R: compartment of removed individuals.

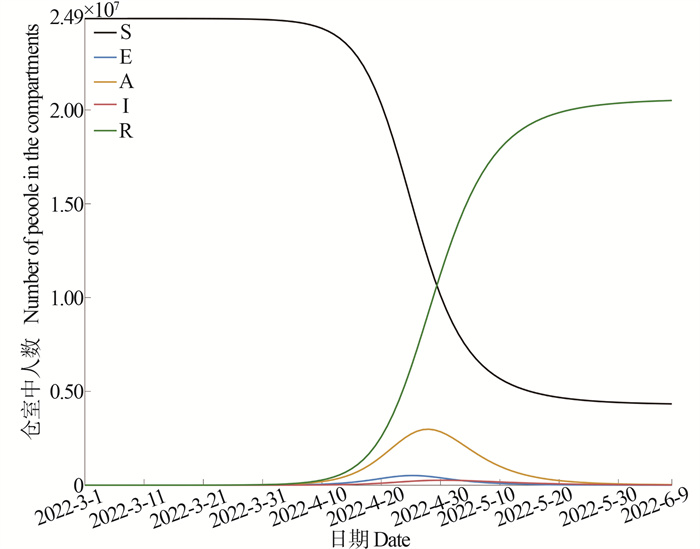
图 6 3月1日起100 d各仓室中人数预测
S, 易感者仓室; E, 暴露者仓室; A, 无症状者仓室; I, 确诊者仓室; R, 移出者仓室。
Figure 6. Forecast of the number of people in each compartment in 100 days from March 1
S, compartment of susceptible individuals; E, compartment of exposed individuals; A, compartment of asymptomatic individuals; I, compartment of infective individuals; R, compartment of removed individuals.

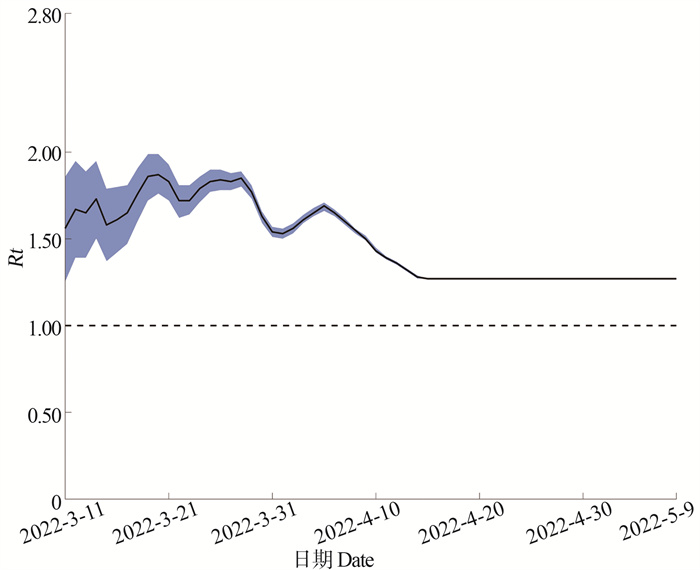
图 7 贝叶斯法估计有效再生数
Figure 7. Estimation of effective reproduction number by Bayesian method

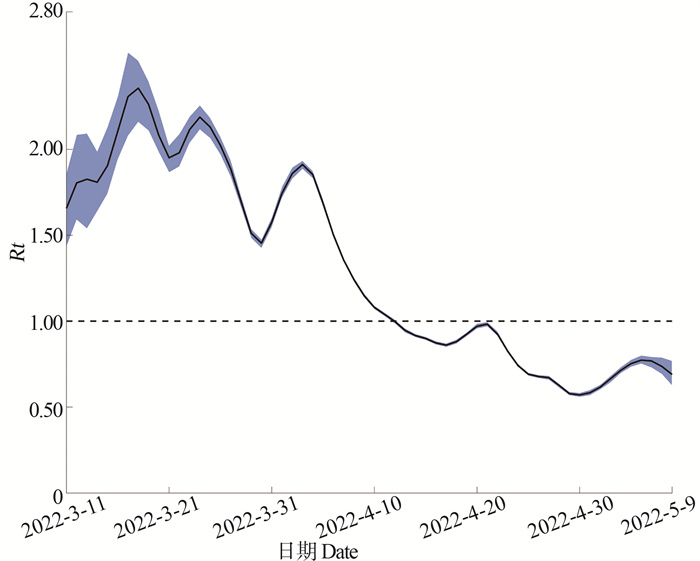
图 8 时依法估计有效再生数
Figure 8. Estimation of effective reproduction number by Time-Dependent method

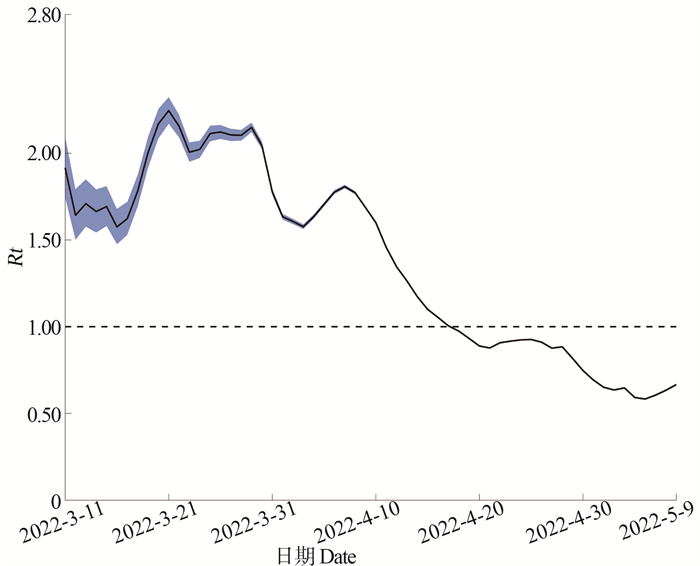
图 9 新时变法估计有效再生数
Figure 9. Estimation of effective reproduction number by New Time-Varying method
表 1 SEAIR模型中各参数及意义
Table 1. Significance of parameters in SEAIR model
参数Parameter 意义Significance β 有效接触率
Contact rateγ 潜伏期的倒数
Reciprocal of incubation periodσ 被感染后无症状的比例
Proportion of asymptomatic casesθ 无症状感染者的传染率
Infection rate of asymptomatic casesαA 无症状感染者的康复率
Recovery rate of asymptomatic casesαI 确诊患者的康复率
Recovery rate of confirmed cases 下载: 导出CSV
表 2 SEAIR仓室模型中各参数取值
Table 2. Values of parameters in SEAIR compartment model
参数Parameter 取值Value θ 0.40 αA 0.33 σ 0.96 β 1.60 γ 2.20 αI 0.14
下载: 导出CSV
表 3 The early reproduction number in Shanghai (3.1-3.29)
计算方法
Computation method早期再生数估计值(95% CI)
Estimated value of early
reproduction number (95% CI)指数增长法
Exponential growth method2.36(2.33~2.38) 最大似然法
Maximum likelihood method2.14(2.11~2.18) 下一代矩阵法
Next generation matrix method2.29(2.22~2.38)
下载: 导出CSV
表 4 2020年COVID-19与2022年奥密克戎再生数对比
Table 4. Comparison between the reproduction numbers of COVID-19 in 2020 and Omicron in 2022
计算方法
Method of calculation2020年2月COVID-19早期再生数
Early reproduction number of COVID-9 in February 20202022年3月奥密克戎早期再生数
Early reproduction number of Omicron in March 2022指数增长法Exponential growth method 3.74(3.63~2.87) 2.36(2.33~2.38) 最大似然法Maximum likelihood method 3.16(2.90~3.43) 2.14(2.11~2.18) 下一代矩阵法Next generation matrix method 3.91(3.71~4.11) 2.29(2.22~2.38)
下载: 导出CSV
-
[1] Kim D, Jo J, Lim JS, et al. Serial interval and basic reproduction number of SARS-CoV-2 Omicron variant in South Korea[J]. medRxiv, 2021. DOI: 10.1101/2021.12.25.21268301. [2] Kremer C, Braeye T, Proesmans K, et al. Observed serial intervals of SARS-CoV-2 for the Omicron and Delta variants in Belgium based on contact tracing data, 19 November to 31 December 2021[J]. medRxiv, 2022. DOI: 10.1101/2022.01.28.22269756. [3] 宋倩倩, 赵涵, 方立群, 等. 新型冠状病毒肺炎的早期传染病流行病学参数估计研究[J]. 中华流行病学杂志, 2020, 41(4): 461-465. DOI: 10.3760/cma.j.cn112338-20200205-00069.Song QQ, Zhao H, Fang LQ, et al. Study on assessing early epidemiological parameters of COVID-19 epidemic in China[J]. Chin J Epidemiol, 2020, 41(4): 461-465. DOI: 10.3760/cma.j.cn112338-20200205-00069. [4] 上海市卫生健康委员会. 新闻发布[EB/OL]. (2022-05-09)[2023-01-05]. https://wsjkw.sh.gov.cn/xwfb/ .[5] 马知恩, 周义仓, 王稳地, 等. 传染病动力学的数学建模与研究[M]. 第一版. 北京: 科学出版社, 2004: 3-10.Ma ZE, Zhou YC, Wang WD, et al. Mathematical modeling and research of infectious disease dynamics[M]. 1st ed. Beijing: Science Press, 2004: 3-10. [6] Wallinga J, Lipsitch M. How generation intervals shape the relationship between growth rates and reproductive numbers[J]. Proc Biol Sci, 2007, 274(1609): 599-604. DOI: 10.1098/rspb.2006.3754. [7] Forsberg White L, Pagano M. A likelihood-based method for real-time estimation of the serial interval and reproductive number of an epidemic[J]. Stat Med, 2008, 27(16): 2999-3016. DOI: 10.1002/sim.3136. [8] Bettencourt LMA, Ribeiro RM. Real time bayesian estimation of the epidemic potential of emerging infectious diseases[J]. PLoS one, 2008, 3(5): e2185. DOI: 10.1371/journal.pone.0002185. [9] Wallinga J, Teunis P. Different epidemic curves for severe acute respiratory syndrome reveal similar impacts of control measures[J]. Am J Epidemiol, 2004, 160(6): 509-516. DOI: 10.1093/aje/kwh255. [10] Cori A, Ferguson NM, Fraser C, et al. A new framework and software to estimate time-varying reproduction numbers during epidemics[J]. Am J Epidemiol, 2013, 178(9): 1505-1512. DOI: 10.1093/aje/kwt133. [11] 黄梓健, 周滔. 新型冠状病毒肺炎无症状感染者研究现状[J]. 现代医药卫生, 2021, 37(22): 3873-3877. DOI: 10.3969/j.issn.1009-5519.2021.22.022.Huang ZJ, Zhou T. Research status of asymptomatic COVID-19 infected persons[J]. J Mod Med Health, 2021, 37(22): 3873-3877. DOI: 10.3969/j.issn.1009-5519.2021.22.022. [12] Cai J, Deng X, Yang J, et al. Modeling transmission of SARS-CoV-2 omicron in China[J]. Nat Med, 2022, 28(7): 1468-1475. DOI: 10.1038/s41591-022-01855-7. -


 点击查看大图
计量
- 文章访问数: 41
- HTML全文浏览量: 18
- PDF下载量: 11
- 被引次数: 0