

Analysis on the associated factors of hyperuricemia: based on classification tree model
-
摘要:
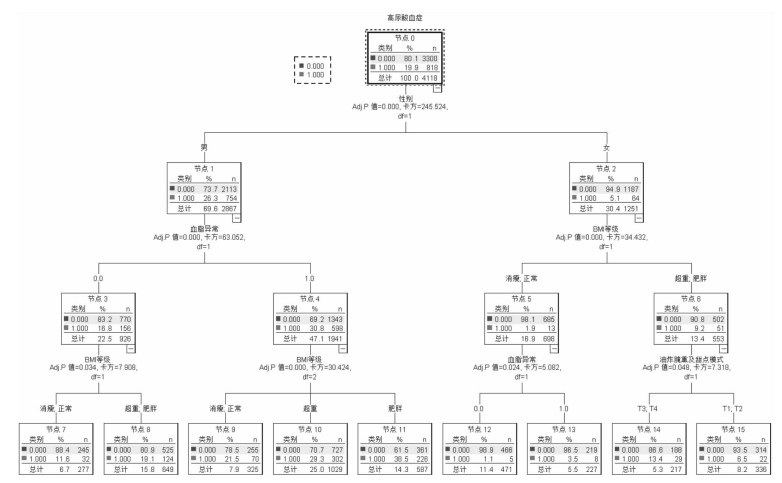
目的 了解影响高尿酸血症(hyperuricemia,HUA)的生理、社会心理及膳食等生活习惯因素,为HUA的干预提供参考依据。 方法 对2016-2017年在大连医科大学附属第二医院健康管理中心体检的成年人进行问卷调查和体格测量,比较基本资料、行为习惯、心理因素等对HUA患病风险的影响。采取分类树模型分析各研究因素与HUA的关系。 结果 研究共纳入研究对象4 118人,平均年龄为(52.8±7.9)岁。统计发现,30岁以下及40~50岁、吸烟、饮酒、静坐为主工作、对工作不满意、精神压力极大的人群HUA检出率更高。因子分析共提取出3种膳食模式:传统模式,油炸腌熏甜点模式,优质蛋白模式,累计方差贡献率53.886%。多因素模型显示,优质蛋白模式、体育锻炼和空腹血糖(fasting plasma glucose,FPG)与HUA呈负相关,男性、吸烟、饮酒、血脂异常及体重指数(body mass index,BMI)为HUA的危险因素。性别分析显示,男、女优质蛋白模式均与HUA呈负相关,油炸腌熏甜点模式为女性HUA的独立危险因素。分类树模型显示男性、血脂异常、高BMI等级、油炸腌熏甜点模式是HUA的危险因素。 结论 不同性别人群HUA的影响因素不同,应采取个性化的健康管理。超重或肥胖男性应控制吸烟、饮酒等行为,女性更应注意油炸腌熏甜点食物的摄入,提倡优质蛋白饮食模式及适当体育锻炼。 Abstract:Objective To explore the associations between physiological factors, psychosocial factors, dietary habits, lifestyles and hyperuricemia (HUA) and provide the evidence for hyperuricemia intervention. Methods From 2016 to 2017, adults during their checkup in the health management center of the Second Affiliated Hospital of Dalian Medical University were interviewed with self-designed questionnaire and received the health examinations. To determine the influence of socio-economic data, life style habits and psychological factors on the risk of HUA, the classification tree model was adopted. Results A total of 4 118 subjects were enrolled in the study, with an average age of (52.8±7.9) years. The results showed that the prevalence of HUA was higher among people under 30 years old and 40-50 years old who are smoking, drinking and doing the sedentary work, who unsatisfied with their work and under a great mental stress. Factor analysis model identified three dietary patterns, traditional model, fried and smoked food and dessert model and high quality protein model, the cumulative variance contribution rate was 53.886%. In multivariate model, it was found that high-quality protein pattern, physical exercise and fasting plasma glucose (FPG) were negatively associated with HUA. Male, smoking, drinking, having dyslipidemia, higher body mass index (BMI) were risk factors for HUA. Subgroup analysis showed that in both male and female, the high-quality protein patterns were negatively associated with HUA. The pattern of fried and smoked food and dessert patterns was the independent risk factors for HUA in female. Classification tree model showed that male, dyslipidemia, higher BMI grade, and the fried and smoked food and dessert pattern were the risk factors for HUA. Conclusions The influencing factors of HUA in different gender were different, which indicate the individualized health management should be adopted. Male who is overweight or obese should quit smoking and drinking. Women should pay more attention to avoid of the excess intake of fried and smoked food and dessert. Meanwhile, a high-quality protein diet and more physical exercise should be encouraged. -
Key words:
- Serum uric acid /
- Hyperuricemia /
- Risk factors
-
表 1 高尿酸血症检出情况[n(%)]
Table 1. Detection of hyperuricemia [n(%)]
特征 人数 HUA(%) 95% CI值 χ2值 P值 性别 245.524 < 0.001 男 2 867 754(26.3) (24.7,27.9) 女 1 251 64(5.12) (3.89, 6.34) 年龄(岁) 11.251 0.024 < 30 21 7(33.34) (11.35,55.32) 30~ 190 30(15.79) (10.56,21.02) 40~ 1 159 242(20.88) (18.54,23.22) 50~ 1 994 414(20.76) (18.98,22.54) 60~90 754 125(16.57) (13.92,19.24) 吸烟 73.739 < 0.001 不吸烟 2 433 378(15.54) (14.10,16.98) 已戒烟 411 121(29.44) (25.02,33.87) 吸烟 1 274 319(25.04) (22.66,27.42) 饮酒 120.080 < 0.001 不饮酒 1 360 146(10.74) (9.09,12.38) 已戒酒 455 82(18.02) (14.48,21.57) 饮酒 2 303 590(25.62) (23.83,27.40) 体育锻炼 10.323 0.001 是 2 270 410(18.06) (16.48,19.65) 否 1 848 408(22.08) (20.19,23.97) 工作方式 14.996 0.001 静坐为主 2 349 512(21.80) (20.13,23.47) 轻度活动 1 739 304(17.48) (15.69,19.27) 体力劳动 30 2(6.67) (-2.80,16.14) 生活满意度 1.894 0.755 很不满意 19 5(26.32) (4.51,48.12) 不满意 48 9(18.75) (7.30,30.20) 一般 423 93(21.98) (18.02,25.95) 满意 2 738 537(19.61) (18.12,21.10) 很满意 890 174(19.55) (16.94,22.16) 工作满意度 18.023 0.001 很不满意 14 3(21.43) (-3.16,46.01) 不满意 75 17(22.67) (12.97,32.36) 一般 965 147(15.23) (12.96,17.50) 满意 2 483 536(21.58) (19.97,23.21) 很满意 581 115(19.79) (16.54,23.04) 精神压力 23.095 < 0.001 没有压力 765 110(14.38) (11.89,16.87) 压力较少 684 135(19.74) (16.75,22.73) 一般 1 078 214(19.85) (17.47,22.24) 压力较大 1 392 308(22.13) (19.94,24.31) 压力极大 199 51(25.63) (19.51,31.75) 沮丧情绪 4.211 0.122 没有 964 193(20.02) (17.49,22.55) 偶尔 2 765 563(20.36) (18.86,21.86) 经常 389 62(15.94) (12.28,19.59) 焦虑情绪 1.185 0.553 没有 933 185(19.83) (17.27,22.39) 偶尔 2 724 550(20.19) (18.68,21.70) 经常 461 83(18.00) (14.48,21.52)  下载: 导出CSV
表 2 膳食因子载荷量
Table 2. Dietary factor load
食物 传统模式 油炸腌熏甜点模式 优质蛋白模式 谷类 0.773 -0.209 0.063 肉类 0.776 0.214 -0.050 鱼、水产品 0.221 0.451 0.213 蔬果 0.667 -0.259 0.265 奶类 -0.154 0.101 0.725 蛋类 0.336 -0.015 0.665 豆类 0.120 0.114 0.703 甜点 -0.140 0.608 0.196 油炸 -0.173 0.786 0.024 腌熏 -0.028 0.701 -0.090 特征根 2.252 1.987 1.150 方差贡献率 18.961 18.621 16.304 累计贡献率 18.961 37.582 53.886
下载: 导出CSV
表 3 总人群高尿酸血症回归模型
Table 3. Regression model of total population hyperuricemia
因素 分类 单因素 调整模型 OR(95% CI)值 OR(95% CI)值 传统模式 T1 1.00 1.00 T2 0.97(0.77~1.22) 0.94(0.74~1.21) T3 1.31(1.05~1.64) 1.11(0.88~1.40) T4 1.24(1.00~1.55) 1.05(0.83~1.33) 油炸腌熏甜点模式 T1 1.00 1.00 T2 1.21(0.96~1.52) 1.01(0.79~1.28) T3 1.28(1.02~1.61)a 1.02(0.79~1.29) T4 1.39(1.10~1.74)b 1.09(0.85~1.39) 优质蛋白模式 T1 1.00 1.00 T2 0.78(0.64~0.97)a 0.83(0.66~1.03) T3 0.66(0.53~0.82)b 0.74(0.59~0.94)a T4 0.63(0.50~0.78)b 0.77(0.61~0.97)a 性别 男=1,女=0 3.58(2.59~4.96)b 年龄 1.00(0.99~1.01) 吸烟 不吸烟=1 1.00 已戒烟=2 1.14(0.95~1.38) 吸烟=3 1.38(1.07~1.80)a 饮酒 不喝酒=1 1.00 已戒酒=2 1.02(0.74~1.41) 喝酒=3 1.31(1.04~1.65)a 体育锻炼 是=1,否=0 0.79(0.67~0.94)b 血脂异常 是=1,否=0 1.86(1.53~2.25)b BMI(kg/m2) 1.12(1.09~1.15)b FPG(mmol/L) 0.88(0.83~0.94)b 注:aP < 0.05,bP < 0.01。
下载: 导出CSV
表 4 不同性别高尿酸血症回归模型
Table 4. Regression Model of Hyperuricemia in Different Sexes
因素 分类 男单因素 男调整模型 女单因素 女调整模型 OR(95% CI)值 OR(95% CI)值 OR(95% CI)值 OR(95% CI)值 传统模式 T1 1.00 1.00 1.00 1.00 T2 0.89(0.69~1.14) 0.94(0.73~1.23) 1.05(0.50~2.20) 0.87(0.39~1.91) T3 1.05(0.83~1.34) 1.08(0.84~1.38) 1.56(0.74~3.27) 1.31(0.59~2.87) T4 0.97(0.76~1.23) 1.00(0.78~1.29) 2.21(1.08~4.52)a 1.58(0.72~3.46) 油炸腌熏甜点模式 T1 1.00 1.00 1.00 1.00 T2 1.06(0.83~1.37) 1.00(0.77~1.30) 0.96(0.44~2.07) 0.90(0.40~2.05) T3 1.08(0.84~1.39) 0.98(0.75~1.27) 1.46(0.70~3.03) 1.37(0.62~3.01) T4 1.12(0.87~1.44) 1.01(0.78~1.32) 2.15(1.08~4.51)a 1.97(1.00~4.30)a 优质蛋白模式 T1 1.00 1.00 1.00 1.00 T2 0.82(0.65~1.02) 0.84(0.67~1.06) 0.61(0.28~1.31) 0.69(0.30~1.58) T3 0.69(0.54~0.87)b 0.73(0.57~0.93)a 0.93(0.46~1.87) 1.06(0.49~2.29) T4 0.70(0.55~0.88)b 0.77(0.60~0.99)a 0.80(0.40~1.62) 0.84(0.19~4.18) 注:a:P < 0.05,b:P < 0.01。男、女调整模型调整变量为年龄、吸烟、饮酒、体育锻炼、血脂异常、BMI、FPG。
下载: 导出CSV
表 5 变量赋值说明
Table 5. Variable assignment description
指标名称 定义及赋值 解释变量 性别 女=0,男=1 年龄 连续性变量 吸烟 不吸烟=1,已戒烟=2,吸烟=3 饮酒 不饮酒=1,已戒酒=2,饮酒=3 传统模式 T1=1,T2=2,T3=3,T4=4 油炸腌熏甜点模式 T1=1,T2=2,T3=3,T4=4 优质蛋白模式 T1=1,T2=2,T3=3,T4=4 体育锻炼 不足20分钟体育锻炼=0,每天20分钟以上体育锻炼=1 工作方式 静坐为主=1,轻度活动=2,体力劳动=3 工作满意度 很不满意=1,不满意=2,一般=3,满意=4,很满意=5 精神压力 没有压力=1,压力较少=2,一般=3,压力较少=4,压力极大=5 血脂异常 否=0,是=1 BMI 连续性变量 FPG 连续性变量 BMI等级 消瘦=1,正常=2,超重=3,肥胖=4 因变量 未患HUA=0,患HUA=1
下载: 导出CSV
-
[1] Yu TY, Jee JH, Bae JC, et al. Serum uric acid: A strong and independent predictor of metabolic syndrome after adjusting for body composition(Article)[J]. Metabolism, 2016, 65(4): 432-440. DOI: 10.1016/j.metabol.2015.11.003. [2] Hayashino Y, Okamura S, Tsujii S, et al. Association of serum uric acid levels with the risk of development or progression of albuminuria among Japanese patients with type 2 diabetes: a prospective cohort study[diabetes distress and care registry at Tenri (DDCRT 10)] [J]. Acta Diabetol, 2016, 53(4): 599-607. DOI: 10.1007/s00592-015-0825-x. [3] Kanbay M, Solak Y, Afsar B, et al. Serum uric acid and risk for acute kidney injury following contrast[J]. Angiology, 2017, 68(2): 132-144. DOI: 10.1177/0003319716644395. [4] Ickmans K, Clarys P, Nijs J, et al. Association between cognitive performance, physical fitness, and physical activity level in women with chronic fatigue syndrome[J]. J Rehabil Res Dev, 2013, 50(6):795-810. DOI: 10.1682/JRRD.2012.08.0156.DOI:10.1007/s12603-012-0076-2. [5] Xiong Z, Zhu C, Qian X, et al. Serum uric acid is associated with dietary and lifestyle factors in elderly women in suburban guangzhou in guangdong province of south China[J]. J Nutr Health Aging, 2013, 17(1): 30-34. DOI: 10.1007/s12603-012-0076-2. [6] 张苗. 中老年人不同性别血尿酸与非酒精性脂肪肝的相关性研究——基于横断面研究和纵向队列研究[D]. 广州: 暨南大学, 2017.Zhang M. Study on the correlation between serum uric acid and non-alcoholic fatty liver in middle-aged and elderly people of different sexes: based on cross-sectional study and longitudinal cohort study[D]. Guangzhou: Jinan University, 2017. [7] 中国成人血脂异常防治指南修订联合委员会. 中国成人血脂异常防治指南(2016年修订版)[J]. 中华健康管理学杂志, 2017, 11(1): 7-28. DOI: 10.3760/cma.j.issn.1674-0815.2017.01.003.Joint committee issued Chinese guideline for the prevention and treatment of dyslipidemia. 2016 Chinese guideline for the management of dyslipidemia in adults[J]. Chinese Journal of Health Management, 2017, 11(1): 7-28. DOI: 10.3760/cma.j.issn.1674-0815.2017.01.003. [8] Li X, Song P, Li J, et al. Relationship between hyperuricemia and dietary risk factors in Chinese adults: a cross-sectional study[J]. Rheumatol Int, 2015, 35(12): 2079-2089. DOI: 10.1007/s00296-015-3315-0. [9] Hak AE, Choi HK. Menopause, postmenopausal hormone use and serum uric acid levels in US women——the third national health and nutrition examination survey[J]. Arthritis Res Ther, 2008, 10(5): R116. DOI: 10.1186/ar2519. [10] Guan S, Tang Z, Fang X, et al. Prevalence of hyperuricemia among Beijing post-menopausal women in 10 years[J]. Arch Gerontol Geriatr, 2016, 64: 162-166. DOI: 10.1016/j.archger.2016.02.002. [11] Zhang M, Chang H, Gao Y, et al. Major dietary patterns and risk of asymptomatic hyperuricemia in Chinese adults[J]. J Nutr Sci Vitaminol (Tokyo), 2012, 58(5): 339-345. DOI: 10.3177/jnsv.58.339. [12] Chuang SY, Lee SC, Hsieh YT, et al. Trends in hyperuricemia and gout prevalence: nutrition and health survey in Taiwan from 1993-1996 to 2005-2008[J]. Asia Pac J Clin Nutr, 2011, 20(2): 301-308. [13] 王子楠, 庄媛媛. 膳食结构对高尿酸血症的影响[J]. 中国老年学杂志, 2015, 35(23): 6937-6938. DOI: 10.3969/j.issn.1005-9202.2015.23.134.Wang ZN, Zhuang YY. Effect of dietary structure on hyperuricemia[J]. Chin J Gerontol, 2015, 35(23): 6937-6938. DOI: 10.3969/j.issn.1005-9202.2015.23.134. [14] Liu X, Huang S, Xu W, et al. Association of dietary patterns and hyperuricemia: a cross-sectional study of the Yi ethnic group in China[J]. Food Nutr Res, 2018, 62. DOI: 10.29219/fnr.v62.1380. [15] Ekpenyong CE, Daniel N. Roles of diets and dietary factors in the pathogenesis, management and prevention of abnormal serum uric acid levels[J]. PharmaNutrition, 2015, 3(2): 29-45. DOI: 10.1016/j.phanu.2014.12.001. [16] Cui L, Meng L, Wang G, et al. Prevalence and risk factors of hyperuricemia: results of the Kailuan cohort study[J]. Mod Rheumatol, 2017, 27(6): 1066-1071. DOI: 10.1080/14397595.2017.1300117. [17] Shen Y, Wang Y, Chang C, et al. Prevalence and risk factors associated with hyperuricemia among working population at high altitudes: a cross-sectional study in Western China[J]. Clin Rheumatol, 201938(5): 1375-1384. . DOI: 10.1007/s10067-018-4391-9. [18] Li H, Zha X, Zhu Y, et al. An invert U-shaped curve: relationship between fasting plasma glucose and serum uric acid concentration in a large health check-up population in China[J]. Medicine(Baltimore), 2016, 95(16): e3456. DOI: 10.1097/MD.0000000000003456. -

 点击查看大图
计量
- 文章访问数: 229
- HTML全文浏览量: 197
- PDF下载量: 21
- 被引次数: 0