

Dynamic response analysis of economic development and infant mortality rate in China from 1991 to 2018
-
摘要:
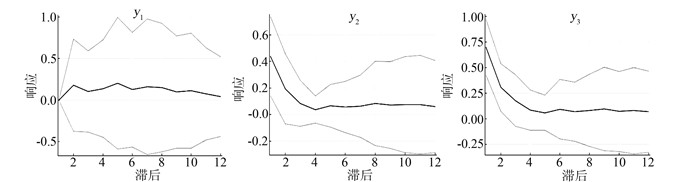
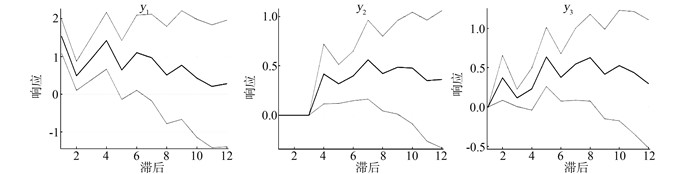
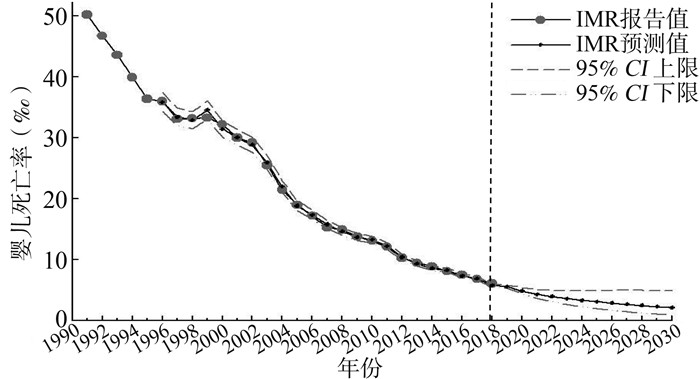
目的 探讨我国经济发展与婴儿死亡率之间的相互影响关系,预测我国婴儿死亡率的变化趋势。 方法 依据我国1991-2018年国民生产总值(gross domestic product, GDP)、卫生总费用(total expenditure on health, TEH)和婴儿死亡率(infant mortality rate, IMR)数据,构建向量自回归(vector autoregression, VAR)模型,并以此预测我国2030年婴儿死亡率水平。 结果 VAR(4)模型R2=0.86, AIC=-20.37, SBC=-18.44; GDP是IMR降低和TEH增长的格兰杰原因(χ2=20.97, P < 0.001),IMR和GDP是TEH增长的格兰杰原因(χ2=18.07, P < 0.001);GDP、TEH的新息冲击对婴儿健康水平产生正向中长期响应,12期时对IMR变化的贡献度分别是11.04%和69.49%。GDP受IMR和TEH新息冲击产生正向响应。预测至2030年时我国的IMR为2.13‰(95% CI: 0.93‰~4.90‰)。 结论 经济发展和卫生投入的增加使我国婴儿死亡率有效下降,而相应地,婴儿死亡率下降和卫生投入的增加也促进了我国经济发展。 Abstract:Objective To explore the interactional relationship between economic development and infant mortality in China, and to predict the changing trend of infant mortality in China. Methods Based on gross domestic product (GDP), total expenditure on health (TEH) and infant mortality rate (IMR) data of China from 1991 to 2018, a vector autoregressive model was constructed to predict the infant mortality level of China in 2030. Results The results of VAR (4) model showed that R2=0.86, AIC=-20.37 and SBC=-18.44. The Granger cause of IMR decrease and TEH increase was GDP (χ2=20.97, P < 0.001). The Granger causes of TEH increase were IMR and GDP (χ2=18.07, P < 0.001). The impact of innovations in GDP and TEH had a positive medium-to-long-term response to infant health, and the contribution to IMR changes at 12 periods were 11.04% and 69.49 %, respectively. GDP was positively affected by the impact of IMR and TEH innovation. It was expected that IMR of China would drop to 2.13 ‰ (95% CI: 0.93 ‰-4.90‰) by 2030. Conclusions The increase of economic development and health investment has effectively reduced infant mortality in China. accordingly, the decline in infant mortality and increase in health investment have also promoted the economic development of China. -

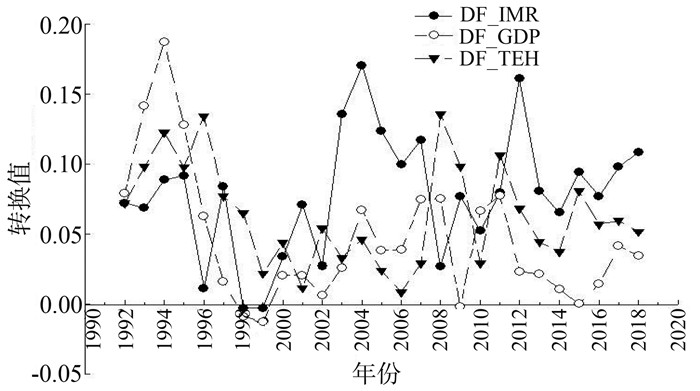
图 1 数据转换和1阶差分处理后GDP、TEH及IMR序列图
Figure 1. Sequence diagram of GDP, TEH and IMR after data conversion and first order

表 1 我国1991-2018年GDP、TEH及IMR的变化情况
Table 1. Changes of GDP, TEH and IMR in China from 1991 to 2018
年份 GDP名义值(亿元) GDP平减指数a(%) GDP实际值b(亿元) TEH名义值(亿元) TEH实际值c(亿元) IMR(‰) 1991 22 005.6 308.1 7 142.36 893.49 290.00 50.2 1992 27 194.5 351.9 7 727.91 1 096.86 311.70 46.7 1993 35 673.2 400.7 8 902.72 1 377.78 343.84 43.6 1994 48 637.5 453.0 10 736.75 1 761.24 388.79 39.9 1995 61 339.9 502.6 12 204.52 2 155.13 428.80 36.4 1996 71 813.6 552.5 12 997.94 2 709.42 490.39 36.0 1997 79 715.0 603.5 13 208.78 3 196.71 529.70 33.1 1998 85 195.5 650.8 13 090.89 3 678.72 565.26 33.2 1999 90 564.4 700.7 12 924.85 4 047.50 577.64 33.3 2000 100 280.1 760.2 13 191.28 4 586.63 603.35 32.2 2001 110 863.1 823.6 13 460.79 5 025.93 610.24 30.0 2002 121 717.4 898.8 13 542.21 5 790.03 644.20 29.2 2003 137 422.0 989.0 13 895.05 6 584.10 665.73 25.5 2004 161 840.2 1 089.0 14 861.36 7 590.29 697.00 21.5 2005 187 318.9 1 213.1 15 441.34 8 659.91 713.87 19.0 2006 219 438.5 1 367.4 16 047.86 9 843.34 719.86 17.2 2007 270 092.3 1 562.0 17 291.44 11 573.96 740.97 15.3 2008 319 244.6 1 712.8 18 638.76 14 535.40 848.63 14.9 2009 348 517.7 1 873.8 18 599.51 17 541.91 936.17 13.8 2010 412 119.3 2 073.1 19 879.37 19 980.39 963.79 13.1 2011 487 940.2 2 271.1 21 484.75 24 345.91 1 071.99 12.1 2012 538 580.0 2 449.6 21 986.45 28 119.00 1 147.90 10.3 2013 592 963.2 2 639.9 22 461.58 31 668.94 1 199.63 9.5 2014 643 563.1 2 835.9 22 693.43 35 312.39 1 245.19 8.9 2015 688 858.2 3 035.6 22 692.65 40 974.64 1 349.80 8.1 2016 746 395.1 3 243.5 23 012.03 46 344.89 1 428.85 7.5 2017 832 035.9 3 468.8 23 986.27 52 598.28 1 516.32 6.8 2018 91 9281.1 3 703.0 24 825.31 59 121.90 1 596.59 6.1 注:aGDP平减指数:以1978年GDP指数=100; bGDP实际值:某年GDP实际值=GDP名义值*100/该年GDP指数; cTEH实际值:某年TEH实际值=TEH名义值*100/该年GDP指数。  下载: 导出CSV
表 2 1阶差分处理后各序列ADF检验结果
Table 2. ADF test results of each sequence after first-order difference processing
变量 类型 Rho值 P值 GDP 单均值 -15.84 0.014 趋势 -18.26 0.038 TEH 单均值 -14.36 0.024 趋势 -15.34 0.093 1/IMR 单均值 -13.97 0.027 趋势 -17.11 0.055
下载: 导出CSV
表 3 不同滞后期数p的信息准则变化
Table 3. Changes in the information criterion for different lag numbers p
滞后期数p AICC值a AIC值b SBC值c HQC值d FPEC值e 0 -19.27 -19.28 -19.14 -19.24 4.23*10-9 1 -19.60 -19.77 -19.19 -19.60 2.61*10-9 2 -19.13 -19.78 -18.76 -19.50 2.67*10-9 3 -18.28 -20.06 -18.59 -19.67 2.27*10-9 4 -17.04 -21.45 -19.52 -20.96 7.61*10-10 5 -11.46 -23.10 -20.72 -22.54 3.01*10-10e 注:a是修正的AICC下选择最优滞后阶数;b是AIC下选择最优滞后阶数;c是SBC下选择最优滞后阶数;d是HQ准则(hannan-quinn criterion, HQC)下选择最优滞后阶数;e是最终预测误差准则(Final prediction error criterion, FPEC)下选择最优滞后阶数。
下载: 导出CSV
表 4 VAR(4)模型参数估计
Table 4. Parameter estimation of VAR (4) model
参数 y1 y2 y3 估计值 P值 估计值 P值 估计值 P值 C 0.02 0.650 0.04 0.252 0.04 0.249 y1, t-1 0.68 < 0.001 -0.01 0.946 0.04 0.170 y2, t-1 0.65 0.066 0.79 0.002 0.61 0.037 y3, t-1 1.21 < 0.001 -0.33 0.079 0.01 0.965 y1, t-2 -0.17 0.295 -0.31 0.022 -0.07 0.683 y2, t-2 -1.47 < 0.001 -0.23 0.414 -0.19 0.612 y3, t-2 -0.53 0.038 0.23 0.267 0.18 0.486 y1, t-3 0.57 < 0.001 0.30 0.014 -0.03 0.824 y2, t-3 0.80 0.006 0.18 0.435 0.08 0.769 y3, t-4 0.41 0.134 0.003 0.991 -0.29 0.263 y1, t-4 -0.66 < 0.001 0.11 0.378 0.17 0.329 y2, t-4 -0.82 0.001 -0.31 0.149 0.12 0.621 y3, t-4 0.08 0.727 -0.33 0.107 0.20 0.412
下载: 导出CSV
表 5 y1不同滞后预测方差分解
Table 5. Variance decomposition of y1 with different lag predictions
滞后 y1 y2 y3 1 100.00 0.00 0.00 2 40.66 4.45 54.89 3 37.01 5.55 57.44 4 28.82 5.44 65.74 5 22.51 4.21 73.28 6 22.32 6.85 70.83 7 21.58 8.78 69.64 8 20.95 8.57 70.48 9 20.81 8.56 70.63 10 20.22 9.17 70.61 11 19.79 10.49 69.72 12 19.49 11.04 69.47
下载: 导出CSV
-
[1] 张延群.向量自回归模型的理论方法及应用实例[M].北京:中国社会科学出版社, 2013.Zhang YQ. Theoretical methods and application examples of vector autoregressive models[M]. Beijing: China Social Sciences Press, 2013. [2] 中华人民共和国国家卫生健康委员会. 2019中国卫生健康统计年鉴[M].北京:中国协和医科大学出版社, 2019.National Health Commission of the People's Republic of China. 2019 China Health Statistics Yearbook[M]. Beijing: Peking Union Medical College Press, 2019. [3] 杨建芳, 龚六堂, 张庆华.人力资本形成及其对经济增长的影响—一个包含教育和健康投入的内生增长模型及其检验[J].管理世界, 2006, (5):10-18, 34, 171. DOI:10.19744/j.cnki. 11-1235/f.2006.05.002.Yang JF, Gong LT, Zhang QH. Human capital formation and its impact on economic growth: an endogenous growth model including education and health investment and its test[J]. Manag World, 2006, (5):10-18, 34, 171. DOI:10.19744/j.cnki. 11-1235/f.2006.05.002.cnki.11-1235/f. 2006.05.002. [4] 中华人民共和国国家卫生健康委员会. 2019年我国卫生健康事业发展统计公报[EB/OL].(2020-06-06)[2020-08-30].http://www.nhc.gov.cn/guihuaxxs/s10748/202006/ebfe31f24cc145b198dd730603ec4442.shtml.National Health Commission of China. Statistical Bulletin on the Health Care in China of 2019[EB/OL].(2020-06-06)[2020-8-30].http://www.nhc.gov.cn/guihuaxxs/s10748/202006/ebfe31f24cc145b198dd730603ec4442.shtml. [5] 罗波艳, 梁芳, 赵丽婷, 等.兰州市2010-2014年5岁以下儿童死亡分析[J].中华疾病控制杂志, 2016, 20(7):683-686. DOI: 10.16462/j.cnki.zhjbkz.2016.07.010.Luo BY, Liang F, Zhao LT, et al. Mortality analysis on children under 5 years old in Lanzhou City from 2010 to 2014[J]. Chin J Dis Control Prev. 2016, 20(7):683-686. DOI: 10.16462/j.cnki.zhjbkz.2016.07.010.zhjbkz.2016.07.010. [6] 仇赛云, 李智, 杨蕊, 等.全球和中国5岁以下儿童死亡变化趋势及死因变化[J].卫生软科学, 2019, 33(5):92-97. DOI: 10.3969/j.issn.1003-2800.2019.05.021.Qiu SY, Li Z, Yang R, et al. Death change trends and death causes of children under five years old in China and worldwide[J]. Soft Sci Health, 2019, 33(5):92-97. DOI: 10.3969/j.issn.1003-2800.2019.05.021. [7] 国家统计局. 2018年《中国儿童发展纲要(2011-2020年)》统计监测报告[N].中国信息报, 2019-12-10(002).National Bureau of Statistics. Statistical monitoring report of the "Chinese Children's Development Outline (2011-2020)" in 2018[N]. China Information Daily, 2019-12-10 (002). [8] 赵梓伶, 蒋莉华, 何琳坤, 等.国内外新生儿死亡率、婴儿死亡率与5岁以下儿童死亡率关系研究[J].中国妇幼保健, 2016, 31(13):2585-2588. DOI:10.7620/zgfybj.j.issn.1001-4411.2016.13. 03.Zhao ZL, Jiang LH, He LK, et al. Study on the relationship between neonatal mortality, infant mortality and under-5 mortality in China and abroad[J]. Maternal and Child Health Care of China, 2016, 31(13):2585-2588. DOI:10.7620/zgfybj.j.issn.1001-4411.2016.13. 03. [9] 黄润龙. 1991-2014年我国婴儿死亡率变化及其影响因素[J].人口与社会, 2016, 32(3):67-75. DOI: 10.14132/j.2095-7963.2016.03.007.Huang RL. Changes in Infant Mortality and Its Influencing Factors in China from 1991 to 2014[J]. Popul Soc, 2016, 32(3):67-75. DOI: 10.14132/j.2095-7963.2016.03.007. [10] 陈健生.经济增长、人力资本投资与降低婴儿死亡率[J].经济评论, 2006, (1):54-59. DOI: 10.19361/j.er.2006.01.009.Chen JS. Economic growth, human capital investment and reduction of infant mortality[J]. Econ Rev, 2006, (1): 54-59. DOI: 10.19361/j.er.2006.01.009. [11] 陈勇.我国区域城乡婴儿死亡率影响模式的多视角研究[D].成都: 四川大学, 2006.Chen Y. A multi-perspective study on the impact model of regional urban and rural infant mortality in China[D]. Chengdu: Sichuan University, 2006. [12] Narayan S, Narayan PK, Mishra S. Investigating the relationship between health and economic growth: empirical evidence from a panel of 5 Asian countries[J]. J Asian Econ, 2010, 21(4):404-411. DOI: 10.1016/j.asieco.2010.03.006. [13] Sülkü SN, Caner A. Health care expenditures and gross domestic product: the Turkish case[J]. Eur J Health Econ, 2011, 12(1):29-38. DOI: 10.1007/s10198-010-0221-y. [14] Rosa Aísa, Pueyo F. Government health spending and growth in a model of endogenous longevity[J]. Econ Lett, 2006, 90(2):249-253. DOI: 10.1016/j.econlet.2005.08.003. [15] 夏新斌, 阳晓.我国卫生支出与经济增长研究[J].合作经济与科技, 2016, (19):14-16. DOI: 10.13665/j.cnki.hzjjykj.2016.19.005.Xia XB, Yang X. Research on China's health expenditure and economic growth[J]. Coop Econ Sci, 2016, (19):14-16. DOI:10.13665/j.cnki.hzjjykj. 2016.19.005. [16] 林长云.我国政府卫生资金投入空间分布及公平性研究[D].长春: 吉林大学, 2019.Lin CY. Study on the spatial distribution and fairness of Chinese government's health fund investment[D].Changchun: Jilin University, 2019. -


 点击查看大图
计量
- 文章访问数: 534
- HTML全文浏览量: 176
- PDF下载量: 62
- 被引次数: 0