

Prediction of disease burden of esophageal cancer in China based on ARIMA and NNAR models
-
摘要:
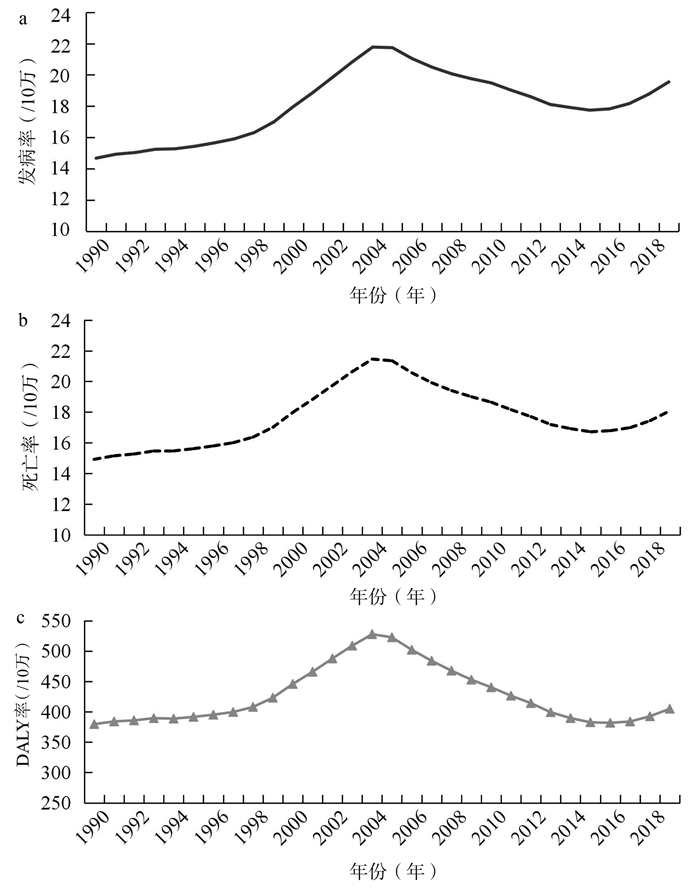
目的 探索中国食管癌疾病负担时间序列特征,并进行预测。 方法 收集1990—2019年中国食管癌发病率、死亡率、伤残调整寿命年(disability adjusted life year, DALY)等疾病负担数据,基于1990—2016年数据建立自回归移动平均(autoregressive integrated moving average, ARIMA)模型、神经网络自回归(neural network autoregression, NNAR)模型,通过平均误差率(modulation error ratio, MER)、平均绝对百分比误差(mean absolute percentage error, MAPE)、平均绝对误差(mean absolute error, MAE)和均方根误差(root mean squared error, RMSE)比较2017—2019年预测数据与实际数据以验证模型预测性能,并预测2020—2024年食管癌疾病负担。 结果 1990—2019年中国食管癌疾病负担整体呈波动上升趋势,发病率上升33.26%,死亡率上升21.26%,DALY率上升6.66%。ARIMA模型与NNAR模型的预测值和实际值动态趋势基本一致,选择其中更优模型预测得到2020—2024年中国食管癌发病率分别为20.375/10万、21.057/10万、21.380/10万、21.341/10万和21.080/10万;死亡率分别为18.834/10万、19.647/10万、20.407/10万、20.889/10万和20.988/10万。DALY率分别为418.192/10万、431.123/10万、442.780/10万、452.376/10万和459.358/10万。 结论 中国食管癌疾病负担在2020—2024年将上升。NNAR模型在拟合中国食管癌疾病负担应用中具有良好预测性能与精度,可为疾病负担短期预测提供借鉴方法。 Abstract:Objective To explore the time series characteristics of the disease burden of esophageal cancer in China and predict the disease burden of esophageal cancer. Methods The incidence, mortality, and disability adjusted life year (DALY) of esophageal cancer in China from 1990 to 2019 were collected. autoregressive integrated moving average (ARIMA) model and neural network autoregression (NNAR) model were established based on the data from 1990 to 2016, and model prediction performance was verified by comparing 2017-2019 forecast data with actual data through mean absolute percentage error (MAPE), modulation error ratio (MER), mean absolute error (MAE) and root mean squared error (RMSE). The better model was applied to predict the disease burden of esophageal cancer from 2020 to 2024. Results From 1990 to 2019, the overall disease burden of esophageal cancer in China showed a fluctuating upward trend, with the incidence rate rising by 33.26%, the mortality rate rising by 21.26%, and the DALY rate rising by 6.66%. The predicted values of disease burden by ARIMA model and NNAR model were basically consistent with the actual dynamic trend. The incidence rate of esophageal cancer in China from 2020 to 2024 would be 20.375/100 000, 21.057/100 000, 21.380/100 000, 21.341/100 000, 21.080/100 000, and mortality rate would be 18.834/100 000, 19.647/100 000, 20.407/100 000, 20.889/100 000, 20.988/100 000, and the DALY rate would be 418.192/100 000, 431.123/100 000, 442.780/100 000, 452.376/100 000, and 459.358/100 000. Conclusions The disease burden of esophageal cancer in China will increase slightly from 2020 to 2024. The NNAR model demonstrates good prediction performance and accuracy in simulating the disease burden of esophageal cancer in China, and provides a reference method for short-term prediction of the disease burden. -

图 2 1990—2019年中国食管癌疾病负担趋势
Figure 2. Trends in the disease burden of esophageal cancer in China from 1990 to 2019

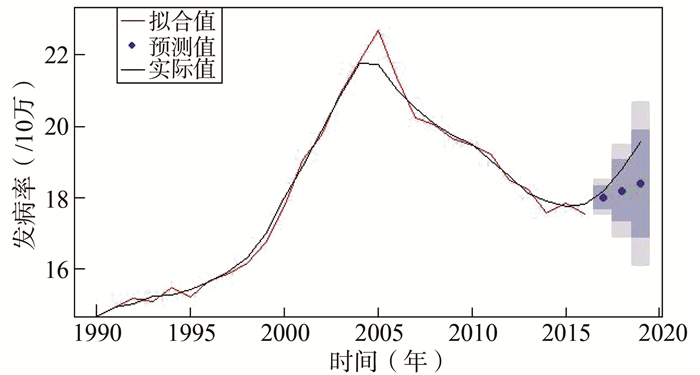
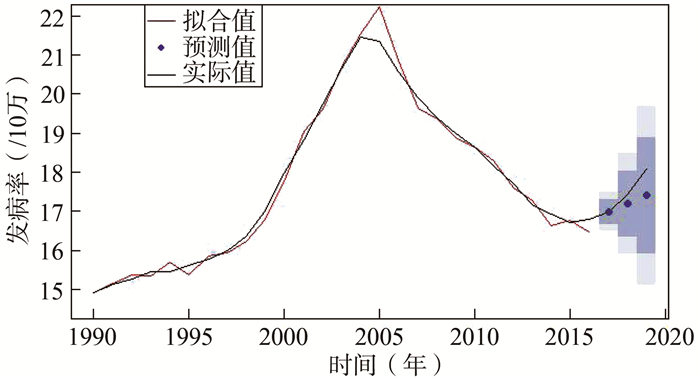
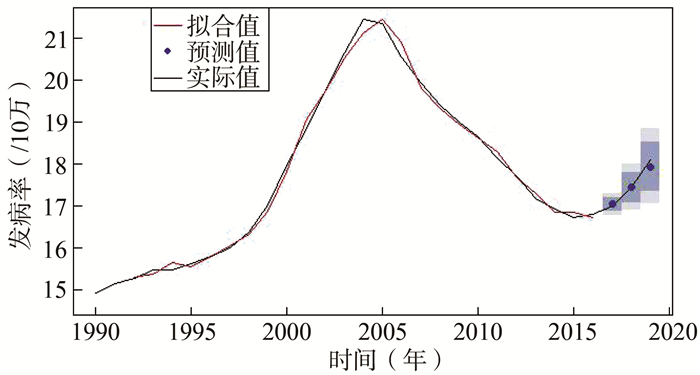
图 3 ARIMA(0, 2, 1)食管癌发病预测模型
Figure 3. ARIMA(0, 2, 1) esophageal cancer incidence prediction model

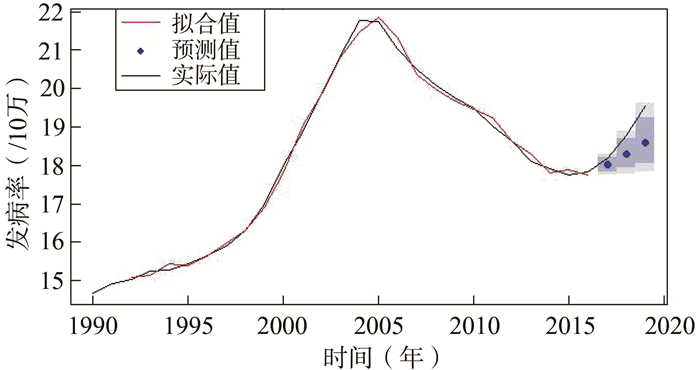
图 4 NNAR(2, 2)食管癌发病预测模型
Figure 4. NNAR (2, 2) esophageal cancer incidence prediction model

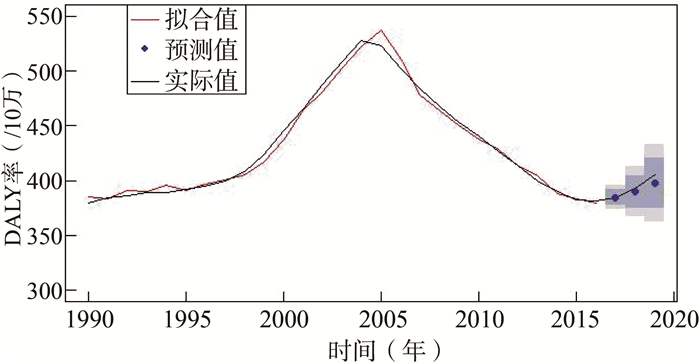
图 7 ARIMA(2, 0, 0)食管癌DALYs预测模型
Figure 7. ARIMA(2, 0, 0) DALYs prediction model for esophageal cancer

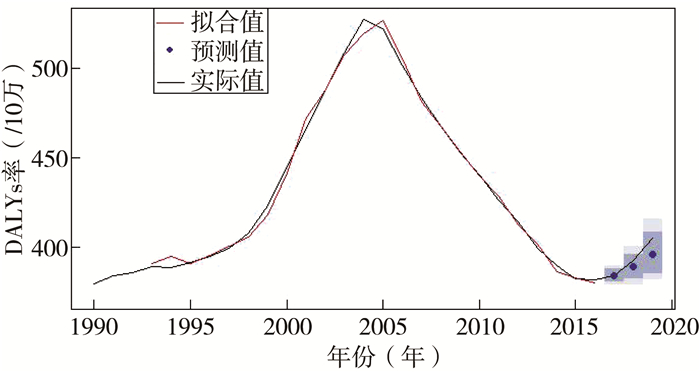
图 8 NNAR(3, 2)食管癌DALYs预测模型
Figure 8. NNAR(3, 2) DALYs prediction model for esophageal cancer
表 1 中国食管癌疾病负担预测模型对比
Table 1. Comparison of prediction models of esophageal cancer disease burden in China
模型 训练集 测试集 MAPE (%) MER (%) MAE RMSE MAPE (%) MER (%) MAE RMSE 发病率 ARIMA 0.920 0.945 0.170 0.248 3.312 3.375 0.636 0.759 NNAR 0.587 0.598 0.109 0.136 2.760 2.810 0.529 0.625 死亡率 ARIMA 0.911 0.935 0.166 0.237 1.756 1.796 0.314 0.424 NNAR 0.596 0.611 0.109 0.140 0.404 0.411 0.072 0.097 DALY率 ARIMA 0.920 0.955 4.119 5.283 0.875 0.890 3.506 4.516 NNAR 0.551 0.562 2.456 3.287 1.070 1.090 4.291 5.649  下载: 导出CSV
-
[1] Bray F, Ferlay J, Soerjomataram I, et al. Global cancer statistics 2018: GLOBOCAN estimates of incidence and mortality worldwide for 36 cancers in 185 countries[J]. CA Cancer J Clin, 2018, 68(6): 394-424. DOI: 10.3322/caac.21492. [2] GBD 2017 Oesophageal Cancer Collaborators. The global, regional, and national burden of oesophageal cancer and its attributable risk factors in 195 countries and territories, 1990-2017: a systematic analysis for the Global Burden of Disease Study 2017[J]. Lancet Gastroenterol Hepatol, 2020, 5(6): 582-597. DOI: 10.1016/S2468-1253(20)30007-8. [3] 寻鲁宁, 张帆, 孙纪新, 等. 基于求和自回归滑动平均模型的道路交通伤害死亡趋势预测分析[J]. 中华疾病控制杂志, 2020, 24(4): 467-472. DOI: 10.16462/j.cnki.zhjbkz.2020.04.019.Xun LN, Zhang F, Sun JX, et al. Prediction and analysis of road traffic injury death trend based on ARIMA model[J]. Chin J Dis Control Prev, 2020, 24(4): 467-472. DOI: 10.16462/j.cnki.zhjbkz.2020.04.019. [4] 庞艳蕾, 张惠兰, 李向云, 等. 灰色模型GM(1, 1)和ARIMA在拟合全国婴儿、5岁以下儿童死亡率中的应用[J]. 中国卫生统计, 2015, 32(3): 461-463. https://www.cnki.com.cn/Article/CJFDTOTAL-ZGWT201503029.htmPang YL, Zhang HL, Li XY, et al. Application of grey model GM(1, 1) and ARIMA in fitting the national mortality rate of infants and children under 5[J]. Chin J Heal Stat, 2015, 32(3): 461-463. https://www.cnki.com.cn/Article/CJFDTOTAL-ZGWT201503029.htm [5] Global Health Data Exchange. Global Burden of Disease Study 2019 (GBD 2019) Data Resources[EB/OL]. (2020-10-22)[2020-12-20]. http://ghdx.healthdata.org/gbd-2019. [6] Hyndman RJ, Athanasopoulos G. Forecasting: Principles and Practice: 11.3 Neural network models[M/OL]. 2nd ed. OTexts: Melbourne, Australia. https://otexts.com/fpp2/nnetar.html. [7] Li ZQ, Wang ZZ, Song H, et al. Application of a hybrid model in predicting the incidence of tuberculosis in a Chinese population[J]. Infect Drug Resist, 2019, 12: 1011-1020. DOI: 10.2147/IDR.S190418. [8] 郭兰伟, 石春雷, 黄慧瑶, 等. 中国1996—2015年食管癌经济负担研究的系统综述[J]. 中华流行病学杂志, 2017, 38(1): 102-109. DOI: 10.3760/cma.j.issn.0254-6450.2017.01.020.Guo LW, Shi CL, Huang HY, et al. Economic burden of esophageal cancer in China from 1996 to 2015: a systematic review[J]. Chin J Epidemiol, 2017, 38(1): 102-109. DOI: 10.3760/cma.j.issn.0254-6450.2017.01.020. [9] Yu HK, Kim NY, Kim SS, et al. Forecasting the number of human immunodeficiency virus infections in the Korean population using the autoregressive integrated moving average model[J]. Osong Public Health Res Perspect, 2013, 4(6): 358-362. DOI: 10.1016/j.phrp.2013.10.009. [10] He ZR, Tao HB. Epidemiology and ARIMA model of positive-rate of influenza viruses among children in Wuhan, China: A nine-year retrospective study[J]. Int J Infect Dis, 2018, 74: 61-70. DOI: 10.1016/j.ijid.2018.07.003. [11] Sharafi M, Ghaem H, Tabatabaee HR, et al. Forecasting the number of zoonotic cutaneous leishmaniasis cases in south of Fars province, Iran using seasonal ARIMA time series method[J]. Asian Pac J Trop Med, 2017, 10(1): 79-86. DOI: 10.1016/j.apjtm.2016.12.007. [12] 张欣, 刘振球, 袁黄波, 等. 神经网络自回归模型在丙肝发病趋势和预测研究中的应用[J]. 中国卫生统计, 2020, 37(4): 524-526. https://www.cnki.com.cn/Article/CJFDTOTAL-ZGWT202004011.htmZhang X, Liu ZQ, Yuan HB, et al. Application of neural network autoregressive model in the study of hepatitis C incidence trend and prediction[J]. Chin J Heal Stat, 2020, 37(4): 524-526. https://www.cnki.com.cn/Article/CJFDTOTAL-ZGWT202004011.htm [13] 吴伟, 安淑一, 郭军巧, 等. 非线性自回归神经网络在肾综合征出血热流行趋势预测中的应用[J]. 中华流行病学杂志, 2015, 36(12): 1394-1396. DOI: 10.3760/cma.j.issn.0254-6450.2015.12.017.Wu W, An SY, Guo JQ, et al. Application of nonlinear autoregressive neural network in predicting incidence tendency of hemorrhagic fever with renal syndrome[J]. Chin J Epidemiol, 2015, 36(12): 1394-1396. DOI: 10.3760/cma.j.issn.0254-6450.2015.12.017. [14] 李蔚, 吴恺逾, 陈坚红, 等. 基于非线性自回归神经网络和随机森林算法的核电汽轮机组出力优化[J]. 中国电机工程学报, 2021, 41(2): 409-416. DOI: 10.13334/j.0258-8013.pcsee.200761.Li W, Wu KY, Chen JH, et al. Output Optimization of Nuclear Power Steam Turbine Based on Nonlinear Autoregressive Neural Network and Random Forest Algorithm[J]. Proc Chin Soc Elect Eng, 2021, 41(2): 409-416. DOI: 10.13334/j.0258-8013.pcsee.200761. [15] 李环, 孙素芬, 罗长寿. 基于NARX神经网络的粮食产量预测模型[J]. 江苏农业科学, 2020, 48(22): 228-232. DOI: 10.15889/j.issn.1002-1302.2020.22.043.Li H, Sun SF, Luo CS. Forecast model of grain yield based on NARX neural network[J]. Jiangsu Agric Sci, 2020, 48(22): 228-232. DOI: 10.15889/j.issn.1002-1302.2020.22.043. -

 点击查看大图

计量
- 文章访问数: 468
- HTML全文浏览量: 310
- PDF下载量: 96
- 被引次数: 0