

A study on the thresholds of temperature for early warning in different temperature zones of China based on the temperature-mortality relationships
-
摘要:
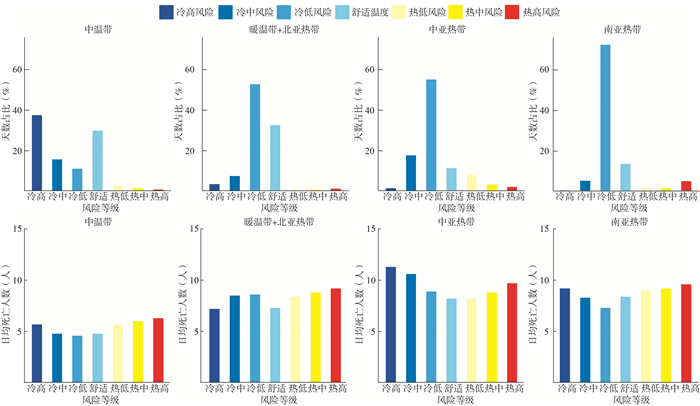
目的 估算中国不同气温带气温健康预警的阈值,为发展基于死亡风险的气温健康预警系统提供科学依据。 方法 收集2006―2017年全国364个县、区作为研究点的死亡与气象数据,利用分布滞后非线性模型(distribution lag non-linear model, DLNM)和多变量Meta方法分析气温与死亡的暴露反应关系,划分气温预警阈值。 结果 研究期间日平均气温16.0 ℃,日平均相对湿度73.0%,日均死亡人数为8.3例。不同气温带的气温-死亡的暴露反应关系总体上呈倒“J”型。中温带、暖温带+北亚热带、中亚热带以及南亚热带冷效应低风险气温范围分别9.1~13.8 ℃、0.1~19.3 ℃、8.8~24.3 ℃以及9.9~25.3 ℃,中风险分别为1.8~9.1 ℃、-6.1~0.1 ℃、1.5~8.8 ℃以及4.8~9.9 ℃,高风险分别为<1.8 ℃、<-6.1 ℃、<1.5 ℃以及<4.8 ℃;热效应低风险气温范围分别为23.4~24.8 ℃、28.6~29.3 ℃、27.2~29.5 ℃以及28.2~28.6 ℃,中风险分别为24.8~26.1 ℃、29.3~30.1 ℃、29.5~31.0 ℃以及28.6~29.0 ℃,高风险分别为>26.1 ℃、>30.1 ℃、>31.0 ℃以及>29.0 ℃。所有气温带在高温端的日均死亡人数均随着风险等级增加而升高,而除了暖温带+北亚热带外,其他气温带在低温端的日均死亡人数随着风险等级增加而升高。 结论 基于死亡风险可以确定气温预警的阈值并进行预警等级划分,预警效果较好。 Abstract:Objective To estimate the thresholds of temperature for health early warning in different temperature zones in China, our study aims to provide support for developing health early warning system of temperature. Methods Daily mortality and meteorological data were collected from 364 Chinese locations during 2006-2017. Distribution lag non-linear model (DLNM) and multivariate Meta analyses were applied to estimate the association between temperature and mortality, and identified the thresholds of temperature. Results Mean of daily temperature was 16.0 ℃. Mean of daily relative humidity was 73.0%. Mean of daily non-accidental mortality was 8.3 cases. The relationships of daily average temperature with mortality in different climate zones were inverted "J" type. For cold effect, the temperature ranges of low risk in the temperate zone, warm temperate or north subtropics, middle subtropics and south subtropics were 9.1-13.8 ℃, 0.1-19.3 ℃, 8.8-24.3 ℃ and 9.9-25.3 ℃, respectively; and they were 1.8-9.1 ℃, -6.1-0.1 ℃, 1.5-8.8 ℃ and 4.8-9.9 ℃ for medium risks of cold temperature, respectively; and they were < 1.8 ℃, < -6.1 ℃, < 1.5 ℃ and < 4.8 ℃ for high risk of cold temperature, respectively. For heat effect, the temperature ranges of low risk were 23.4-24.8 ℃, 28.6-29.3 ℃, 27.2-29.5 ℃ and 28.2-28.6 ℃, respectively; and they were 24.8-26.1 ℃, 29.3-30.1 ℃, 29.5-31.0 ℃ and 28.6-29.0 ℃ for medium risk of hot temperature, respectively; and they were > 26.1 ℃, > 30.1 ℃, > 31.0℃ and > 29.0 ℃ for high risk of hot temperature, respectively. For heat effect in all climate zones, the average daily mortality increased with the increase of risk grade, For cold effect, the average daily mortality increased with the increase of risk grade in other three climate zones, except in warm temperate zone and northern subtropical zone. Conclusion Based on the temperature-mortality relationship, we identified the thresholds of temperature for health early warning, and the effectiveness of the early warning based on the thresholds is well. -

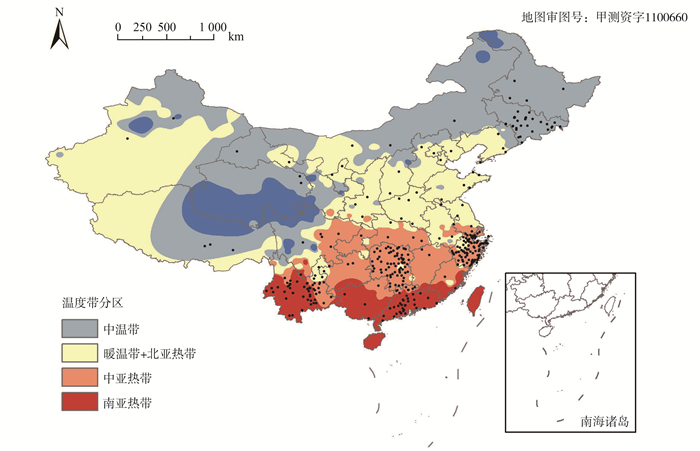
图 1 364个研究县、区在各气温带的分布情况
Figure 1. The distribution of 364 Counties/Districts in each temperature zone

图 2 四个气温带气温-死亡暴露反应关系曲线
Figure 2. Exposure response curve of air temperature and death in four climate zones

图 3 各气温阈值风险等级的天数占比以及日均死亡人数
Figure 3. The proportion of day and daily death toll of each temperature threshold risk grade
表 1 2006―2017年所有研究县、区气象资料、空气质量和居民日死亡人数情况[n (%)]
Table 1. Meteorological data, PM10 and daily mortality of all locations from 2006 to 2017 [n (%)]
变量 全国 中温带 暖温带+北亚热带 中亚热带 南亚热带 研究县、区数 364(100.00) 45(12.36) 49(13.46) 199(54.67) 71(19.51) 日均死亡数 总人群[(x±s),人] 8.3±6.3 5.2±4.3 8.1±6.3 9.1±6.5 7.7±5.7 0~<65岁[(x±s),人] 2.1±2.0 1.8±1.8 2.2±2.2 2.2±2.0 2.1±1.9 ≥65岁[(x±s),人] 6.2±5.0 3.4±3.1 5.9±4.9 7.0±5.3 5.6±4.5 气象与污染物 平均气温[(x±s),℃] 16.0±9.8 5.7±13.3 13.5±10.3 17.5±8.3 19.7±6.1 相对湿度[(x±s),%] 73.0±13.9 62.7±16.3 67.3±16.8 75.8±11.6 74.9±12.6 PM10[(x±s),μg/m3] 81.1±41.4 87.7±56.2 92.5±36.0 84.0±39.6 56.8±29.6  下载: 导出CSV
表 2 各风险级别RR值
Table 2. RR of each risk grade
类别 风险级别 RR(95% CI)值 中温带 暖温带+北亚热带 中亚热带 南亚热带 冷效应 高风险 >1.18(1.07~1.30) >1.67(1.46~1.91) >1.59(1.50~1.69) >1.67(1.43~1.94) 中风险 1.11(1.03~1.19)~1.18(1.07~1.30) 1.35(1.21~1.51)~1.67(1.46~1.91) 1.30(1.24~1.37)~1.59(1.50~1.69) 1.34(1.20~1.49)~1.67(1.43~1.94) 低风险 1.04(1.00~1.08)~1.11(1.03~1.19) 1.03(1.00~1.06)~1.35(1.21~1.51) 1.01(1.00~1.01)~1.30(1.24~1.37) 1.01(1.00~1.02)~1.34(1.20~1.49) 舒适温度 很低 1.04(0.99~1.08) 1.03(0.99~1.06)~1.06(0.99~1.13) 1.00(0.99~1.01)~1.01(0.99~1.01) 1.01(0.99~1.02)~1.04(0.99~1.09) 热效应 低风险 1.04(1.00~1.08)~1.07(1.01~1.13) 1.06(1.00~1.13)~1.08(1.00~1.16) 1.00(1.00~1.01)~1.04(1.02~1.06) 1.04(1.00~1.09)~1.06(1.01~1.12) 中风险 1.07(1.01~1.13)~1.10(1.02~1.19) 1.08(1.00~1.16)~1.10(1.01~1.20) 1.04(1.02~1.06)~1.08(1.05~1.11) 1.06(1.01~1.12)~1.08(1.01~1.15) 高风险 >1.10(1.02~1.19) >1.10(1.01~1.20) >1.08(1.05~1.11) >1.08(1.01~1.15)
下载: 导出CSV
表 3 各风险级别温度范围
Table 3. Temperature range of each risk grade
类别 风险级别 温度范围(℃) 中温带 暖温带+北亚热带 中亚热带 南亚热带 冷效应 高风险 <1.8 <-6.1 <1.5 <4.8 中风险 1.8~<9.1 -6.1~<0.1 1.5~<8.8 4.8~<9.9 低风险 9.1~<13.8 0.1~<19.3 8.8~<24.3 9.9~<25.3 舒适温度 很低 13.8~<23.4 19.3~<28.6 24.3~<27.2 25.3~<28.2 热效应 低风险 23.4~<24.8 28.6~<29.3 27.2~<29.5 28.2~<28.6 中风险 24.8~<26.1 29.3~<30.1 29.5~<31.0 28.6~<29.0 高风险 ≥26.1 ≥30.1 ≥31.0 ≥29.0
下载: 导出CSV
表 4 同一温度带不同冷、热风险级别日均死亡人数差异的方差分析
Table 4. Analysis of variance of average daily death difference among cold and heat risk grade in the same temperature zone
温度带 冷效应 热效应 F值 P值 F值 P值 中温带 7.41 0.22 1.33×1029 <0.01 暖温带+北亚热带 4.08 0.29 1.62×1030 <0.01 中亚热带 17.28 0.15 75 0.07 南亚热带 1 083 0.02 27 0.12
下载: 导出CSV
表 5 不同df值或去除PM10污染物项情况下日平均温度导致的人群健康风险RR值[RR(95% CI)]
Table 5. Mortality RR caused by daily average temperature with different df or removal of PM10 pollutants setting [RR(95% CI)]
不同参数设置 中温带 暖温带+北亚热带 中亚热带 南亚热带 冷效应 本研究参数设置 1.04(1.00~1.08) 1.03(1.00~1.07) 1.01(1.00~1.01) 1.01(1.00~1.02) 去除PM10项 1.04(1.00~1.08) 1.03(1.00~1.07) 1.01(1.00~1.01) 1.01(1.00~1.02) df=7 1.02(1.00~1.04) 1.03(1.00~1.06) 1.01(1.00~1.01) 1.08(1.00~1.17) df=8 1.02(1.00~1.05) 1.03(1.00~1.06) 1.01(1.00~1.02) 1.02(1.00~1.05) df=10 1.05(1.00~1.11) 1.04(1.00~1.09) 1.00(1.00~1.01) 1.01(1.00~1.02) df=11 1.10(1.00~1.21) 1.06(1.00~1.12) 1.00(1.00~1.01) 1.03(1.00~1.05) 热效应 本研究参数设置 1.04(1.00~1.08) 1.06(1.00~1.13) 1.00(1.00~1.01) 1.04(1.00~1.09) 去除PM10项 1.04(1.00~1.08) 1.06(1.00~1.12) 1.00(1.00~1.01) 1.05(1.00~1.10) df=7 1.02(1.00~1.04) 1.03(1.00~1.05) 1.00(1.00~1.01) 1.00(1.00~1.00) df=8 1.03(1.00~1.06) 1.05(1.00~1.10) 1.01(1.00~1.01) 1.03(1.00~1.05) df=10 1.06(1.00~1.13) 1.11(0.99~1.25) 1.00(1.00~1.01) 1.03(1.00~1.05) df=11 1.03(0.92~1.15) 1.12(1.00~1.25) 1.00(1.00~1.01) 1.06(0.98~1.15)
下载: 导出CSV
-
[1] 谢慧妍, 马文军, 张永慧, 等. 广州、长沙、昆明气温对非意外死亡的短期效应研究[J]. 中华预防医学杂志, 2014, 48(1): 38-43. DOI: 10.3760/cma.j.issn.0253-9624.2014.01.009.Xie HY, Ma WJ, Zhang YH, et al. Study on the short-term effect of temperature on non-accidental death in Guangzhou, Changsha and Kunming[J]. Chin J Prevent Med, 2014, 48(1): 38-43. DOI: 10.3760/cma.j.issn.0253-9624.2014.01.009. [2] Song X, Wang S, Hu Y, et al. Impact of ambient temperature on morbidity and mortality: an overview of reviews[J]. Sci Total Environ, 2017, 586: 241-254. DOI: 10.1016/j.scitotenv.2017.01.212. [3] Chen R, Yin P, Wang L, et al. Association between ambient temperature and mortality risk and burden: time series study in 272 main Chinese cities[J]. BMJ, 2018, 363: k4306. DOI: 10.1136/bmj.k4306. [4] Gasparrini A, Guo Y, Hashizume M, et al. Mortality risk attributable to high and low ambient temperature: a multicountry observational study[J]. Lancet, 2015, 386(9991): 369-375. DOI: 10.1016/s0140-6736(14)62114-0. [5] 曾韦霖, 李光春, 肖义泽, 等. 中国四城市温度对居民心脑血管疾病死亡影响的时间序列研究[J]. 中华流行病学杂志, 2012, 33(10): 1021-1025. DOI: 10.3760/cma.j.issn.0254-6450.2012.10.006.Zeng WL, Li GC, Xiao YZ, et al. A time series study on the effect of temperature on the death of cardiovascular and cerebrovascular diseases in four cities of China[J]. Chin J Epidemiol, 2012, 33(10): 1021-1025. DOI: 10.3760/cma.j.issn.0254-6450.2012.10.006. [6] Casanueva A, Burgstall A, Kotlarski S, et al. Overview of existing heat-health warning systems in Europe[J]. Int J Environ Res Public Health, 2019, 16(15): 2657. DOI: 10.3390/ijerph16152657. [7] Kalkstein LS, Jamason PF, Greene JS, et al. The philadelphia hot weather-health watch/warning system: development and application, summer 1995[J]. Bull Am Meteorol Soc, 1996, 77(7): 1519-1528. DOI: 10.1175/1520-0477(1996)0772.0.co;2. [8] Nicholls N, Skinner C, Loughnan M, et al. A simple heat alert system for Melbourne, Australia[J]. Int J Biometeorol, 2008, 52(5): 375-384. DOI: 10.1007/s00484-007-0132-5. [9] Lee KL, Chan YH, Lee TC, et al. The development of the Hong Kong heat index for enhancing the heat stress information service of the Hong Kong observatory[J]. Int J Biometeorol, 2016, 60(7): 1029-1039. DOI: 10.1007/s00484-015-1094-7. [10] Cheng YT, Shih-Chun CL, Hwang JS. New approach to identifying proper thresholds for a heat warning system using health risk increments[J]. Environ Res, 2019, 170: 282-292. DOI: 10.1016/j.envres.2018.12.059. [11] Chen YC, Matzarakis A. Modified physiologically equivalent temperature-basics and applications for Western European climate[J]. Theor Appl Climatol, 2018, 132(3): 1275-1289. DOI: 10.1007/s00704-017-2158-x. [12] 陈静, 韩军彩, 张素果, 等. 基于暑热指数的河北省中暑气象等级预报指标研究[J]. 气象与环境学报, 2013, 29(5): 86-91. DOI: 10.3969/j.issn.1673-503x.2013.05.014.Chen J, Han JC, Zhang SG, et al. Study on meteorological grade forecast indexes of heatstroke in Hebei Province based on summer heat index[J]. Journal of Meteorology and Environment, 2013, 29(5): 86-91. DOI: 10.3969/j.issn.1673-503x.2013.05.014. [13] 陈辉, 黄卓, 田华, 等. 高温中暑气象等级评定方法[J]. 应用气象学报, 2009, 20(4): 451-457. DOI: 10.11898/1001-7313.20090409.Chen H, Huang Z, Tian H, et al. Evaluation method of meteorological grade for high temperature heatstroke[J]. J Appl Meteor Sci, 2009, 20(4): 451-457. DOI: 10.11898/1001-7313.20090409. [14] Sheridan SC. A survey of public perception and response to heat warnings across four North American cities: an evaluation of municipal effectiveness[J]. Int J Biometeorol, 2007, 52(1): 3-15. DOI: 10.1007/s00484-006-0052-9. [15] Hutchinson X. Anusplin version 4.4 user guide[M]. Canberra: The Australian National University, 2013: 1-52. [16] Chen S, Xiao Y, Zhou M, et al. Comparison of life loss per death attributable to ambient temperature among various development regions: a nationwide study in 364 locations in China[J]. Environ Health, 2020, 19(1): 98. DOI: 10.1186/s12940-020-00653-3. [17] Liu T, Chen X, Xu Y, et al. Gut microbiota partially mediates the effects of fine particulate matter on type 2 diabetes: Evidence from a population-based epidemiological study[J]. Environ Int, 2019, 130: 104882. DOI: 10.1016/j.envint.2019.05.076. [18] Liu T, Xiao J, Zeng W, et al. A spatiotemporal land-use-regression model to assess individual level long-term exposure to ambient fine particulate matters[J]. MethodsX, 2019, 6: 2101-2105. DOI: 10.1016/j.mex.2019.09.009. [19] Breiman L. Random Forests[J]. Machine Learning, 2001, 45(1): 5-32. DOI: 10.1023/A:1010933404324. [20] 郑景云, 尹云鹤, 李炳元. 中国气候区划新方案[J]. 地理学报, 2010, 65(1): 3-12. DOI: 10.11821/xb201001002.Zheng JY, Yin YH, Li BY. A new plan for climate regionalization in China[J]. Acta Geographcica Sinica, 2010, 65(1): 3-12. DOI: 10.11821/xb201001002. [21] Guo Y, Gasparrini A, Armstrong B, et al. Global variation in the effects of ambient temperature on mortality: a systematic evaluation[J]. Epidemiology, 2014, 25(6): 781-9. DOI: 10.1097/ede.0000000000000165. [22] Gasparrini A, Armstrong B. Reducing and meta-analysing estimates from distributed lag non-linear models[J]. BMC Med Res Methodol. 2013(13): 1. DOI: 10.1186/1471-2288-13-1. [23] Guo Y, Barnett AG, Pan X, et al. The impact of temperature on mortality in Tianjin, China: a case-crossover design with a distributed lag nonlinear model[J]. Environ Health Perspect, 2011, 119(12): 1719-1725. DOI: 10.1289/ehp.1103598. [24] 黄照, 刘涛, 许燕君, 等. 基于死亡数据用DLNM构建气象健康指数[J]. 环境卫生学杂志, 2018, 8(5): 368-373, 380. DOI: 10.13421/j.cnki.hjwsxzz.2018.05.002.Huang Z, Liu T, Xu YJ, et al. Using DLNM to construct meteorological health index based on mortality data[J]. Journal of Environmental Hygiene, 2018, 8(5): 368-373, 380. DOI: 10.13421/j.cnki.hjwsxzz.2018.05.002. [25] Gasparrini A. Distributed lag linear and non-linear models in R: the package dlnm[J]. J Stat Softw, 2011, 43(8): 1-20. DOI: 10.18637/jss.v043.i08. [26] Ma W, Chen R, Kan H. Temperature-related mortality in 17 large Chinese cities: how heat and cold affect mortality in China[J]. Environ Res, 2014, 134: 127-33. DOI: 10.1016/j.envres.2014.07.007. [27] Aström DO, Tornevi A, Ebi KL, et al. Evolution of minimum mortality temperature in Stockholm, Sweden, 1901-2009[J]. Environ Health Perspect, 2016, 124(6): 740-744. DOI: 10.1289/ehp.1509692. [28] Todd N, Valleron AJ. Space-time covariation of mortality with temperature: a systematic study of deaths in France, 1968-2009[J]. Environ Health Perspect, 2015, 123(7): 659-664. DOI: 10.1289/ehp.1307771. [29] Luo Q, Li S, Guo Y, et al. A systematic review and meta-analysis of the association between daily mean temperature and mortality in China[J]. Environ Res, 2019, 173: 281-299. DOI: 10.1016/j.envres.2019.03.044. [30] Yin Q, Wang J, Ren Z, et al. Mapping the increased minimum mortality temperatures in the context of global climate change[J]. Nat Commun, 2019, 10(1): 4640. DOI: 10.1038/s41467-019-12663-y. [31] Krummenauer L, Prahl BF, Costa L, et al. Global drivers of minimum mortality temperatures in cities[J]. Sci Total Environ, 2019, 695: 133560. DOI: 10.1016/j.scitotenv.2019.07.366. -


 点击查看大图
计量
- 文章访问数: 680
- HTML全文浏览量: 305
- PDF下载量: 82
- 被引次数: 0