

Study on the association of residence tap water access and chronic diseases in middle-aged and elderly people
-
摘要:
目的 水是人类赖以生存的重要因素。提高饮水安全建设,确保安全与卫生用水是人类健康的基础性工程。 方法 本研究选取2018年中国健康与养老追踪调查(China Health and Retirement Longitudinal Study, CHARLS)数据中12 211名≥45岁中老年人作为研究对象,采用描述统计分析不同特征人群慢性病患病情况,并运用Logistic回归和最小二乘线性(OLS)回归模型以及倾向值匹配的方法,分析住所自来水使用与是否患慢性病及慢性病患病数量的关系。 结果 目前中国中老年人住所自来水普及率达到81.60%,中老年人慢性病现患率68.63%,患病种类数为(1.112±1.118)种。在控制混杂因素后,与住所没有自来水的中老年人相比,有自来水的中老年人患慢性病的可能性更小(OR=0.836, 95% CI: 0.751~0.930),患慢性病的数量也更少(β=-0.080, 95% CI: -0.132~-0.028)。从城乡差异来看,城市有自来水的中老年人患慢性病的数量相对较少(β=-0.097, 95% CI: -0.151~-0.043)。经倾向值匹配后结果保持稳健。 结论 应当持续推进中国改水工程,加大对居民安全饮水的宣传力度,此外也要综合中老年人实际情况有针对性地开展慢性病预防工作。 Abstract:Objective Water is of utmost importance for human survival. Improving drinking water safety construction to ensure water safety and sanitation is a basic project for population health. Methods In this study, 12 211 middle-aged and elderly people aged 45 and over were selected from the 2018 China Health and Retirement Longitudinal Study (CHARLS). Descriptive statistics were used to analyze the prevalence of chronic diseases in different populations. Logistic regression model and linear regression and propensity score matching methods were used to analyze the relationship between tap water and chronic diseases, as well as the number of chronic diseases. Results The proportion of middle-aged and elderly people in China who have tap water was 81.60%. The prevalence rate of chronic diseases in middle-aged and elderly people was 68.63%, and the average number of disease types was (1.112±1.118). After controlling confounding factors, middle-aged and elderly people who have tap water in their residence were less likely to suffer from chronic diseases (OR=0.836, 95% CI: 0.751-0.930), as well as have fewer chronic diseases than those without tap water (β=-0.080, 95% CI: -0.132--0.028). From the perspective of urban-rural differences, the number of chronic diseases among middle-aged and elderly people with tap water in the urban was more less (β=-0.097, 95% CI: -0.151--0.043). Those results above remain robust after matching the propensity value. Conclusions China's water improvement project should be continuously promoted, and the publicity of residents on drinking water safety should be strengthened. Besides, it is necessary to carry out chronic disease prevention based on the actual situation of the middle-aged and elderly. -
Key words:
- Tap water /
- Chronic diseases /
- Middle-aged and elderly people
-

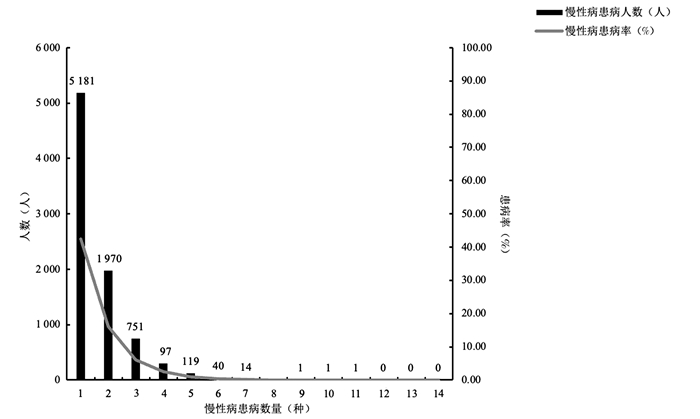
图 1 中老年人患慢性病数量频数分布
Figure 1. The frequency distribution of the number of chronic diseases among middle-aged and elderly people
表 1 样本基本情况
Table 1. Basic situation of the sample
变量 赋值 频数[n (%)] 变量 赋值 频数[n (%)] 慢性病 宗教信仰 无 0 3 830(31.37) 无 1 10 990(90.00) 有 1 8 381(68.63) 婚姻状态 住所自来水情况 无配偶 0 1 787(14.63) 无 0 2 247(18.40) 有配偶 1 10 424(85.37) 有 1 9 964(81.60) 受教育情况 性别 小学及以下 0 7 866(64.42) 女 0 6 341(51.93) 中学及以上 1 4 345(35.58) 男 1 5 870(48.07) 城乡 年龄(岁) 乡村 0 8 964(73.41) 45~<55 1 3 694(30.25) 城市 1 3 247(26.59) 55~<65 2 3 956(32.40) 居家 65~<75 3 3 130(25.63) 否 0 412(3.37) 75~<85 4 1 191(9.75) 是 1 11 799(96.63) ≥85 5 240(1.97) 医疗保险 民族 无 0 338(2.77) 少数民族 0 952(7.80) 有 1 11 873(97.23) 汉族 1 11 259(92.20) 养老保险 宗教信仰 无 0 1 359(11.13) 有 0 1 221(10.00) 有 1 10 852(88.87)  下载: 导出CSV
表 2 不同特征人群慢性病患病情况[n (%)]
Table 2. The prevalence of chronic diseases in different populations [n (%)]
特征 慢性病患病情况 样本量(N) 患病人数(n) 患病率(%) χ2值 P值 自来水 12.691 <0.001 有 9 964 6 768 67.92 无 2 247 1 613 71.78 性别 12.582 <0.001 女 6 341 4 443 70.07 男 5 870 3 938 67.09 年龄(岁) 682.784 <0.001 45~<55 3 694 1 990 53.87 55~<65 3 956 2 714 68.60 65~<75 3 130 2 493 79.65 75~<85 1 191 988 82.96 ≥85 240 196 81.67 民族 6.706 0.010 少数民族 952 689 72.37 汉族 11 259 7 692 68.32 宗教信仰 23.128 <0.001 有 1 221 912 74.69 无 10 990 7 469 67.96 婚姻状态 65.350 <0.001 无配偶 1 787 1 373 76.83 有配偶 10 424 7 008 67.23 受教育情况 66.508 <0.001 小学及以下 7 866 5 599 71.18 中学及以上 4 345 2 782 64.03 城乡 2.878 0.090 乡村 8 964 6 114 68.21 城市 3 247 2 267 69.82 居家 14.934 <0.001 否 412 247 59.95 是 11 799 8 134 68.94 医疗保险 5.646 0.017 无 338 212 62.72 有 11 873 8 169 68.80 养老保险 8.405 0.004 无 1 359 886 65.19 有 10 852 7 495 69.07
下载: 导出CSV
表 3 自来水使用与有无慢性病的多因素Logistic回归分析模型分析
Table 3. Multivariate Logistic regression analysis of tap water use and the presence or absence of chronic diseases
变量 OR(95% CI)值 P值 住所自来水情况 无 1.000 有 0.836(0.751~0.930) 0.001 性别 女 1.000 男 0.866(0.798~0.940) 0.001 年龄(岁) 45~<55 1.000 55~<65 1.865(1.697~2.049) <0.001 65~<75 3.241(2.896~3.627) <0.001 75~<85 3.985(3.355~4.732) <0.001 ≥85 3.643(2.582~5.140) <0.001 民族 少数民族 1.000 汉族 0.786(0.674~0.916) 0.002 宗教信仰 有 1.000 无 0.805(0.699~0.927) 0.003 婚姻状态 无配偶 1.000 有配偶 0.953(0.8438~1.084) 0.461 受教育情况 小学及以下 1.000 中学及以上 0.881(0.805~0.965) 0.006 城乡 乡村 城市 1.189(1.079~1.309) <0.001 居家 否 1.000 是 1.183(0.961~1.457) 0.113 医疗保险 无 1.000 有 1.310(1.031~1.664) 0.027 养老保险 无 1.000 有 1.158(1.020~1.315) 0.023 常数项 1.342(0.920~1.959) 0.127
下载: 导出CSV
表 4 自来水使用与慢性病种类数的线性回归分析
Table 4. Linear regression analysis of tap water use and the number of chronic diseases
变量 β(95% CI)值 P值 住所自来水情况 无 1.000 有 -0.094(-0.146~ -0.042) <0.001 性别 女 1.000 男 -0.036(-0.076~0.005) 0.084 年龄(岁) 45~<55 1.000 55~<65 0.260(0.213~0.308) <0.001 65~<75 0.484(0.430~0.538) <0.001 75~<85 0.517(0.440~0.593) <0.001 ≥85 0.419(0.275~0.564) <0.001 民族 少数民族 1.000 汉族 -0.144(-0.225~ -0.063) <0.001 宗教信仰 有 1.000 无 -0.159(-0.232~ -0.085) <0.001 婚姻状态 无配偶 1.000 有配偶 -0.080(-0.143~ -0.016) 0.014 受教育情况 小学及以下 1.000 中学及以上 -0.070(-0.114~ -0.250) 0.002 城乡 乡村 1.000 城市 0.164(0.115~0.213) <0.001 居家 否 1.000 是 0.095(-0.008~0.198) 0.072 医疗保险 无 1.000 有 0.119(-0.006~0.244) 0.061 养老保险 无 1.000 有 0.008(-0.057~0.074) 0.799 常数项 1.048(0.846~1.251) <0.001
下载: 导出CSV
表 5 自来水使用与有无慢性病的关系
Table 5. The relationship between the use of tap water and the presence or absence of chronic diseases
变量 单因素分析 多因素分析 OR(95% CI)值 P值 OR(95% CI)值 P值 住所有自来水(参照组:无) 城市 0.649(0.454~0.925) 0.017 0.636(0.437~0.926) 0.018 农村 0.830(0.745~0.925) 0.001 0.856(0.765~0.956) 0.006
下载: 导出CSV
表 6 自来水使用与慢性病种类数的关系
Table 6. The relationship between tap water use and the number of chronic diseases
变量 单因素分析 多因素分析 β(95% CI)值 P值 β(95% CI)值 P值 住所有自来水(参照组:无) 城市 -0.115(-0.296~0.067) 0.215 -0.111(-0.293~0.070) 0.229 农村 -0.110(-0.165~-0.055) <0.001 -0.097(-0.151~-0.043) <0.001
下载: 导出CSV
表 7 倾向值匹配结果
Table 7. Propensity value matching results
慢性病种类数 住所有自来水 住所无自来水 ATT $ {s_{\overline x }}$ t值 近邻匹配 1.097 1.188 -0.092 0.043 -2.140 半径匹配 1.097 1.191 -0.095 0.036 -2.620 核匹配 1.097 1.211 -0.115 0.033 -3.460
下载: 导出CSV
-
[1] 时元智, 张学明, 施海祥, 等. 云南农村饮水安全工程现状分析与思考[J]. 中国农村水利水电, 2018(2): 186-189, 193. doi: 10.3969/j.issn.1007-2284.2018.02.039Shi YZ, Zhang XM, Shi HX, et al. Reflections on the current rural drinking water safety projects in Yunnan Province[J]. China Rural Water Hydropower, 2018(2): 186-189, 193. doi: 10.3969/j.issn.1007-2284.2018.02.039 [2] 张熙遥, 张灿, 史云, 等. 我国北方地区四省份自备井水质卫生学调查风险评价[J]. 中华疾病控制杂志, 2019, 23(3): 345-350. DOI: 10.16462/j.cnki.zhjbkz.2019.03.021.Zhang XY, Zhang C, Shi Y, et al. Investigation and risk assessment for water quality hygiene in self-supply well water in four northern provinces of China[J]. Chin J Dis Control Prev, 2019, 23(3): 345-350. DOI: 10.16462/j.cnki.zhjbkz.2019.03.021. [3] Albay M, Ozbayram EG, Camur D, et al. Recent trends in water and health studies on the focus of global changes[J]. Environ Manag, 2021, 67(3): 437-438. DOI: 10.1007/s00267-021-01445-2. [4] Ji YJ, Wu JH, Wang YH, et al. Seasonal variation of drinking water quality and human health risk assessment in Hancheng City of Guanzhong plain, China[J]. Expo Heal, 2020, 12(3): 469-485. DOI: 10.1007/s12403-020-00357-6. [5] Valipour M. Global experience on irrigation management under different scenarios[J]. J Water Land Dev, 2017, 32(1): 95-102. DOI: 10.1515/jwld-2017-0011. [6] 刘乐艺. 乡村振兴实现良好开局[N]. 人民日报海外版, 2021-01-14(2).Liu LY. Rural revitalization achieves a good start[N]. People's Daily Overseas Edition, 2021-1-14(02). [7] Zhao Y, Hu Y, Smith JP, et al. Cohort profile: the China health and retirement longitudinal study (CHARLS)[J]. Int J Epidemiol, 2014, 43(1): 61-68. DOI: 10.1093/ije/dys203. [8] 雷继元, 王化凯. 老年人健康状况的差异性研究——基于襄阳市第六次人口普查数据的分析[J]. 湖北文理学院学报, 2013, 34(6): 84-88. https://www.cnki.com.cn/Article/CJFDTOTAL-XFXY201306018.htmLei JY, Wang HK. A Study on the Differences in the Health Status of the Elderly——Based on the Analysis of the Data from the Sixth Census of Xiangyang City[J]. J Hubei Univ Arts Sci, 2013, 34(6): 84-88. https://www.cnki.com.cn/Article/CJFDTOTAL-XFXY201306018.htm [9] 杨秀木, 齐玉龙, 袁长江, 等. 社区60岁以上人群慢性病患病情况及与健康相关行为的关系[J]. 蚌埠医学院学报, 2015, 40(3): 296-304. DOI: 10.13898/j.cnki.issn.1000-2200.2015.03.004.Yang XM, Qi YL, Yuan CJ, et al. The relationship between the chronic disease and health related behavior more than 60 years of age people[J]. J Bengbu Med Coll, 2015, 40(3): 296-304. DOI: 10.13898/j.cnki.issn.1000-2200.2015.03.004. [10] Susser M, Susser E. Choosing a future for epidemiology: Ⅱ. From black box to Chinese boxes and eco-epidemiology[J]. Am J Public Health, 1996, 86(5): 674-677. DOI: 10.2105/ajph.86.5.674. [11] 范涛, 曹乾, 蒋露露, 等. 老年人慢性病影响因素的健康生态学模型解释[J]. 中国全科医学, 2012, 15(1): 33-36, 40. DOI: 10.3969/j.issn.1007-9572.2012.01.011.Fan T, Cao Q, Jiang LL, et al. Explaining the influencing factors on chronic diseases of the elderly using health ecological model[J]. Chin Gen Pract, 2012, 15(1): 33-36, 40. DOI: 10.3969/j.issn.1007-9572.2012.01.011. [12] Quinete N, Hauser-Davis RA. Drinking water pollutants may affect the immune system: concerns regarding COVID-19 health effects[J]. Environ Sci Pollut Res Int, 2021, 28(1): 1235-1246. DOI: 10.1007/s11356-020-11487-4. [13] Phung D, Connell D, Rutherford S, et al. Cardiovascular risk from water arsenic exposure in Vietnam: Application of systematic review and meta-regression analysis in chemical health risk assessment[J]. Chemosphere, 2017, 177(6): 167-175. DOI: 10.1016/j.chemosphere.2017.03.012. [14] Shakoor MB, Nawaz R, Hussain F, et al. Human health implications, risk assessment and remediation of As-contaminated water: a critical review[J]. Sci Total Environ, 2017, 601-602: 756-769. DOI: 10.1016/j.scitotenv.2017.05.223. [15] 曹祥玉, 徐幽琼, 廖冬冬. 2017―2019年福州市饮水型地方性氟中毒监测结果[J]. 中华疾病控制杂志, 2021, 25(9): 1097-1101. DOI: 10.16462/j.cnki.zhjbkz.2021.09.018.Cao XY, Xu YQ, Liao DD. Monitoring results of drinking water-borne endemic fluorosis in Fuzhou from 2017 to 2019[J]. Chin J Dis Control Prev, 2021, 25(9): 1097-1101. DOI: 10.16462/j.cnki.zhjbkz.2021.09.018. [16] Kullar SS, Shao K, Surette C, et al. A benchmark concentration analysis for manganese in drinking water and IQ deficits in children[J]. Environ Int, 2019, 130: 104889. DOI: 10.1016/j.envint.2019.05.083. [17] Shil S, Singh UK. Health risk assessment and spatial variations of dissolved heavy metals and metalloids in a tropical river basin system[J]. Ecol Indic, 2019, 106: 105455. DOI: 10.1016/j.ecolind.2019.105455. [18] Izah SC, Chakrabarty N, Srivastav AL. A review on heavy metal concentration in potable water sources in Nigeria: human health effects and mitigating measures[J]. Expo Heal, 2016, 8(2): 285-304. DOI: 10.1007/s12403-016-0195-9. [19] 徐延辉, 刘彦. 居住环境、社会地位与老年人健康研究[J]. 厦门大学学报(哲学社会科学版), 2020, (1): 52-59. DOI: 10.3969/j.issn.0438-0460.2020.01.006.Xu YH, Liu Y. Living environment, social status and health of the elderly[J]. J Xiamen Univ Arts Soc Sci, 2020, (1): 52-59. DOI: 10.3969/j.issn.0438-0460.2020.01.006. [20] 张卫东. 社区老年人的生活质量与心理健康: SEM研究[J]. 心理科学, 2002, 25(3): 307-309, 382. DOI: 10.16719/j.cnki.1671-6981.2002.03.014.Zhang WD. The quality of life and psychological well- being of the community elderly: a sem study[J]. Psychol Sci, 2002, 25(3): 307-309, 382. DOI: 10.16719/j.cnki.1671-6981.2002.03.014. [21] Pickering AJ, Davis J. Freshwater availability and water fetching distance affect child health in sub-Saharan Africa[J]. Environ Sci Technol, 2012, 46(4): 2391-2397. DOI: 10.1021/es203177v. -

 点击查看大图
计量
- 文章访问数: 514
- HTML全文浏览量: 149
- PDF下载量: 44
- 被引次数: 0