

Comparison of the effects of decision tree model and Logistic regression analysis model on identifying risk factors of hypertension
-
摘要:
目的 利用决策树模型和Logistic回归分析模型分析清丰县居民高血压的危险因素,比较两种分析方法的不同。 方法 采取多阶段分层整群抽样的方法,在清丰县15~74岁人群中抽取4 087名常住居民进行调查。建立决策树与Logistic回归分析模型。 结果 决策树和Logistic回归分析模型均显示高年龄、中心性肥胖、初中以下文化、农村、糖尿病、吸烟、饮酒和有高血压家族史为高血压危险因素。超重/肥胖变量被纳入决策树模型,在Logistic回归分析模型中被剔除,共线性诊断提示中心性肥胖和超重/肥胖两变量有较强的共线性。曲线下面积(Area Under the Curve, AUC)和综合判别改善指数(Integrated Discrimination Improvement, IDI)均提示决策树模型预测高血压效果的能力稍高于Logistic回归分析模型。 结论 决策树模型预测能力稍高于Logistic回归分析模型,在高血压危险因素的分析中可行、直观,同时不受变量间共线性的影响;Logistic回归分析模型可以充分展现自变量与因变量的数量依存关系,与决策树模型互为补充,可结合两者来描述高血压的危险因素。 -
关键词:
- 高血压 /
- Logistic回归分析模型 /
- 决策树模型 /
- 危险因素
Abstract:Objective To analyze the risk factors of hypertension in Qingfeng County, and to compare the differences between the two analysis methods. Methods A multi-stage stratified cluster sampling method was adopted to seket samples from 4 087 permanent residents from 15-74 years old in Qingfeng County. After the survey, decision tree and Logistic regression analysis model were established. Results Both the decision tree model and the Logistic regression analysis model showed that elder age, central obesity, educational level below junior middle school, rural areas, diabetes, smoking, drinking, and family history of hypertension were risk factors of hypertension. The overweight/obesity variable was included in the decision tree model and eliminated from the Logistic regression analysis model. The collinearity diagnosis indicated that the central obesity and overweight/obesity variables had strong collinearity. Area Under the Curve (AUC) and Integrated Discrimination Improvement (IDI) all indicated that in terms of the ability to predict the hypertension, the decision tree model was slightly higher than that of the Logistic regression analysis model. Conclusion The predictive ability of the decision tree model is slightly higher than that of the Logistic regression analysis model. The decision tree model is feasible and intuitive in the analysis of risk factors of hypertension. Besides, it is not affected by the collinearity between variables. The Logistic regression analysis model can fully demonstrate the quantitative interdependency between the independent variable and the dependent variables. It is supplementary to the decision tree model and it can be combined with the decision tree model to describe the risk factors of hypertension. -
Key words:
- Hypertension /
- Logistic regression analysis model /
- Decision tree model /
- Risk factors
-

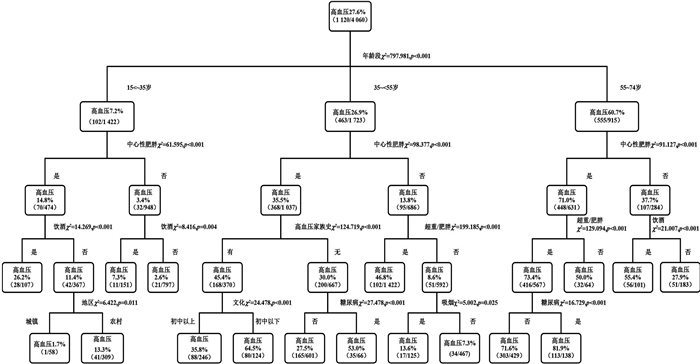
图 1 2019年清丰县高血压影响因素的决策树树形图
Figure 1. Decision tree tree diagram of the factors influencing hypertension in Qingfeng County in 2019

图 2 2019年清丰县高血压Logistic回归分析模型分析与决策树分析模型的ROC曲线图
Figure 2. ROC curve graph of hypertension Logistic regression analysis model analysis and decision tree analysis in Qingfeng County in 2019
表 1 多因素变量赋值
Table 1. Multifactor variable assignment
变量 赋值 性别 1=男性,2=女性 年龄(岁) 1=15~<35,2=35~<55,3=55~74 婚姻 1=未婚,2=已婚,3=离异/丧偶 地区 1=城镇,2=农村 文化程度 1=初中以下,2=初中及以上 超重/肥胖 1=是,2=否 中心性肥胖 1=是,2=否 吸烟 1=是,2=否 饮酒 1=是,2=否 蔬菜摄入 1=每天吃或每周吃,2=每月吃或很少吃 水果摄入 1=每天吃或每周吃,2=每月吃或很少吃 高血压 1=是,2=否 糖尿病 1=是,2=否 高血压家族史 1=是,2=否 糖尿病家族史 1=是,2=否  下载: 导出CSV
表 2 2019年清丰县居民高血压患病影响因素多因素非条件Logistic回归分析模型分析
Table 2. Multivariate unconditional Logistic regression analysis model analysis of influencing factors of hypertension among residents in Qingfeng County in 2019
变量 β值 sx Wald值 P值 OR(95%CI)值 年龄(岁) 1.157 0.068 291.055 < 0.001 3.179(2.784~3.631) 初中以下文化 0.499 0.097 26.336 < 0.001 1.648(1.162~1.787) 高血压家族史 0.630 0.089 50.205 < 0.001 1.878(1.577~2.235) 地区(农村) 0.365 0.110 11.049 0.001 1.441(1.162~1.787) 中心性肥胖 1.199 0.093 165.126 < 0.001 3.318(2.763~3.983) 糖尿病 0.888 0.138 41.528 < 0.001 2.430(1.855~3.183) 水果(每月吃或很少吃) 0.350 0.107 10.792 0.001 1.420(1.152~1.750) 吸烟 0.436 0.137 10.121 0.001 1.547(1.182~2.024) 饮酒 0.673 0.131 26.448 < 0.001 1.960(1.517~2.533) 性别(男) 0.325 0.123 6.939 0.008 1.383(1.087~1.761)
下载: 导出CSV
表 3 Logistic回归分析模型和决策树模型的分类效果比较
Table 3. Comparison of classification results of Logistic regression analysis model and decision tree model
模型 AUC sx 95% CI值 P值 Logistic回归分析模型 0.835 0.007 0.822~0.848 < 0.001 决策树模型 0.848 0.007 0.835~0.861 < 0.001
下载: 导出CSV
-
[1] 陶然. Logistic模型多重共线性问题的诊断及改进[J]. 统计与决策, 2008, (15): 22-25. DOI: 10.13546/j.cnki.tjyjc.2008.15.002.Tao R. Diagnosis and improvement of multi-collinearity in Logistic model[J]. Statistics & Decision, 2008, (15): 22-25. DOI: 10.13546/j.cnki.tjyjc.2008.15.002. [2] 王文, 张维忠, 孙宁玲, 等. 中国血压测量指南[J]. 中华高血压杂志, 2011, 19(12): 1101-1115, 1100. DOI: 10.16439/j.cnki.1673-7245.2011.12.004.Wang W, Zhang WZ, Sun NL, et al. Chinese guidelines for blood pressure measurement[J]. Chin J Hypertension, 2011, 19(12): 1101-1115, 1100. DOI: 10.16439/j.cnki.1673-7245.2011.12.004. [3] 中华医学会糖尿病学分会. 中国2型糖尿病防治指南(2017年版)[J]. 中华糖尿病杂志, 2018, 10(1): 4-67. DOI: 10.19538/j.nk2018040108.Chinese Diabetes Society. Guidelines for the prevention and control of type 2 diabetes in China (2017 Edition)[J]. Chin J Diabetes, 2018, 10(1): 4-67. DOI: 10.19538/j.nk2018040108. [4] 中国高血压防治指南修订委员会, 高血压联盟(中国) 中华医学会心血管病学分会, 中国医师协会高血压专业委员会, 等. 中国高血压防治指南(2018年修订版)[J]. 中国心血管杂志, 2019, 24(1): 24-56. DOI: 10.3969/j.issn.1007-5410.2019.01.0022018.Writing Group of Chinese Guidelines for the Management of Hypertension, Chinese Hypertension League, Chinese Society of Cardiology, Chinese Medical Doctor Association Hypertension Committee, et al. 2018 Chinese guidelines for the management of hypertension[J]. Chin J Cardiovasc Med, 2019, 24(1): 24-56. DOI: 10.3969/j.issn.1007-5410.2019.01.0022018. [5] 中国肥胖问题工作组. 中国成人超重和肥胖症预防与控制指南(节录)[J]. 营养学报, 2004, 26(1): 1-4. DOI: 10.3321/j.issn:0512-7955.2004.01.001.China Working Group on Obesity. Guidelines for the prevention and control of overweight and obesity in Chinese adults (Excerpt)[J]. Acta Nutrimenta Sinica, 2004, 26(1): 1-4. DOI: 10.3321/j.issn:0512-7955.2004.01.001. [6] 吴小艳, 李强, 严惠, 等. 陕西省汉中市农村居民高血压与家族史的相关性分析[J]. 中华高血压杂志, 2018, 26(6): 600. DOI: 10.16439/j.cnki.1673-7245.2018.06.038.Wu XY, Li Q, Yan H, et al. Correlation analysis between hypertension and family history of rural residents in Hanzhong City, Shaanxi Province[J]. Chin J Hypertension, 2018, 26(6): 600. DOI: 10.16439/j.cnki.1673-7245.2018.06.038. [7] Xu F, Wang Y, Ware RS, et al. Physical activity, family history of diabetes and risk of developing hyperglycaemia and diabetes among adults in Mainland China[J]. Diabetic Medicine, 2012, 29(5): 593-599. DOI: 10.1111/j.1464-5491.2011.03495.x. [8] 李泓澜, 徐飚, 郑苇, 等. 中老年男性肥胖流行特征及其与慢性病的关系[J]. 中华流行病学杂志, 2010, 31(4): 370-374. DOI: 10.3760/cma.j.issn.0254-6450.2010.04.003.Li HL, Xu B, Zheng W, et al. Epidemiological characteristics of obesity in middle-aged and elderly men and its relationship with chronic diseases[J]. Chin J Epidemiol, 2010, 31(4): 370-374. DOI: 10.3760/cma.j.issn.0254-6450.2010.04.003. [9] 陈宇星, 张庆军, 袁兆康, 等. 建始县居民高血压和糖尿病患病现状及其影响因素[J]. 中国慢性病预防与控制, 2016, 24(4): 273-275. DOI: 10.16386/j.cjpccd.issn.1004-6194.2016.04.010.Chen YX, Zhang QJ, Yuan ZK, et al. The prevalence and influencing factors of hypertension and diabetes among residents in Jianshi County[J]. Chin J Prev Contr Chron Dis, 2016, 24(4): 273-275. DOI: 10.16386/j.cjpccd.issn.1004-6194.2016.04.010. [10] Wang Z, Chen Z, Zhang L, et al. Status of hypertension in China: results from the China hypertension survey, 2012-2015[J]. Circulation, 2018, 137(22): 2344-2356. DOI: 10.1161/CIRCULATIONAHA.117.032380. [11] 姚爽, 谢梦婷, 邹迪莎, 等. 空腹血糖受损危险因素的Logistic回归及分类树分析[J]. 安徽医科大学学报, 2018, 53(9): 1407-1411. DOI: 10.19405/j.cnki.issn1000-1492.2018.09.018.Yao S, Xie MT, Zou DS, et al. Logistic regression and classification tree analysis of risk factors for impaired fasting blood glucose[J]. Acta Universitatis Medicinalis Anhui, 2018, 53(9): 1407-1411. DOI: 10.19405/j.cnki.issn1000-1492.2018.09.018. [12] 帅健, 李丽萍, 陈业群. 决策树模型与Logistic回归模型在伤害发生影响因素分析中的作用[J]. 中华疾病控制杂志, 2015, 19(2): 185-189. DOI: 10.16462/j.cnki.zhjbkz.2015.02.021.Shuai J, Li LP, Chen YQ. The role of decision tree model and Logistic regression in injury influencing factors analysis[J]. Chin J Dis Control Prev, 2015, 19(2): 185-189. DOI: 10.16462/j.cnki.zhjbkz.2015.02.021. [13] 刘兵, 李苹, 朱玫烨, 等. 决策树模型与Logistic回归模型在胃癌高危人群干预效果影响因素分析中的应用[J]. 中国卫生统计, 2018, 35(1): 70-73. https://www.cnki.com.cn/Article/CJFDTOTAL-ZGWT201801019.htmLiu B, Li P, Zhu MY, et al. Application of decision tree model and Logistic regression model in analysis of influencing factors of intervention effect in high-risk groups of gastric cancer[J]. Chin J Health Statistics, 2018, 35(1): 70-73. https://www.cnki.com.cn/Article/CJFDTOTAL-ZGWT201801019.htm [14] 任海燕, 梁雨, 左彭湘. 基于Logistic回归与决策树模型的母乳喂养影响因素分析[J]. 中国卫生统计, 2019, 36(4): 532-534 https://www.cnki.com.cn/Article/CJFDTOTAL-ZGWT201904014.htmRen HY, Liang Y, Zuo PX. Analysis of factors affecting breastfeeding based on Logistic regression and decision tree model[J]. Chin J Health Statistics, 2019, 36(4): 532-534. https://www.cnki.com.cn/Article/CJFDTOTAL-ZGWT201904014.htm [15] Amini P, Ahmadinia H, Poorolajal J, et al. Evaluating the high risk groups for suicide: a comparison of Logistic regression, support vector machine, decision tree and artificial neural network[J]. Iran J Public Health, 2016, 45(9): 1179-1187. -


 点击查看大图
计量
- 文章访问数: 587
- HTML全文浏览量: 444
- PDF下载量: 116
- 被引次数: 0