

Analysis of the reported incidence of pulmonary tuberculosis in the elderly aged 65 and over in China, 2011-2020
-
摘要:
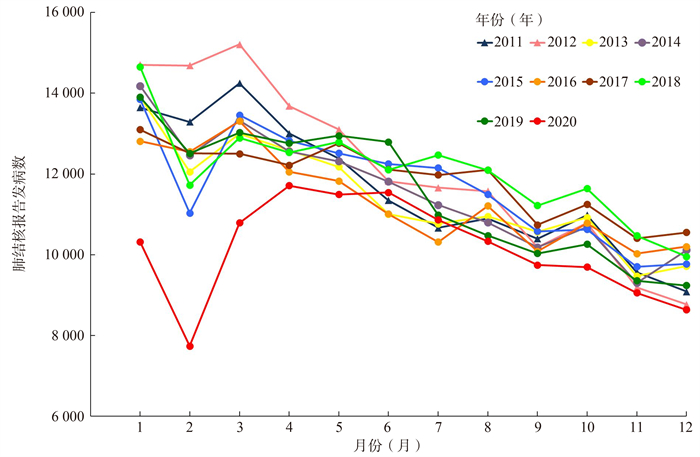
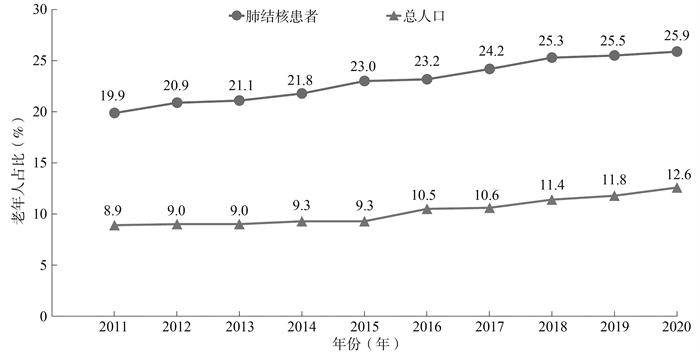
目的 分析2011―2020年全国≥65岁老年人(简称老年人)肺结核报告发病特征。 方法 利用中国2011―2020年肺结核发病监测数据,分析老年人肺结核报告发病率及分布特征,计算年均变化趋势。 结果 全国老年人肺结核报告发病率从2011年的158.7/10万下降至2020年的98.3/10万。老年人肺结核的发病风险是<65岁人群的2.4~2.9倍,其中以70~<75岁和75~<80岁年龄组的发病率最高。老年人中,男性的发病风险是女性的2.5~3.1倍,1月和3月的报告发病数最高,其中2020年1月―2020年4月的报告发病数较既往同期出现了大幅下降。中国东、中、西部老年人肺结核报告发病率分别为95.9/10万、159.0/10万和184.4/10万,中、西部地区分别是东部地区的1.7倍和1.9倍。2011―2019年,老年人肺结核报告发病率的年均递降率为3.5%,东、中、西部分别为4.9%、4.5%和1.5%,推算获得的2020年报告发病率高于实际的报告发病率。 结论 2011―2020年,中国老年人肺结核防治工作取得了显著成效,但总体负担依然很重,应重点关注西部的重点地区,并强化老年肺结核患者的发现等工作。 Abstract:Objective To analyze the characteristics of pulmonary tuberculosis (PTB) among the elderly aged 65 and over nationwide from 2011 to 2020. Methods Using nationwide surveillance data of PTB from 2011 to 2020, to analyze the reported incidence of PTB in the elderly.The distribution characteristic and the average annual change trends were calculated. Results The reported incidence of PTB in the elderly decreased from 158.7/100 000 in 2011 to 98.3/100 000 in 2020. The risk of developing PTB in the elderly aged 65 and over was 2.4-2.9 times that of those under the age of 65, and the 70- < 75 and 75- < 80 age groups had the highest incidences. Among the elderly, the risk of developing PTB in men was 2.5-3.1 times than that of women. The numbers of reported cases were the highest in January and March, which belong to winter and spring. From January to April 2020, the number of reported cases decreased significantly compared with that of the same period in previous years. The reported incidences of PTB among the elderly in eastern, central, and western China were 95.9/100 000, 159.0/100 000 and 184.4/100 000, respectively, and the incidences in central and western China were 1.7 and 1.9 times higher than that of eastern China, respectively. From 2011 to 2019, the average annual decline rate of the reported incidence of PTB in the elderly aged 65 and over was 3.5%, and the rates in eastern, central and western China were 4.9%, 4.5% and 1.5%, respectively. The estimated reported incidences were higher than the actual reported incidences in 2020. Conclusions From 2011 to 2020, China has remarkable achievements in the prevention and control of PTB in the elderly, but the overall burden is still heavy. We should focus on key provinces in western China, and strengthen the detection of PTB among the elderly. -
Key words:
- Pulmonary tuberculosis /
- Incidence /
- The elderly
-

图 1 2011―2020年全国老年人和老年肺结核患者占比
Figure 1. The proportions of the people and pulmonary tuberculosis cases aged 65 and over in China, 2011-2020

图 2 2011―2020年全国老年人肺结核报告发病数月度分布情况
Figure 2. The reported incidences of pulmonary tuberculosis monthly among the elderly in China, 2011-2020
表 1 2011―2020年全国不同年龄组别肺结核发病情况及差异分析
Table 1. The reported incidences of pulmonary tuberculosis in different age groups and differential analysis from 2011-2020
年份(年) 全年龄组 < 65岁 ≥65岁 χ2值 P值 RR(95% CI)值 人口数(万) 报告发病数a 人口数(万) 报告发病数a 人口数(万) 报告发病数a 2011 134 091 953 275(71.1) 122 160 763 893(62.5) 11 931 189 382(158.7) 141 413 < 0.001 2.537(2.524~2.550) 2012 134 735 951 508(70.6) 122 621 752 169(61.3) 12 114 199 339(164.5) 166 174 < 0.001 2.681(2.668~2.694) 2013 135 404 904 434(66.8) 123 229 713 939(57.9) 12 175 190 495(156.5) 160 933 < 0.001 2.699(2.685~2.713) 2014 135 517 889 381(65.6) 122 916 695 389(56.6) 12 601 193 992(153.9) 165 007 <0.001 2.719(2.706~2.733) 2015 136 247 864 015(63.4) 123 552 665 684(53.9) 12 695 198 331(156.2) 190 015 < 0.001 2.898(2.883~2.912) 2016 137 078 836 236(61.0) 122 685 641 824(52.3) 14 393 194 412(135.1) 144 530 < 0.001 2.581(2.567~2.594) 2017 137 984 835 193(60.5) 123 423 632 932(51.3) 14 561 202 261(138.9) 165 104 < 0.001 2.707(2.694~2.721) 2018 138 910 823 342(59.3) 123 129 615 334(50.0) 15 781 208 008(131.8) 157 968 < 0.001 2.636(2.623~2.649) 2019 139 654 775 764(55.5) 123 154 578 034(46.9) 16 500 197 730(119.8) 139 186 < 0.001 2.552(2.539~2.566) 2020 140 384 670 538(47.8) 122 737 496 979(40.5) 17 647 173 559(98.3) 108 134 < 0.001 2.428(2.415~2.442) 注:a括号内为报告发病率(/10万)。  下载: 导出CSV
表 2 2011―2020年全国老年人不同性别肺结核发病情况
Table 2. The reported incidences of pulmonary tuberculosis by gender among the elderly in China, 2011-2020
年份(年) 女性 男性 χ2值 P值 RR(95% CI)值 人口数(万) 报告发病数a 人口数(万) 报告发病数a 2011 6 257 49 877(79.7) 5 674 139 505(245.9) 51 835.972 < 0.001 3.084(3.053~3.116) 2012 6 276 53 976(86.0) 5 839 145 363(249.0) 48 885.627 < 0.001 2.895(2.866~2.923) 2013 6 308 53 391(84.6) 5 867 137 104(233.7) 43 235.587 < 0.001 2.761(2.734~2.789) 2014 6 515 55 032(84.5) 6 086 138 960(228.3) 42 362.804 < 0.001 2.703(2.677~2.730) 2015 6 593 58 087(88.1) 6 102 140 244(229.8) 40 812.776 < 0.001 2.609(2.584~2.634) 2016 7 469 58 238(78.0) 6 924 136 174(196.7) 37 528.019 < 0.001 2.522(2.498~2.547) 2017 7 573 60 049(79.3) 6 988 142 212(203.5) 40 434.796 < 0.001 2.567(2.542~2.591) 2018 8 209 63 477(77.3) 7 571 144 531(190.9) 38 591.231 < 0.001 2.469(2.446~2.492) 2019 8 668 59 457(68.6) 7 831 138 273(176.6) 40 071.773 < 0.001 2.574(2.550~2.599) 2020 9 315 51 645(55.4) 8 332 121 914(146.3) 36 961.428 < 0.001 2.639(2.612~2.666) 注:a括号内为报告发病率(/10万)。
下载: 导出CSV
表 3 2011―2020年全国不同年龄组老年人肺结核报告发病情况及趋势检验
Table 3. The reported incidences of pulmonary tuberculosis by age groups and trend tests in China, 2011-2020
年份(年) 65~<70岁 70~<75岁 75~<80岁 80~<85岁 ≥85岁 χ2检验 趋势检验 人口数(万) 报告发病数a 人口数(万) 报告发病数a 人口数(万) 报告发病数a 人口数(万) 报告发病数a 人口数(万) 报告发病数a χ2值 P值 Z值 P值 2011 4 395 61 882(140.8) 3 468 58 793(169.5) 2 421 41 986(173.4) 1 258 19 744(156.9) 388 6 976(179.9) 1 588.604 < 0.001 27.477 < 0.001 2012 4 176 65 981(158.0) 3 303 59 804(181.0) 2 475 44 202(178.6) 1 387 21 385(154.2) 772 7 966(103.2) 2 813.344 < 0.001 -19.903 < 0.001 2013 4 197 64 437(153.5) 3 320 55 546(167.3) 2 488 41 623(167.3) 1 394 21 003(150.7) 776 7 883(101.6) 1 986.378 < 0.001 -19.566 < 0.001 2014 4 316 66 140(153.2) 3 286 55 273(168.2) 2 601 41 929(161.2) 1 555 22 127(142.3) 843 8 520(101.1) 2 197.790 < 0.001 -27.050 < 0.001 2015 4 350 69 185(159.0) 3 314 54 870(165.6) 2 620 41 909(159.9) 1 565 22 900(146.3) 845 9 466(112.0) 1 390.516 < 0.001 -26.355 < 0.001 2016 4 932 69 613(141.2) 3 758 52 924(140.8) 2 971 40 734(137.1) 1 774 21 845(123.1) 958 9 296(97.0) 1 455.843 < 0.001 -32.121 < 0.001 2017 4 981 73 392(147.4) 3 796 53 945(142.1) 3 011 41 416(137.5) 1 800 23 400(130.0) 974 10 108(103.8) 1 256.711 < 0.001 -32.337 < 0.001 2018 5 402 75 970(140.6) 4 111 56 300(136.9) 3 264 41 528(127.2) 1 950 23 460(120.3) 1 055 10 750(101.9) 1 363.882 < 0.001 -35.606 < 0.001 2019 6 671 71 080(106.6) 4 194 53 261(127.0) 2 733 38 777(141.9) 1 909 23 088(121.0) 993 11 524(116.1) 2 285.720 < 0.001 25.704 < 0.001 2020 7 081 61 608(87.0) 4 585 48 048(104.8) 2 906 33 514(115.3) 1 841 20 157(109.5) 1 234 10 229(82.9) 2 505.939 < 0.001 21.678 < 0.001 AAPC -6.3% -5.0% -4.3% -3.9% -3.7% P值 0.001 < 0.001 < 0.001 < 0.001 0.088 注:a括号内为报告发病率(/10万)。
下载: 导出CSV
表 4 2011―2020年全国不同省份老年人肺结核报告发病率(/10万)
Table 4. The reported incidences of pulmonary tuberculosis among the elderly in different Provinces of China, 2011-2020 (/105)
地区 2011年 2012年 2013年 2014年 2015年 2016年 2017年 2018年 2019年 2020年 全国 158.7 164.5 156.5 153.9 156.2 135.1 138.9 131.8 119.8 98.3 东部 117.6 117.7 110.5 108.5 109.4 93.4 94.0 83.6 81.1 68.7 北京市 82.7 75.4 72.9 76.9 72.5 62.2 69.8 65.5 70.0 62.7 天津市 56.4 50.1 54.1 50.3 51.4 48.8 45.5 45.4 59.0 39.9 河北省 123.6 124.7 112.8 108.0 108.9 99.9 87.0 76.8 73.3 58.9 辽宁省 108.0 108.9 81.7 79.3 80.1 71.0 74.5 79.1 71.9 59.2 上海市 44.8 48.5 49.6 52.5 50.8 44.3 42.0 39.1 47.0 37.7 江苏省 116.6 116.1 111.7 102.9 102.0 80.1 77.7 65.9 66.4 60.3 浙江省 108.2 117.0 112.2 115.4 118.0 99.1 98.9 86.2 92.9 86.6 福建省 99.2 106.7 96.0 97.5 90.9 78.1 103.3 107.0 105.2 99.0 山东省 83.3 89.2 85.0 79.5 78.7 66.8 62.4 52.0 49.5 41.8 广东省 205.6 188.1 192.0 196.5 204.9 180.0 184.4 162.5 148.1 118.1 海南省 286.0 252.6 240.5 253.2 276.4 185.1 225.3 236.1 235.0 199.5 中部 183.4 195.6 188.0 183.0 181.4 152.5 152.2 140.6 138.0 111.7 山西省 149.1 142.3 127.9 111.2 116.8 92.7 92.1 82.2 76.6 68.5 吉林省 121.2 110.0 96.5 102.8 99.5 78.9 79.7 74.2 62.4 45.4 黑龙江省 156.3 164.1 162.4 168.3 169.8 144.2 131.0 107.6 98.5 58.8 安徽省 187.9 202.6 201.1 198.4 182.7 155.0 170.9 144.7 130.7 108.2 江西省 235.7 239.8 229.6 224.1 233.9 203.3 200.3 194.2 195.9 149.8 河南省 188.4 204.9 191.4 181.9 173.8 149.9 146.6 136.7 124.8 98.6 湖北省 179.7 190.2 180.9 170.8 179.5 152.5 137.6 126.8 129.4 103.5 湖南省 198.7 228.0 227.6 226.3 226.5 183.0 193.4 193.1 213.6 191.5 西部 198.6 206.0 197.5 191.6 198.8 178.4 196.2 201.3 163.6 132.1 内蒙古自治区 201.0 200.2 166.9 143.6 152.3 140.7 139.2 159.2 147.9 114.5 广西壮族自治区 261.5 289.4 268.4 278.0 285.0 215.8 247.6 221.8 227.8 191.4 重庆市 115.8 116.7 123.9 114.3 118.0 107.7 132.4 126.9 131.8 122.7 四川省 111.1 114.7 109.3 101.6 104.6 92.6 90.4 79.2 86.2 73.4 贵州省 235.9 245.4 259.1 254.0 264.3 228.7 231.9 208.8 189.6 176.5 云南省 104.8 115.3 111.8 105.6 100.2 95.0 117.5 110.9 113.0 112.9 西藏 267.4 278.5 335.1 299.2 311.4 290.1 327.6 274.4 350.6 281.2 陕西省 142.1 136.0 128.1 117.4 118.7 109.1 117.7 103.7 106.2 89.0 甘肃省 295.4 244.4 222.1 203.9 181.6 175.0 203.6 113.5 101.3 90.8 青海省 266.6 322.1 300.4 281.9 330.2 314.9 356.2 322.1 325.3 208.2 宁夏回族自治区 241.6 231.5 241.8 264.3 201.6 189.5 204.3 166.6 152.1 122.2 新疆 1 236.8 1 382.5 1 307.0 1 309.6 1 391.3 1 374.7 1 541.9 2 232.4 1 218.8 752.8
下载: 导出CSV
表 5 2011―2020年全国不同地区老年人肺结核报告发病情况及差异分析
Table 5. The reported incidences and differential analysis of pulmonary tuberculosis by regions among the elderly in China, 2011-2020
地区 2011―2020年 χ2值 P值 RR(95% CI)值 人口数(万) 报告发病数 报告发病率(/10万) 东部 59 038 566 378 95.9 1.000 中部 43 512 691 879 159.0 81 319.238 < 0.001 1.658(1.652~1.663) 西部 37 727 695 657 184.4 138 274.000 < 0.001 1.922(1.915~1.929)
下载: 导出CSV
表 6 2011―2019年全国老年人肺结核报告发病年均递降率及推算比较
Table 6. The average annual decline rate and estimated comparison of the reported incidences of pulmonary tuberculosis among the elderly in China during 2011-2019
地区 2011―2019年AAPC(%) 推算2020年报告发病率(/10万) 2020年实际报告发病率(/10万) 下降幅度(%) 全国 -3.5 115.2 98.3 14.6 东部 -4.9 74.8 68.7 8.2 中部 -4.5 121.2 111.7 7.8 西部 -1.5 173.3 132.1 23.8
下载: 导出CSV
-
[1] World Health Organization. Global tuberculosis report 2021[R]. Geneva: World Health Organization, 2021. [2] World Health Organization. Global health estimates: life expectancy and leading causes of death and disability[EB/OL]. (2021-01-11)[2022-03-08]. https://www.who.int/data/gho/data/themes/mortality-and-global-health-estimates/ghe-leading-causes-of-death. [3] Pratt RH, Winston CA, Kammerer JS, et al. Tuberculosis in older adults in the United States, 1993-2008[J]. J Am Geriatr Soc, 2011, 59(5): 851-857. DOI: 10.1111/j.1532-5415.2011.03369.x. [4] Rajagopalan S. Tuberculosis in older adults[J]. Clin Geriatr Med, 2016, 32(3): 479-491. DOI: 10.1016/j.cger.2016.02.006. [5] Donald PR, Marais BJ, Barry CE 3rd. Age and the epidemiology and pathogenesis of tuberculosis[J]. Lancet, 2010, 375(9729): 1852-1854. DOI: 10.1016/S0140-6736(10)60580-6. [6] Gardner Toren K, Spitters C, Pecha M, et al. Tuberculosis in older adults: Seattle and King County, Washington[J]. Clin Infect Dis, 2020, 70(6): 1202-1207. DOI: 10.1093/cid/ciz306. [7] 郝晓晖, 姚岚, 孙华, 等. 老年耐多药肺结核临床特征及转归分析[J]. 中华结核和呼吸杂志, 2014, 37(3): 188-191. DOI: 10.3760/cma.j.issn.1001-0939.2014.03.009.Hao XH, Yao L, Sun H, et al. A cohort study on the outcome of multidrug-resistant tuberculosis in elderly patients[J]. Chin J Tuberc Respir Dis, 2014, 37(3): 188-191. DOI: 10.3760/cma.j.issn.1001-0939.2014.03.009. [8] Sharma M, Onozaki I, Nunn P. TB in older people in Asia: why it is important[J]. Int J Tuberc Lung Dis, 2021, 25(7): 521-524. DOI: 10.5588/ijtld.21.0191. [9] United Nations. World population ageing 2019[EB/OL]. (2019-12-31)[2022-03-08]. https://www.un.org/development/desa/pd/zh/node/3172. [10] Cheng J, Sun YN, Zhang CY, et al. Incidence and risk factors of tuberculosis among the elderly population in China: a prospective cohort study[J]. Infect Dis Poverty, 2020, 9(1): 13. DOI: 10.1186/s40249-019-0614-9. [11] Zhang CY, Zhao F, Xia YY, et al. Prevalence and risk factors of active pulmonary tuberculosis among elderly people in China: a population based cross-sectional study[J]. Infect Dis Poverty, 2019, 8(1): 7. DOI: 10.1186/s40249-019-0515-y. [12] Rao VG, Bhat J, Yadav R, et al. Prevalence of pulmonary tuberculosis: a baseline survey in central India[J]. PLoS One, 2012, 7(8): e43225. DOI: 10.1371/journal.pone.0043225. [13] 新疆维吾尔自治区卫生健康委员会. 聚焦群众身边事自治区全民健康体检再提档再升级[EB/OL]. (2021-04-07)[2022-03-08]. http://wjw.xinjiang.gov.cn/hfpc/qmjktj/202104/643a883a1946483fa6ed261421da9b1d.shtml.Xinjiang Uygur Autonomous Region Health Commission. Focus on the affairs around the people, the health examination for the whole population has been upgraded[EB/OL]. (2021-04-07)[2022-03-08]. http://wjw.xinjiang.gov.cn/hfpc/qmjktj/202104/643a883a1946483fa6ed261421da9b1d.shtml. [14] 国务院新闻办公室. 抗击新冠肺炎疫情的中国行动[EB/OL]. (2020-06-07)[2022-03-08]. http://www.gov.cn/zhengce/2020-06/07/content_5517737.htm.Press Office of the State Council. China's actions to combat COVID-19[EB/OL]. (2020-06-07)[2022-03-08]. http://www.gov.cn/zhengce/2020-06/07/content_5517737.htm. [15] Huang F, Xia YY, Chen H, et al. The impact of the COVID-19 epidemic on tuberculosis control in China[J]. Lancet Reg Health West Pac, 2020, 3: 100032. DOI: 10.1016/j.lanwpc.2020.100032. [16] Dara M, Kuchukhidze G, Yedilbayev A, et al. Early COVID-19 pandemic's toll on tuberculosis services, WHO European Region, January to June 2020[J]. Euro Surveill, 2021, 26(24): 2100231. DOI: 10.2807/1560-7917.ES.2021.26.24.2100231. [17] Lakoh S, Jiba DF, Baldeh M, et al. Impact of COVID-19 on tuberculosis case detection and treatment outcomes in sierra leone[J]. Trop Med Infect Dis, 2021, 6(3): 154. DOI: 10.3390/tropicalmed6030154. [18] Nikolayevskyy V, Holicka Y, van Soolingen D, et al. Impact of the COVID-19 pandemic on tuberculosis laboratory services in Europe[J]. Eur Respir J, 2021, 57(1): 2003890. DOI: 10.1183/13993003.03890-2020. [19] Liu Q, Lu P, Shen Y, et al. Collateral impact of the coronavirus disease 2019 (COVID-19) pandemic on tuberculosis control in Jiangsu Province, China[J]. Clin Infect Dis, 2021, 73(3): 542-544. DOI: 10.1093/cid/ciaa1289. [20] Arentz M, Ma J, Zheng P, et al. The impact of the COVID-19 pandemic and associated suppression measures on the burden of tuberculosis in India[J]. BMC Infect Dis, 2022, 22(1): 92. DOI: 10.1186/s12879-022-07078-y. -

 点击查看大图
计量
- 文章访问数: 449
- HTML全文浏览量: 231
- PDF下载量: 98
- 被引次数: 0