Construction and application of healthy city index in Shandong Province
ZHU Gao-pei and SUN Han-chen contributed equally to this work
More Information
-
摘要:
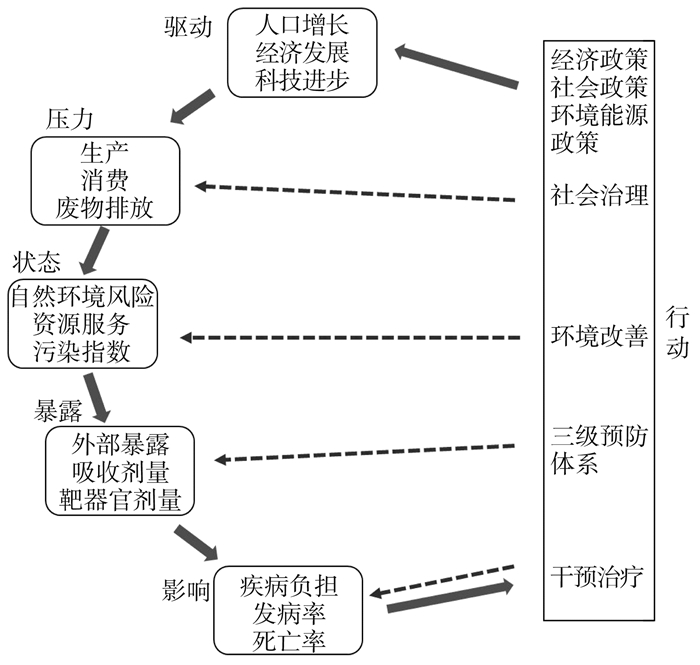
目的 构建具有山东特色的健康城市指数,实现健康城市的可持续发展。 方法 采用山东多中心健康大数据队列和多来源社会经济发展数据,通过循证证据筛选城市的决定因素和指标,基于“驱动力-压力-状态-暴露-影响-响应”(driving-force-pressure-state-exposure-effect-action,DPSEEA)概念框架梳理健康城市指标,并基于验证性因子分析法建立健康城市指标体系。采用熵权-逼近理想解(technique for order preference by similarity to ideal solution,TOPSIS)方法,计算山东省2018年各个城市健康城市得分。 结果 在健康医疗大数据的基础上,经循证证据筛选和验证性因子分析,最终确定6个维度,30个指标。熵权-TOPSIS的结果表明,健康服务的权重最大(0.305),健康人群的权重最小(0.037)。山东省健康城市指数分析显示,山东省健康城市水平低于虚拟健康标准城市,但山东省内部之间差异不大。 结论 DPSEEA结合循证医学可以指导健康城市指标体系的构建。 Abstract:Objective To construct the healthy city index with Shandong characteristics, and to realize the sustainable development of a healthy city. Methods In accordance with the Shandong multi-center health big data and multi-source socio-economic development data, the determinants and indicators of cities were screened evidence-based. Based on the conceptual framework of "driving-force-pressure-state-exposure-effect-action" (DPSEEA), we combed the indicators of healthy cities and established the indicator system of healthy cities via confirmatory factor analysis. The entropy weight-TOPSIS method was used to calculate the scores of healthy cities of Cities in Shandong Province in 2018. Results Finally, 6 dimensions and 30 indicators were determined based on health care big data and evidence-based and confirmatory factor analysis. The results of entropy weight-TOPSIS showed that the weight of health services (0.305) was the largest, and the weight of the healthy population (0.037) was the smallest. The analysis of the healthy city index in Shandong Province showed that the level of healthy cities in Shandong Province was far lower than that of standard cities, but the difference within Shandong Province was not obvious. Conclusion The DPSEEA combined with an evidence-based could be used to guide the construction of a healthy city index system. -
Key words:
- Healthy city index /
- Entropy weight-TOPSIS /
- DPSEEA /
- Health care big data
-
表 1 健康城市二级指标权重Top10
Table 1. Top 10 weights of secondary indicators of healthy cities
一级指标 二级指标 权重 健康韧性 湿地面积(千顷) 0.089 健康服务 卫生支出占财政支出比重(%) 0.061 健康韧性 居民年用水总量(亿立方米) 0.037 健康服务 体重达标率(%) 0.029 健康韧性 人均地区生产总值(元/人) 0.026 健康环境 PM10浓度(μg/m3) 0.022 健康服务 公共卫生卫生服务业规模(万亿元) 0.019 健康促进 戒烟率(%) 0.018 健康服务 人均医疗保健消费支出(元/人) 0.018 健康韧性 空气质量优良天数比例(%) 0.016 -
[1] Edokpolo B, Allaz-Barnett N, Irwin C, et al. Developing a conceptual framework for environmental health tracking in Victoria, Australia[J]. Int J Environ Res Public Health, 2019, 16(10): 1748. DOI: 10.3390/ijerph16101748. [2] Boylan S, Beyer K, Schlosberg D, et al. A conceptual framework for climate change, health and wellbeing in NSW, Australia[J]. Public Health Res Pract, 2018, 28(4): 2841826. DOI: 10.17061/phrp2841826. [3] Dahlgren G, Whitehead M. Policies and strategies to promote social equity in health. Background document to WHO-strategy paper for europe[J]. Arbetsrapport, 1991, 14: 1063-1069. [4] Organisation for Economic Co-operation, Development. Group on the state of the environment. OECD core set of indicators for environmental performance reviews[M]. Organisation for Economic Co-operation and Development, 1993: 1022-2227 [5] Cheng H, Zhu L, Meng J. Fuzzy evaluation of the ecological security of land resources in mainland China based on the pressure-state-response framework[J]. Sci Total Environ, 2022, 804: 150053. DOI: 10.1016/j.scitotenv.2021.150053. [6] Maroosi M, Mesdaghinia A, Alimohammadi M, et al. Developing environmental health indicators[EHIs] for Iran based on the causal effect model[J]. J Environ Health Sci Eng, 2019, 17(1): 273-279. DOI: 10.1007/s40201-019-00346-1. [7] Gee GC, Payne-Sturges DC. Environmental health disparities: a framework integrating psychosocial and environmental concepts[J]. Environ Health Perspect, 2004, 112(17): 1645-1653. DOI: 10.1289/ehp.7074. [8] Zeng X, Xiang H, Liu J, et al. Identification of policies based on assessment-optimization model to confront vulnerable resources system with large population scale in a big city[J]. Int J Environ Res Public Health, 2021, 18(24): 13097. DOI: 10.3390/ijerph182413097. [9] Gentry-Shields J, Bartram J. Human health and the water environment: using the DPSEEA framework to identify the driving forces of disease[J]. Sci Total Environ, 2014, 468-469: 306-314. DOI: 10.1016/j.scitotenv.2013.08.052. [10] Von Schirnding YE. Health-and-environment indicators in the context of sustainable development[J]. Can J Public Health, 2002, 93: S9-S15. DOI: 10.1007/BF03405112. [11] Liu HY, Bartonova A, Pascal M, et al. Approaches to integrated monitoring for environmental health impact assessment[J]. Environ Health, 2002, 11(21): 11-88. DOI: 10.1186/1476-069X-11-88. [12] Hambling T, Weinstein P, Slaney D. A review of frameworks for developing environmental health indicators for climate change and health[J]. Int J Environ Res Public Health, 2011, 8(7): 2854-2875. DOI: 10.3390/ijerph8072854. [13] Yu Y, Li H, Sun X, et al. Identification and estimation of causal effects using a negative-control exposure in time-series studies with applications to environmental epidemiology[J]. Am J Epidemiol, 2021, 190(3): 468-476. DOI: 10.1093/aje/kwaa172. [14] 杜红乐, 张燕. 基于APH-熵权法的影响因素研究——以商洛市旅游特色小镇可持续发展为例[J]. 湖北农业科学, 2021, 60(9): 170-174. DOI: 10.14088/j.cnki.issn0439-8114.2021.09.034.Du HL, Zhang Y. Study on the influencing factors based on APH-Entropy weight: take sustainable development of tourism characteristic towns in Shangluo city as an example Hubei[J]. Agricultural Sciences, 2021, 60(9): 170-174. DOI: 10.14088/j.cnki.issn0439-8114.2021.09.034. [15] 孙振球, 徐勇勇. 医学统计学(第4版)[M]. 北京: 人民卫生出版社, 2014: 410-413.Sun ZQ, Xu YY. Medical statistics 4rd ed[M]. Beijing: People's health publishing house, 2014: 410-413. -


 下载:
下载:


