

Analysis of the spatiotemporal distribution and clustering on newly reported pneumoconiosis cases in Bijie City, Guizhou Province from 2017 to 2021
-
摘要:
目的 分析贵州省毕节市新发尘肺病发病的空间流行特征,为职业病防治工作提供参考。 方法 应用ArcGIS 10.2、Matlab R2011a和GeoDa 0.9.5-i软件对毕节市2017—2021年新发尘肺病例数进行时空分布、空间自相关、热点分析,并将4个影响因子作为自变量,新发尘肺病例数作为因变量建立空间自回归模型,呈现该市新发尘肺病例数的时空分布和聚集性特征。 结果 毕节市2017—2021年共报告新发尘肺病1 487例,发病人数呈逐年下降趋势(Rs < 0)。全局空间自相关结果表明,新发尘肺病例数空间分布呈非随机分布,存在一定聚集性。热点分析结果显示,2017—2020年毕节市新发尘肺病例数热点区域为金沙县,2021年度为织金县,2017—2021年累计新发尘肺病例数热点区域为金沙县,差异均有统计学意义(均P < 0.05);金沙县、织金县与周围区域新发尘肺病例数分布呈高-高相邻模式。空间自回归模型结果显示,工业增加值、第二产业增加值、煤矿企业数量等3个影响因子差异有统计学意义,其中工业增加值最为明显(Z=2.574, P=0.010)。 结论 贵州省毕节市新发尘肺病例数呈逐年下降趋势,其中金沙县、织金县及邻近区域可作为重点防控区域,工业行业为尘肺病防控的重点行业。 Abstract:Objective To analyze the spatial and temporal characteristics of newly reported pneumoconiosis cases in Bijie City, Guizhou Province, aiming to provide references for the prevention and control of occupational disease. Methods The spatial and temporal distribution analysis, spatial autocorrelation analysis, hot spot analysis and spatial autoregressive analysis between four impact factors and newly reported pneumoconiosis cases (2017-2021) in Bijie City were conducted using ArcGIS 10.2, Matlab R2011a and GeoDa 0.9.5-i software. Results From 2017 to 2021, a total of 1 487 new cases of pneumoconiosis were reported in Bijie City, with an annual decrease in the number of cases (Rs < 0). The global spatial autocorrelation analysis showed a non-random spatial distribution and spatial clustering pattern for the newly reported pneumoconiosis cases. Hotspot analysis revealed that the hotspot area of the number of newly reported pneumoconiosis cases from 2017 to 2020 located in Jinsha County, and in Zhijin County at 2021, and the hotspot area of the cumulative number of newly reported pneumoconiosis cases from 2017 to 2021 located in Jinsha County. All hotspot areas were statistically significant (P < 0.05). There was a high-high adjacent distribution pattern of newly reported pneumoconiosis cases in Jinsha County, Zhijin County and surrounding areas. The results of spatial autoregressive model showed that the industrial added value, secondary sector of the economy added value and the number of coal mining enterprises were statistically significant related to the occurrence of newly reported pneumoconiosis cases in Bijie City, and the most statistically significant influencing factor was the industrial added value(Z=2.574, P=0.010). Conclusion The number of newly reported pneumoconiosis cases in Bijie City, Guizhou Province, has been decreasing annually. Jinsha, Zhijin County and the adjacent areas can be taken as the key prevention and control areas of pneumoconiosis, and the industrial sector should be the focus of pneumoconiosis prevention and control efforts. -

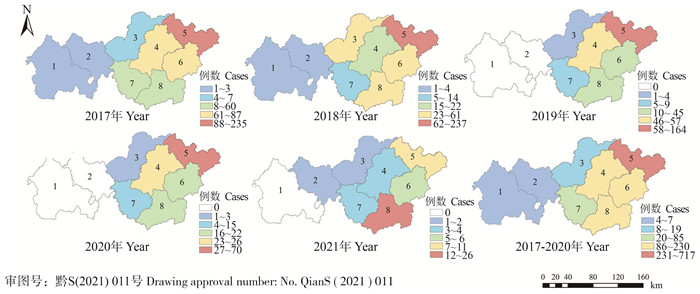
图 1 2017—2021年毕节市新发尘肺病例数空间分布
1. 威宁彝族回族苗族自治县; 2. 赫章县; 3. 七星关区; 4. 大方县; 5. 金沙县; 6. 黔西市; 7. 纳雍县; 8. 织金县。
Figure 1. Spatial distribution of newly reported pneumoconiosis cases in Bijie City from 2017 to 2021
1. WeiningYi, HuiandMiao Autonomous Count; 2. Hezhang County; 3. Qi Xing Guan District; 4. Dafang County; 5. Jinsha County; 6. Qianxi City; 7. Nayong County; 8. Zhijin County.

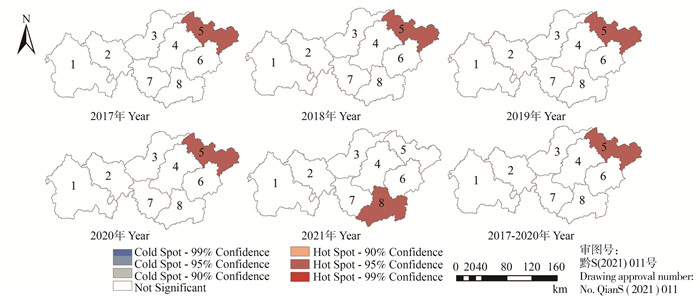
图 2 毕节市新发尘肺病例数热点分布图
1. 威宁彝族回族苗族自治县; 2. 赫章县; 3. 七星关区; 4. 大方县; 5. 金沙县; 6. 黔西市; 7. 纳雍县; 8. 织金县。
Figure 2. The hot spot distribution diagram of newly reported pneumoconiosis cases in Bijie City
1. WeiningYi, HuiandMiao Autonomous Count; 2. Hezhang County; 3. Qi Xing Guan District; 4. Dafang County; 5. Jinsha County; 6. Qianxi City; 7. Nayong County; 8. Zhijin County.
表 1 2017—2021年毕节市新发尘肺病例数的地区分布
Table 1. Geographical distribution of newly reported pneumoconiosis cases in Bijie City from 2017 to 2021
地区Areas 病例数[人数(占比/%)] Cases [Number of people (proportion /%)] 2017年Year 2018年Year 2019年Year 2020年Year 2021年Year 合计Total 七星关区Qi Xing Guan District 7(1.35) 4(0.90) 4(1.26) 3(1.94) 1(1.85) 19(1.28) 大方县Dafang County 83(15.99) 51(11.54) 57(17.98) 26(16.77) 4(7.41) 221(14.86) 金沙县Jinsha County 235(45.28) 237(53.62) 164(51.74) 70(45.16) 11(20.37) 717(48.22) 织金县Zhijin County 60(11.56) 58(13.12) 38(11.99) 22(14.19) 26(48.15) 204(13.72) 纳雍县Nayong County 43(8.29) 14(3.17) 9(2.84) 15(9.68) 4(7.41) 85(5.72) 黔西市Qianxi City 87(16.76) 73(16.52) 45(14.20) 19(12.26) 6(11.11) 230(15.47) 赫章县Hezhang County 1(0.19) 4(0.90) 0(0) 0(0) 2(3.70) 7(0.47) 威宁彝族回族苗族自治县Weining Yi, Hui and Miao Autonomous Count 3(0.58) 1(0.23) 0(0) 0(0) 0(0) 4(0.27) 合计Total 519(100.00) 442(100.00) 317(100.00) 155(100.00) 54(100.00) 1 487(100.00)  下载: 导出CSV
表 2 Daniel趋势检验结果
Table 2. The results of Daniel trend test
地区Area 年份Year Rs值value 趋势Trend wp值value 显著性Significance 七星关区Qi Xing Guan District 2017—2021 -0.850 下降descend 0.900 不显著Non-significant 大方县Dafang County -0.900 下降descend 0.900 不显著Non-significant 金沙县Jinsha County -0.900 下降descend 0.900 不显著Non-significant 织金县Zhijin County -0.900 下降descend 0.900 不显著Non-significant 纳雍县Nayong County -0.700 下降descend 0.900 不显著Non-significant 黔西市Qianxi City -1.000 下降descend 0.900 显著Significant 赫章县Hezhang County -0.350 下降descend 0.900 不显著Non-significant 威宁彝族回族苗族自治县Weining Yi, Hui and Miao Autonomous Count -1.450 下降descend 0.900 显著Significant 毕节市全域Whole area of Bijie City -1.000 下降descend 0.900 显著Significant 毕节市全域Whole area of Bijie City 2017—2020 -1.000 下降descend 1.000 不显著Non-significant
下载: 导出CSV
表 3 毕节市2017—2021年新发尘肺病例数全局空间自相关分析
Table 3. Global spatial autocorrelation analysis of newly reported pneumoconiosis cases in Bijie City from 2017 to 2021
年份Year Moran′s I值value 预期指数Expectations 方差Variance Z值value P值value 2017 0.030 -0.143 0.006 2.252 0.024 2018 0.006 -0.143 0.005 2.034 0.042 2019 0.003 -0.143 0.006 1.948 0.051 2020 -0.040 -0.143 0.005 1.398 0.162 2021 -0.056 -0.143 0.006 1.157 0.247 合计Total 0.018 -0.143 0.005 2.133 0.033
下载: 导出CSV
表 4 毕节市2017—2021年新发尘肺病例数热点分析
Table 4. Hot spot analysis of newly reported pneumoconiosis cases in Bijie City from 2017 to 2021
年份Year 地区Area Z值value P值value 显著性水平Significance level 2017 金沙县Jinsha County 2.361 0.018 Hot Spot-95% 2018 金沙县Jinsha County 2.471 0.013 Hot Spot-95% 2019 金沙县Jinsha County 2.419 0.016 Hot Spot-95% 2020 金沙县Jinsha County 2.369 0.018 Hot Spot-95% 2021 织金县Zhijin County 2.422 0.015 Hot Spot-95% 合计Total 金沙县Jinsha County 2.410 0.016 Hot Spot-95%
下载: 导出CSV
表 5 空间自回归模型拟合度指标
Table 5. Fitting indexes of spatial autoregressive models
空间自回归模型Spatial autoregressive model 对数似然估计值Log likelihood AIC值value SC值value 一阶空间自回归模型Ordinary least squares -37.477 80.953 81.192 空间滞后模型Spatial lag model -37.050 82.099 82.417 空间误差模型Spatial error model -37.229 80.457 80.696 注:AIC, 赤池信息准则; SC, 施瓦茨信息准则。
Note:AIC, Akaike Information Criterion; SC, Schwarz criterion.
下载: 导出CSV
表 6 毕节市各区县新发尘肺病例数单因素及多因素空间自回归分析指标
Table 6. Univariate and multivariate spatial autoregressive analysis of newly reported pneumoconiosis cases in different districts and counties of Bijie City
影响因素Impact factors 单因素空间误差模型Single factor spatial error model 多因素空间误差模型Multi-factor spatial error model 回归系数Coefficient Z值value P值value 异方差性诊断值B-P test value PROB值value 回归系数Coefficient Z值value P值value 95% CI 地区生产总值Gross domestic product -0.113 -0.722 0.470 0.145 0.704 工业增加值Industry 1.408 3.223 0.001 5.425 0.020 0.976 2.492 0.013 (0.209~1.744) 第二产业增加值Secondary industry 1.056 2.771 0.006 7.692 0.006 煤矿企业数量The number of coal mining enterprises 3.320 2.590 0.010 4.918 0.027 2.121 2.311 0.021 (0.322~3.919)
下载: 导出CSV
-
[1] 中华人民共和国国家卫生健康委员会. 职业性尘肺病的诊断: GBZ 70—2015[S]. 北京: 中国标准出版社, 2016: 1-13.National Health and Family Planning Commission of the People's Republic of China. Diagnosis of occupational pneumoconiosis: GBZ 70-2015[S], 2016: 1-13. [2] 李智民. 我国尘肺病防治发展历程与展望[J]. 职业卫生与应急救援, 2019, 37(5): 397-401. DOI: 10.16369/j.oher.issn.1007-1326.2019.05.001.Li ZM. Development history and prospect of pneumoconiosis prevention and treatment in China[J]. Occup Health & Emerg Rescue, 2019, 37(5): 397-401. DOI: 10.16369/j.oher.issn.1007-1326.2019.05.001. [3] Wang DM, Liang RY, Yang M, et al. Incidence and disease burden of coal workers' pneumoconiosis worldwide, 1990-2019: evidence from the Global Burden of Disease Study 2019[J]. Eur Respir J, 2021, 58(5): 2101669. DOI: 10.1183/13993003.01669-2021. [4] Li XD, Tu HW, Liu YM, et al. Spatial and temporal variations of pneumoconiosis in the Pearl River Delta region in 2006-2015[J]. Biomed Environ Sci, 2020, 33(3): 191-195. DOI: 10.3967/bes2020.026. [5] 欧阳志宏, 郭怀成, 王婉晶, 等. 1982—2012年滇池水质变化及社会经济发展对水质的影响[J]. 中国环境监测, 2015, 31(2): 68-73. DOI: 10.3969/j.issn.1002-6002.2015.02.014.Ouyang ZH, Guo HC, Wang WJ, et al. Analysis of water quality change and impacts from socio-economic development in Lake Dianchi from 1982 to 2012[J]. Environ Monit China, 2015, 31(2): 68-73. DOI: 10.3969/j.issn.1002-6002.2015.02.014. [6] 周晓农. 空间流行病学[M]. 北京: 科学出版社, 2009, 106-109, 235-238.Zhou XN. Spatial epidemiology[M]. Beijing: science press, 2009, 106-109, 235-238. [7] 冯喆, 蒋洪强, 卢亚灵. 基于大数据方法和SOFM聚类的中国经济-环境综合分区研究[J]. 地理科学, 2019, 39(2): 242-251. DOI: 10.13249/j.cnki.sgs.2019.02.008.Feng Z, Jiang HQ, Lu YL. Study on the comprehensive economic-environmental zoning of China based on big data method and SOFM clustering[J]. Sci Geogr Sin, 2019, 39(2): 242-251. DOI: 10.13249/j.cnki.sgs.2019.02.008. [8] 陈安宁. 空间计量学入门与GeoDa软件应用[M]. 杭州: 浙江大学出版社, 2014, 102-111.Chen AN. Introduction to space metrology and Geoda Software Applications[M]. Hangzhou: Zhejiang University Press, 2014, 102-111. [9] 吴田勇, 曾庆, 刘世炜, 等. 重庆市2008—2011年结核病疾病空间分布及影响因素分析[J]. 上海交通大学学报(医学版), 2013, 33(4): 489-492. DOI: 10.3969/j.issn.1674-8115.2013.04.023.Wu TY, Zeng Q, Liu SW, et al. Analysis of spatial distribution and influencing factors of tuberculosis in Chongqing from 2008 to 2011[J]. J Shanghai Jiaotong Univ Med Sci, 2013, 33(4): 489-492. DOI: 10.3969/j.issn.1674-8115.2013.04.023. [10] 邓亚丽, 张天华, 刘卫平, 等. 2014—2018年陕西省肺结核发病的时空聚集性分析[J]. 中国防痨杂志, 2020, 42(9): 948-955. DOI: 10.3969/j.issn.1000-6621.2020.09.012.Deng YL, Zhang TH, Liu WP, et al. Temporal and spatial clustering analysis of pulmonary tuberculosis incidence in Shaanxi Province from 2014 to 2018[J]. Chin J Antituberc, 2020, 42(9): 948-955. DOI: 10.3969/j.issn.1000-6621.2020.09.012. [11] 任迎娣, 方丽艳, 关坤, 等. 2011—2020年北京市海淀区尘肺病发病特征分析[J]. 环境卫生学杂志, 2021, 11(4): 390-394. DOI: 10.13421/j.cnki.hjwsxzz.2021.04.015.Ren YD, Fang LY, Guan K, et al. Features of pneumoconiosis in Haidian district of Beijing, China, from 2011 to 2020[J]. J Environ Hyg, 2021, 11(4): 390-394. DOI: 10.13421/j.cnki.hjwsxzz.2021.04.015. [12] 徐宇萍, 刘小安, 刘永泉. 江西省2010—2019年新发职业性尘肺病流行病学特征分析[J]. 中国职业医学, 2021, 48(2): 237-240. DOI: 10.11763/j.issn.2095-2619.2021.02.024.Xu YP, Liu XA, Liu YQ. Analysis of the epidemiological characteristics of new occupational pneumoconiosis in Jiangxi Province, 2010-2019[J]. China Occup Med, 2021, 48(2): 237-240. DOI: 10.11763/j.issn.2095-2619.2021.02.024. [13] 陈卫红, 邬堂春. 健康中国, 职业卫生先行: 中国职业卫生发展70年回顾与展望[J]. 中华疾病控制杂志, 2019, 23(10): 1169-1172. DOI: 10.16462/j.cnki.zhjbkz.2019.10.002.Chen WH, Wu TC. Prior development of occupational health for healthy China——Retrospect and prospect of Occupational health development in China for 70 years[J]. Chin J Dis Control Prev, 2019, 23(10): 1169-1172. DOI: 10.16462/j.cnki.zhjbkz.2019.10.002. [14] 徐颖, 许亮文, 余红剑, 等. 企业健康管理实施现状和需求调查[J]. 中国预防医学杂志, 2011, 12(5): 408-411. DOI: 10.16506/j.1009-6639.2011.05.007.Xu Y, Xu LW, Yu HJ, et al. Investigation on implementation status and needs of corporate health management[J]. China Ind Econ, 2011, 12(5): 408-411. DOI: 10.16506/j.1009-6639.2011.05.007. [15] 孔灵芝. 中国慢性非传染性疾病防治的策略调整与实践[J]. 中华预防医学杂志, 2010, 44(1): 11-13. DOI: 10.3760/cma.j.issn.0253-9624.2010.01.004.Kong LZ. Strategy adjustment and actions of non-communicable chronic diseases control and prevention in China[J]. Chin J Prev Med, 2010, 44(1): 11-13. DOI: 10.3760/cma.j.issn.0253-9624.2010.01.004. -

 点击查看大图
计量
- 文章访问数: 485
- HTML全文浏览量: 136
- PDF下载量: 42
- 被引次数: 0