

Application of spatial filtering model based on different spatial weight settings in hand-foot-mouth disease incidence data
-
摘要:
目的 研究不同空间权重矩阵设置下的空间滤波模型在华东地区手足口病(hand-foot-mouth disease, HFMD)发病数据中的应用,并比较不同空间模型的效果,评估其应用价值。 方法 收集华东地区2009年HFMD的发病数据和相关影响因素。通过空间滤波方法(eigenvector spatial filtering, ESF)将4种不同的空间权重矩阵分解,根据莫兰指数(Moran′s I, MI)和逐步回归筛选出特征向量作为空间滤波器带入模型,通过赤池信息准则(Akaike information criterion, AIC)、偏差信息准则(deviance information criterion, DIC)和均方根误差(root mean square error, RMSE)比较不同权重矩阵的影响,最后从模型系数的拟合值和标准差与置信区间的角度分析比较基于最优权重矩阵的空间滤波模型与贝叶斯空间模型。 结果 2009年华东地区共报告403 607例HFMD,主要分布在山东省西部和浙江省东南部地区,MI显示华东地区HFMD具有空间相关性。普通的负二项分布模型加入空间滤波器后,空间滤波模型残差的空间相关性被有效去除(MI分别为-0.11、-0.15、-0.08和-0.09,均P>0.05)。Rook权重矩阵为最优权重矩阵,并且最优权重矩阵下的空间滤波模型和贝叶斯空间模型的回归系数值结果接近,但是空间滤波模型的标准差和置信区间小于贝叶斯空间模型。 结论 空间滤波模型计算简单、结果准确,能够反映从整体到局部在不同地理尺度下的地图模式,揭示疾病发病的潜在空间结构,可作为传统复杂空间模型的有效替代方法。 Abstract:Objective To study the application of spatial filtering model in the incidence data of hand-foot-mouth disease (HFMD) in East China given different spatial weight, and to determine its applicability by comparing the effects of different spatial models. Methods The incidence data of hand, foot and mouth disease in East China in 2009 were collected and the related influencing factors were identified. Four different spatial weight matrices were decomposed using the eigenvector spatial filtering method (ESF), and the eigenvectors were determined according to Moran′s I(MI) value and stepwise regression, which was introduced as the spatial filter into the model. The effects of different weight matrices were compared by Akaike information criterion (AIC), deviance information criterion (DIC) and Root Mean Square Error (RMSE). Finally, the spatial filtering model based on the optimal weight matrix was compared with the Bayesian spatial model in terms of the fitting value, standard deviation and confidence interval of the model coefficients. Results There were a total of 403 607 HFMD cases reported in East China in 2009, most of which concentrated in the west of Shandong Province and the southeast of Zhejiang Province. According to MI test, HFMD exhibited spatial correlation in East China. After the spatial filter was introduced into the normal negative binomial distribution model, the residual of the spatial filter model ceased to show spatial autocorrelation (MI were -0.11, -0.15, -0.08 and -0.09, respectively, all P>0.05), and the spatial autocorrelation was effectively removed. The Rook weight matrix was considered the optimal weight matrix. Although, the regression coefficient of the spatial filtering model under the optimal weight matrix were comparable to that of the Bayesian spatial model, the spatial filtering model was still significantly outweighed by the Bayesian spatial model in terms of standard deviation and confidence interval. Conclusions The spatial filtering model demonstrates the advantages of simple calculation and accurate results. Therefore, it can be applied to visualize the map patterns at different geographic scales from whole to local, and to reveal the underlying spatial structure of disease onset. It is also applicable as an effective alternative to traditional complex spatial models. -

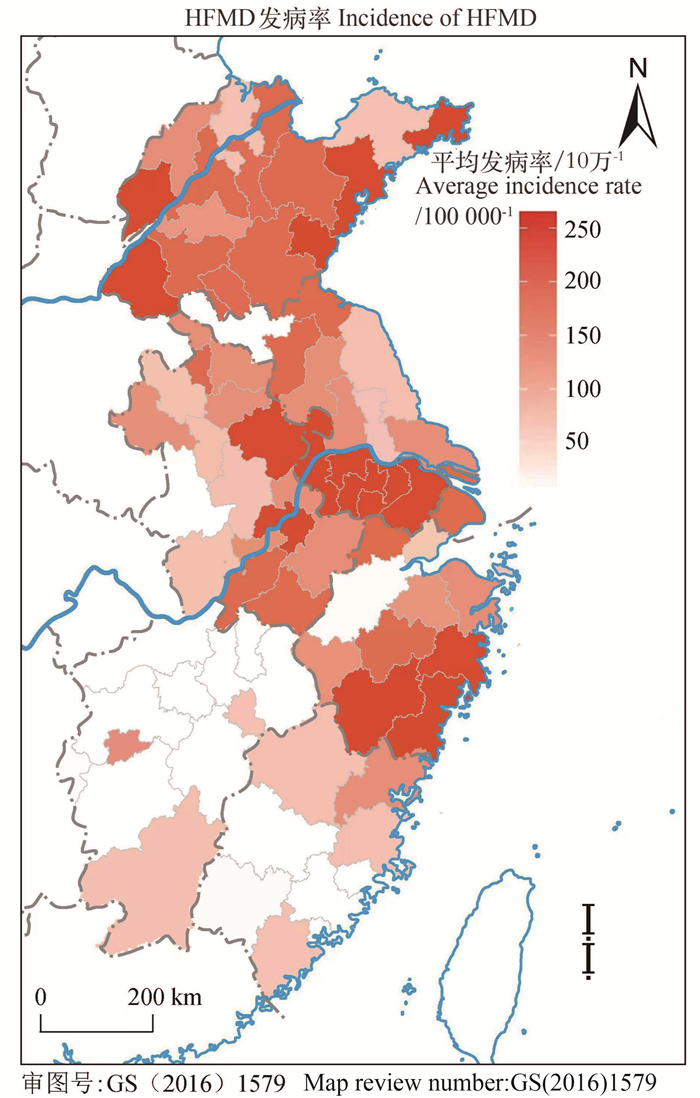
图 1 2009年中国华东地区HFMD发病率图
HFMD: 手足口病。
Figure 1. Incidence of HFMD in east mainland China in 2009
HFMD: hand-foot-mouth disease.

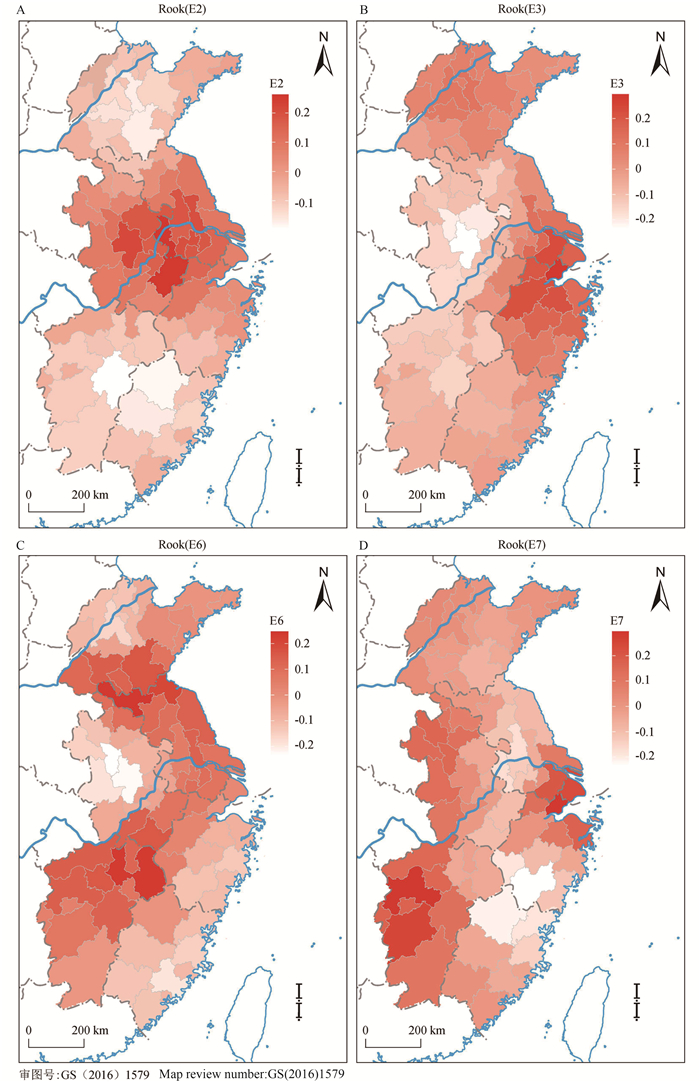
图 2 Rook权重矩阵的特征向量
E2、E3、E6、E7是Rook矩阵分解产生的MI值最大的前4个特征向量,这里将其值以地图模式呈现(数值用于比较相对大小,没有实际意义)。
Figure 2. Eigenvectors of Rook style of weight matrix
E2, E3, E6, E7 are the top four eigenvectors with the largest MI values resulting from the Rook matrix decomposition, and their values are presented here in map pattern (the values are used for comparing relative sizes and have no practical significance).
表 1 不同地理权重矩阵下的最终特征向量集和空间自相关结果
Table 1. Final eigenvectors set and spatial autocorrelation results under different geographic weight matrices
矩阵类型 Matrix type 特征向量
Eigenvector发病率
Incidence负二项模型
Negative binomial model空间滤波模型
Spatial filtering model数量
Quantity向量集
Eigenvector set莫兰指数
Moran′s IP值
value莫兰指数
Moran′s IP值
value莫兰指数
Moran′s IP值
valueRook权重矩阵 Rook weight matrix 8 E2, E3, E6, E7, E12, E13, E14, E19 0.33 0.01 0.28 0.01 -0.11 0.91 K=1权重矩阵 K=1 weight matrix 7 E1, E3, E4, E8, E9, E11, E22 0.27 0.02 0.16 0.01 -0.15 0.86 距离权重矩阵 Distance weight matrix 8 E1, E5, E6, E7, E11, E12, E13, E16 0.38 0.01 0.29 0.03 -0.08 0.81 二阶权重矩阵 Second-order weight matrix 3 E2, E3, E9 0.17 0.01 -0.02 0.56 -0.09 0.94  下载: 导出CSV
表 2 不同空间权重矩阵设置下模型的评价指标
Table 2. Evaluation index values of models under different weight settings
评价指标
Evaluation metrics空间滤波模型 Spatial filtering model 贝叶斯空间模型 Bayesian spatial model Rook权重矩阵
Rook weight matrixK=1权重矩阵
K=1 weight matrix距离权重矩阵
Distance weight matrix二阶权重矩阵
Second-order weight matrixRook权重矩阵
Rook weight matrixK=1权重矩阵
K=1 weight matrix距离权重矩阵
Distance weight matrix二阶权重矩阵
Second-order weight matrixAIC 1 393.70 1 407.30 1 396.70 1 408.70 DIC 1 399.01 1 416.79 1 398.62 1 416.45 RMSE 2 625.39 2 807.95 2 630.29 3 129.99 2 226.77 3 114.29 2 346.57 3 102.72 注:AIC, 赤池信息准则; DIC, 偏差信息准则; RMSE, 均方根误差。
Note:AIC, Akaike information criterion; DIC, deviance information criterion; RMSE, root mean square error.
下载: 导出CSV
表 3 最优权重下模型的系数比较
Table 3. Comparison of coefficients of models under optimal weights
影响因素 Influencing factor 系数 Coefficient (95% CI) s P值 value 空间滤波模型
Spatial filtering model贝叶斯空间模型
Bayesian spatial model空间滤波模型
Spatial filtering model贝叶斯空间模型
Bayesian spatial model空间滤波模型
Spatial filtering model贝叶斯空间模型
Bayesian spatial model人均GDP GDP per capita -0.01(-0.07~0.07) 0.02(-0.08~0.12) 0.07 0.10 0.06 — 相对湿度 Relative humidity -0.09(-0.18~-0.01) -0.12(-0.30~0.05) 0.08 0.17 0.08 — 平均风速 Average speed -0.19(-0.25~-0.13) -0.03(-0.14~-0.08) 0.06 0.11 0.04 — 平均温度 Average temperature -0.26(-0.34~-0.18) -0.01(-0.22~-0.21) 0.08 0.21 0.01 — 注:1. GDP, 国内生产总值。
2. “—”贝叶斯空间模型由于其统计方式的特殊性,P值不做计算,95% CI包含0则认为该影响因素无意义。
Note: 1. GDP, gross domestic product.
2. "—" P values are not calculated for Bayesian spatial model due to the specificity of their statistical approach, and a 95% CI interval containing 0 is considered to be meaningless for this influence factor.
下载: 导出CSV
-
[1] 李鹏, 葛淼, 王聪霞, 等. 2008—2014年中国大陆手足口病的时空变化规律[J]. 南京医科大学学报(自然科学版), 2018, 38(3): 380-385. DOI: 10.7655/NYDXBNS20180321.Li P, Ge M, Wang CX, et al. Temporal-spatial variation of hand-foot-mouth disease in 2008 to 2014, China[J]. Acta Universitatis Medicinalis Nanjing (Natural Science), 2018, 38(3): 380-385. DOI: 10.7655/NYDXBNS20180321. [2] 李颉, 郑步云, 王劲峰. 2008—2018年中国手足口病时空分异特征[J]. 地球信息科学学报, 2021, 23(3): 419-430. DOI: 10.12082/dqxxkx.2021.190778.Li J, Zheng BY, Wang JF. Spatial-temporal heterogeneity of hand, foot and mouth disease in China from 2008 to 2018[J]. J Geo Inf Sci, 2021, 23(3): 419-430. DOI: 10.12082/dqxxkx.2021.190778. [3] Du ZC, Lawrence WR, Zhang WJ, et al. Bayesian spatiotemporal analysis for association of environmental factors with hand, foot, and mouth disease in Guangdong, China[J]. J Geo-Inf Sci, 2018, 8(1): 15147. DOI: 10.1038/s41598-018-33109-3. [4] He XY, Dong SJ, Li LP, et al. Using a Bayesian spatiotemporal model to identify the influencing factors and high-risk areas of hand, foot and mouth disease(HFMD) in Shenzhen[J]. PLoS Negl Trop Dis, 2020, 14(3): e0008085. DOI: 10.1371/journal.pntd.0008085. [5] 王薇, 刘韫宁, 殷鹏, 等. 不同空间权重矩阵对我国心血管疾病死亡空间自相关分析的影响[J]. 中华流行病学杂志, 2021, 42(8): 1437-1444. DOI: 10.3760/cma.j.cn112338-20201102-01293.Wang W, Liu YN, Yin P, et al. Influences of using different spatial weight matrices in analyzing spatial autocorrelation of cardiovascular diseases mortality in China[J]. Chin J Epidemiol, 2021, 42(8): 1437-1444. DOI: 10.3760/cma.j.cn112338-20201102-01293. [6] Goodchild MF. What problem? Spatial autocorrelation and geographic information science[J]. Geogr Anal, 2009, 41(4): 411-417. DOI: 10.1111/j.1538-4632.2009.00769.x. [7] Tiefelsdorf M, Griffith DA. Semiparametric filtering of spatial autocorrelation: the eigenvector approach[J]. Environ Plan A, 2007, 39(5): 1193-1221. DOI: 10.1068/a37378. [8] Hong SZ, Liu F, Bauer C, et al. Intra-area factors dominate the spatio-temporal transmission heterogeneity of hand, foot, and mouth disease in China: a modelling study[J]. Sci Total Environ, 2021, 775: 145859. DOI: 10.1016/j.scitotenv.2021.145859. [9] Song C, Shi X, Bo Y, et al. Exploring spatiotemporal nonstationary effects of climate factors on hand, foot, and mouth disease using Bayesian spatiotemporally varying coefficients (STVC) model in Sichuan, China[J]. Sci Total Environ, 2019, 648: 550-560. DOI: 10.1016/j.scitotenv.2018.08.114. [10] 张湘雪, 王丽, 尹礼唱, 等. 京津唐地区HFMD时空变异分析与影响因子探测[J]. 地球信息科学学报, 2019, 21(3): 398-406. DOI: 10.12082/dqxxkx.2019.180517.Zhang XX, Wang L, Yin LC, et al. Spatiotemporal variation analysis and risk determinants of hand, foot and mouth disease in Beijing-Tianjin-Tangshan, China[J]. J Geo-Inf Sci, 2019, 21(3): 398-406. DOI: 10.12082/dqxxkx.2019.180517. [11] Patuelli R, Griffith DA, Tiefelsdorf M, et al. The use of spatial filtering techniques: the spatial and space-time structure of German unemployment data[J]. SSRN Electron J, 2006. DOI: 10.2139/ssrn.893540. [12] 赵文铀, 郑良芳, 张辉国, 等. 基于Bayesian-INLA的宏观因素对手足口病疫情的时空响应分析[J]. 中国卫生统计, 2020, 37(1): 6-9. DOI: 10.3969/j.issn.1002-3674.2020.01.002.Zhao WY, Zheng LF, Zhang HG, et al. Spatio-temporal analysis of macro factors against hand, foot and mouth disease: a Bayesian-INLA approach[J]. Chinese Journal of Health Statistics, 2020, 37(1): 6-9. DOI: 10.3969/j.issn.1002-3674.2020.01.002. [13] Tian L, Liang FC, Xu MM, et al. Spatio-temporal analysis of the relationship between meteorological factors and hand-foot-mouth disease in Beijing, China[J]. BMC Infect Dis, 2018, 18(1): 1-10. DOI: 10.1186/s12879-018-3071-3. -

 点击查看大图
计量
- 文章访问数: 632
- HTML全文浏览量: 178
- PDF下载量: 69
- 被引次数: 0