

A cohort study of air pollutant exposure with the risk of pulmonary nodules progression in Suzhou City
-
摘要:
目的 探究常见大气污染物暴露对肺结节进展风险的影响。 方法 基于苏州市立医院体检肺结节阳性人群构建队列,采用环境监测站点空气污染物数据计算个体基线前一年大气污染物平均日暴露浓度。随访肺结节患者结节进展,根据Fleischner协会提出的肺结节管理指南判断结局。采用Log-rank检验比较肺结节进展率,通过Cox比例风险回归模型估计肺结节进展风险。 结果 共纳入785例肺结节阳性个体,在中位随访23.50个月中有354例出现肺结节进展。较高浓度的SO2、NO2、PM2.5和PM10暴露组人群发生肺结节进展时间相比较低浓度组更短。多因素校正后,PM2.5(HR=1.48, 95% CI : 1.06~2.06,P<0.01)和PM10(HR=1.56, 95% CI : 1.08~2.25,P=0.02)暴露浓度最高组(Q4)肺结节进展风险高于最低组(Q1),并且肺结节进展风险与PM10暴露浓度呈正向剂量-反应关系。 结论 高浓度大气污染物暴露下肺结节进展速度较快且风险增加,有必要加强对高浓度大气污染物暴露下的肺结节患者的随访和管理工作。 -
关键词:
- 肺结节 /
- 大气污染物 /
- 队列研究 /
- Cox比例风险回归模型
Abstract:Objective This study aimed to investigate the impact of exposure to common air pollutants on the risk of pulmonary nodule progression. Methods A cohort was constructed including individuals identified with pulmonary nodules from a medical examination at a hospital in Suzhou. The average daily exposure concentrations of air pollutants in the year prior to baseline were estimated using the data from environmental monitoring stations. The nodule progression and outcomes were diagnosed by the guidelines for the management of pulmonary nodules proposed by the Fleischner Society. The log-rank test was used to compare the differences in progression rates, and the Cox proportional hazards model was used to estimate the risk of pulmonary nodule progression. Results A total of 785 individuals identified with pulmonary nodules at baseline were included, and among them, 354 cases were observed with progression of pulmonary nodules during a median follow-up of 23.50 months. The individuals exposed to higher concentrations of NO2, PM2.5, and PM10 had higher progression rates. Subjects with the highest exposure group (Q4) for PM2.5 (HR=1.48, 95% CI: 1.06-2.06, P < 0.01) and PM10 (HR=1.56, 95% CI: 1.08-2.25, P=0.02) had significantly higher risks of pulmonary nodules progression compared to that of the lowest exposure group (Q1), and there was a positive dose-response relationship between pulmonary nodules progression risks and highest level of PM10 exposure. Conclusions With the increased levels of air pollutants, the risk of pulmonary nodule progression is increased. It is necessary to strengthen the follow-up management of individuals with pulmonary nodules who are expose to the high levels of air pollutants. -

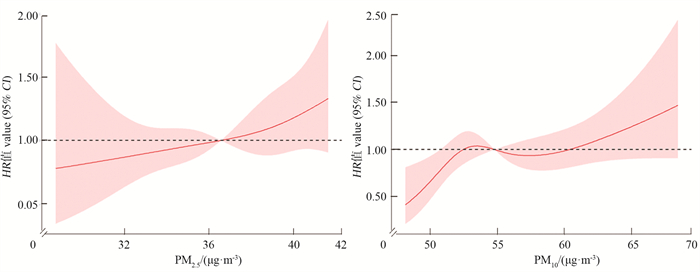
图 1 可吸入颗粒物暴露与肺结节进展的剂量反应关系
Figure 1. Dose-response relationship between respirable particulate matter exposure and progression of lung nodules

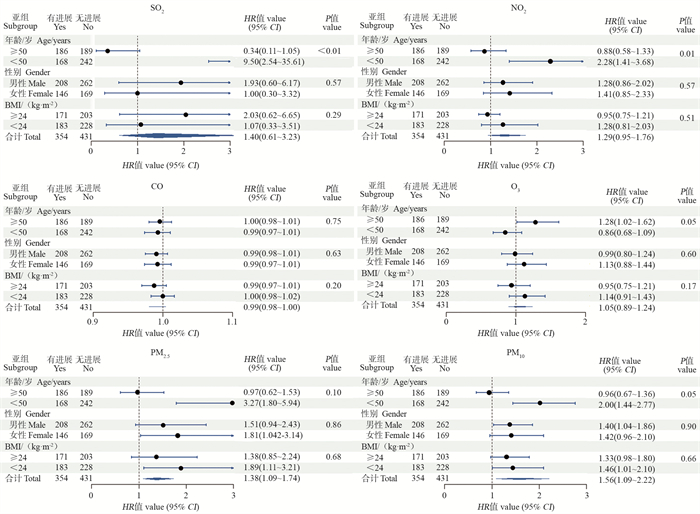
图 2 大气污染物暴露对不同亚组人群肺结节进展的影响
Figure 2. Effect of air pollutant exposure on the progression of pulmonary nodules in different subpopulations
表 1 研究对象基线特征
Table 1. Baseline characteristics of the study population
特征
Characteristics肺结节进展 ①
Progression of lung nodules ①合计 ①
Total ①
(n=785)W值 ③
valueP值
value无 No
(n=431)有 Yes
(n=354)性别 Gender NA 0.61 男性 Male 262(60.79) 208(58.76) 470(59.87) 女性 Female 169(39.21) 146(41.24) 315(40.13) 随访时间/月 Follow-up time/months 17.22±8.15 15.89±6.41 16.62±7.44 74 488 0.64 年龄/岁 Age/years 47.05±12.78 50.38±11.89 48.55±12.49 64 138 < 0.01 体质指数/(kg·m-2) Body mass index/(kg·m-2) 24.36±3.60 24.58±6.50 24.46±5.12 58 605 0.95 高血压 ② Hypertension ② NA 0.01 是 Yes 89(20.65) 102(28.81) 191(24.33) 否 No 320(74.25) 232(65.54) 552(70.32) 糖尿病 ② Diabetes ② NA 0.30 是 Yes 23(5.35) 26(7.35) 49(6.25) 否 No 380(88.17) 303(85.59) 683(87.01) 其他肺部疾病 ② Other lung diseases ② NA 0.83 是 Yes 54(14.88) 45(15.52) 99(15.16) 否 No 293(67.98) 234(66.10) 527(67.13) 吸烟 ② Smoking ② NA 0.94 是 Yes 131(30.75) 109(31.05) 240(30.89) 否 No 295(68.45) 241(68.08) 536(68.28) 饮酒 ② Alcohol intake ② NA 1.00 是 Yes 37(8.69) 30(8.57) 67(8.63) 否 No 390(90.49) 317(89.55) 707(90.06) 工作环境 ② Working environment ② NA 0.13 室内 Interior 257(76.04) 198(81.48) 455(78.31) 室外 Outdoor 81(18.79) 45(12.71) 126(16.05) SO2/(μg·m-3) 5.37±1.20 6.09±1.31 5.69±1.32 51 601 < 0.01 NO2/(μg·m-3) 38.23±3.50 41.11±3.42 39.53±3.75 41 085 < 0.01 O3/(μg·m-3) 116.53±6.52 113.51±6.49 115.16±6.67 93 023 < 0.01 CO/(mg·m-3) 0.66±0.09 0.62±0.09 0.64±0.09 91 193 < 0.01 PM10/(μg·m-3) 53.52±4.21 56.60±4.53 54.91±4.62 43 244 < 0.01 PM2.5/(μg·m-3) 35.30±3.40 37.85±3.11 36.45±3.51 42 711 < 0.01 注:NA,缺乏有效值。
①以人数(占比/%)或x±s表示;②表示该变量有缺失值;③连续型变量采用Wilcoxon检验(W值),分类变量采用Fisher′s精确概率法检验。
Note:NA, not available.
① Number of people (proportion/%) or x±s; ② Indicates that the variable has missing values; ③ The Wilcoxon test (W-value) was used for continuous variables and the Fisher′s test for categorical variables. 下载: 导出CSV
表 2 不同室外大气污染物年平均日暴露水平中位进展时间及进展率比较
Table 2. Comparison of median progression times and progression rates for different outdoor air pollutant annual mean daily exposure levels
大气污染物
Air pollutants中位进展时间/月(95% CI)
Median time to progress/months (95% CI)Q1~Q4生存率检验
Test for difference in survival rates from Q1 to Q4Q1 Q2 Q3 Q4 差异检验P值
Test of difference P value趋势检验P值
Trend test P valueSO2 24.02(23.56~NA) 24.02(23.13~28.06) 14.03(13.83~20.27) 14.16(13.80~23.89) 0.48 0.20 NO2 24.15(23.56~NA) 24.38(23.56~NA) 15.74(13.83~24.12) 14.16(13.83~23.13) 0.11 0.02 CO 15.74(13.83~24.11) 23.46(14.59~24.38) 20.11(13.83~23.72) 24.77(23.56~NA) 0.25 0.43 O3 17.35(13.90~24.21) 23.52(13.90~25.13) 23.56(22.90~24.74) 23.56(21.10~24.38) 0.89 0.47 PM2.5 24.77(23.56~NA) 24.38(23.56~NA) 14.46(13.83~24.28) 14.03(13.83~21.39) 0.05 0.01 PM10 24.77(24.02~NA) 23.56(23.52~25.89) 16.10(13.90~23.89) 14.19(13.83~23.72) 0.03 0.05 注:NA,缺乏有效值。
Note:NA, not available.
下载: 导出CSV
表 3 大气污染物暴露水平与肺结节进展风险关联
Table 3. Association between air pollutants exposure levels and risk of lung nodule progression
变量
Variable模型 ①
Model①HR值 value (95% CI) ② 污染物浓度每增加10 /(μg·m-3)
For each 10 increase in pollutant concentration /(μg·m-3)
HR值 value (95% CI)Q1 ③ Q2 Q3 Q4 SO2 模型1 Model1 1.00 0.96(0.67~1.36) 1.14(0.84~1.55) 1.14(0.85~1.54) 1.50(0.66~3.39) 模型2 Model2 1.00 1.04(0.73~1.48) 1.14(0.84~1.56) 1.21(0.89~1.63) 1.40(0.62~3.16) 模型3 Model3 1.00 1.05(0.74~1.50) 1.14(0.83~1.56) 1.22(0.90~1.65) 1.40(0.61~3.23) NO2 模型1 Model1 1.00 1.37(0.92~2.03) 1.45(1.00~2.10) 1.58(1.10~2.27) 1.37(1.01~1.86) 模型2 Model2 1.00 1.22(0.82~1.82) 1.43(0.99~2.06) 1.43(0.99~2.05) 1.29(0.95~1.75) 模型3 Model3 1.00 1.21(0.81~1.81) 1.42(0.98~2.05) 1.42(0.99~2.05) 1.29(0.95~1.76) CO 模型1 Model1 1.00 0.85(0.63~1.17) 1.05(0.81~1.37) 0.79(0.57~1.09) 0.10(0.98~1.01) 模型2 Model2 1.00 0.82(0.61~1.10) 0.96(0.74~1.26) 0.78(0.56~1.08) 0.99(0.98~1.00) 模型3 Model3 1.00 0.81(0.60~1.09) 0.95(0.72~1.24) 0.78(0.56~1.08) 0.99(0.98~1.00) O3 模型1 Model1 1.00 1.06(0.79~1.41) 1.11(0.84~1.47) 1.10(0.82~1.49) 1.03(0.88~1.21) 模型2 Model2 1.00 1.09(0.82~1.45) 1.12(0.85~1.49) 1.14(1.84~1.53) 1.05(0.89~1.24) 模型3 Model3 1.00 1.09(0.82~1.46) 1.13(0.85~1.51) 1.14(0.84~1.54) 1.05(0.89~1.24) PM2.5 模型1 Model1 1.00 1.05(0.72~1.53) 1.09(0.78~1.52) 1.40(1.01~1.94) 1.52(1.07~2.16) 模型2 Model2 1.00 1.09(0.74~1.60) 1.19(0.85~1.67) 1.46(1.05~2.03) 1.55(1.10~2.20) 模型3 Model3 1.00 1.09(0.74~1.60) 1.18(0.84~1.66) 1.48(1.06~2.06) 1.56(1.09~2.22) PM10 模型1 Model1 1.00 1.79(1.22~2.64) 1.63(1.13~2.35) 1.66(1.15~2.39) 1.35(1.07~1.69) 模型2 Model2 1.00 1.46(0.98~2.17) 1.47(1.02~2.12) 1.58(1.10~2.27) 1.38(1.10~1.73) 模型3 Model3 1.00 1.44(0.97~2.14) 1.48(1.03~2.14) 1.56(1.08~2.25) 1.38(1.09~1.74) 注:①模型1,未调整混杂因素;模型2,调整性别+年龄+体质指数(body mass index,BMI);模型3,调整性别+年龄+BMI+吸烟+学历+工作环境+高血压+糖尿病+其他肺部疾病;②根据人群年均大气污染物日暴露浓度分布的四分位数由低到高,将参与者分为Q1~Q4共4组;③对照组。
Note: ① Models, unadjusted for confounders; Model 2, adjusted for sex+age+body mass index (BMI); Model 3, adjusted for sex+age+BMI+smoking+education+work environment+hypertension+diabetes+other lung diseases; ② Participants were divided into four groups from Q1 to Q4 according to the lowest to highest quartile of the distribution of annual mean daily exposure concentrations of air pollutants in the population; ③ Control group.
下载: 导出CSV
-
[1] Siegel RL, Miller KD, Fuchs HE, et al. Cancer statistics, 2022 [J]. CA Cancer J Clin, 2022, 72(1): 7-33. DOI: 10.3322/caac.21708. [2] 赵宝连, 萧毅. 肺结节生长预测的研究现状及展望[J]. 肿瘤影像学, 2022, 31(4): 345-349. DOI: 10.19732/j.cnki.2096-6210.2022.04.001.Zhao BL, Xiao Y. Progress in the prediction of lung nodule growth [J]. Oncoradiology, 2022, 31(4): 345-349. DOI: 10.19732/j.cnki.2096-6210.2022.04.001. [3] Gawełko J, Cierpiał-Wolan M, Bwanakare S, et al. Association between air pollution and squamous cell lung cancer in south-eastern Poland [J]. Int J Environ Res Public Health, 2022, 19(18): 11598. DOI: 10.3390/ijerph191811598. [4] 中华医学会呼吸病学分会肺癌学组, 中国肺癌防治联盟专家组. 肺结节诊治中国专家共识(2018年版) [J]. 中华结核和呼吸杂志, 2018, 41(10): 763-771. DOI: 10.3760/cma.j.issn.1001-0939.2018.10.004.Lung Cancer Group of the Respiratory Disease Branch of the Chinese Medical Association, the Expert Group of the Chinese Lung Cancer Prevention and Control Alliance. Chinese expert consensus on diagnosis and treatment of lung nodules (2018) [J]. Chin J Tuberc Respir Dis, 2018, 41(10): 763-771. DOI: 10.3760/cma.j.issn.1001-0939.2018.10.004. [5] Pan XF, Wang L, Pan A. Epidemiology and determinants of obesity in China [J]. Lancet Diabetes Endocrinol, 2021, 9(6): 373-392. DOI: 10.1016/S2213-8587(21)00045-0. [6] Bankier AA, MacMahon H, Goo JM, et al. Recommendations for measuring pulmonary nodules at CT: a statement from the Fleischner society [J]. Radiology, 2017, 285(2): 584-600. DOI: 10.1148/radiol.2017162894. [7] He YT, Zhang YC, Shi GF, et al. Risk factors for pulmonary nodules in north China: a prospective cohort study [J]. Lung Cancer, 2018, 120: 122-129. DOI: 10.1016/j.lungcan.2018.03.021. [8] Wang GZ, Cheng X, Zhou B, et al. The chemokine CXCL13 in lung cancers associated with environmental polycyclic aromatic hydrocarbons pollution [J]. Elife, 2015, 4: e09419. DOI: 10.7554/eLife.09419. [9] Wang N, Mengersen K, Tong SL, et al. Short-term association between ambient air pollution and lung cancer mortality [J]. Environ Res, 2019, 179(Pt A): 108748. DOI: 10.1007/s10653-021-01072-0. [10] Liu Y, Tian ZH, He XH, et al. Short-term effects of indoor and outdoor air pollution on the lung cancer morbidity in Henan Province, Central China [J]. Environ Geochem Health, 2022, 44(8): 2711-2731. DOI: 10.1007/s10653-021-01072-0. [11] Heraganahally SS, Howarth T, Sorger L, et al. Sex differences in pulmonary function parameters among indigenous Australians with and without chronic airway disease [J]. PLoS One, 2022, 17(2): e0263744. DOI: 10.1371/journal.pone.0263744. [12] Satia I, Priel E, Al-Khazraji BK, et al. Exercise-induced bronchoconstriction and bronchodilation: investigating the effects of age, sex, airflow limitation and FEV1 [J]. Eur Respir J, 2021, 58(2): 2004026. DOI: 10.1183/13993003.04026-2020. -

 点击查看大图
计量
- 文章访问数: 152
- HTML全文浏览量: 57
- PDF下载量: 21
- 被引次数: 0