

Spatiotemporal and epidemiological characteristics of mumps in Anhui Province, 2010-2021
-
摘要:
目的 分析2010―2021年安徽省流行性腮腺炎(流腮)三间分布及时空聚集特征,了解其流行规律并为相关部门制定预防控制策略提供依据。 方法 从安徽省疾病预防控制中心收集2010―2021年安徽省流腮病例数据,利用ArcGIS 10.8、Geoda 1.20、SaTScan 10.1.2等软件对安徽省流腮进行描述性流行病学、空间自相关及时空扫描分析。 结果 2010―2021年安徽省流腮的年均发病率为23.08/10万,有2个发病流行高峰期,发病率随年份呈下降趋势(χ2 =10 287.75, P < 0.001)。男女性别比为1.67∶1,5~<15岁组儿童(68.91%)和学生(67.89%)病例数占比最高,且每年第14~28周和第46周~次年第4周是流腮的2个季节性高峰。空间自相关分析结果显示,除2012、2014和2015年,其余年份均呈空间正相关性(均P < 0.05)。时空扫描分析共形成十类聚集区,其中一类聚集区域分布在26个区/县,聚集时间为2011―2013年,聚集半径为144 km,对数似然比(log likelihood ratio, LLR)值为7 803.80。 结论 安徽省流腮发病率呈周期性流行和下降趋势,今后应继续加强对易感人群及热点地区的疾病监测和预警,以预防和控制流腮流行。 Abstract:Objective This study aimed to analyze the temporal, spatial, and population distribution and spatiotemporal clustering characteristics of mumps in Anhui Province from 2010 to 2021, understand its epidemiological pattern, and to provide a basis for the development of prevention and control strategies. Methods The reported cases of mumps in Anhui Province from 2010 to 2021 were collected from the Anhui Provincial Center for Disease Control and Prevention. ArcGIS 10.8, Geoda 1.20, and SaTScan 10.1.2 were used to conduct descriptive epidemiological, spatial auto-correlation, and spatiotemporal scanning analyses of mumps in Anhui Province. Results The annual average incidence of mumps was 23.08/100 000 in Anhui Province during 2010-2021, with two peak epidemic periods. The chi-square trend test for incidence showed a downward trend with the years (χ2 =10 287.75, P < 0.001). The sex ratio of males to females was 1.67∶1. The highest proportions of cases were aged 5- < 15 years (68.91%) and students (67.89%). Additionally, the two seasonal peaks of mumps occurred from weeks 14 to 28 and from week 46 to week 4 of the following year. The spatial auto-correlation analysis results showed that except for 2012, 2014, and 2015, the Moran′s I indexes indicated positive spatial correlations (P < 0.05). The spatiotemporal scan analysis identified a total of ten clusters, of which the first clustering area was distributed in 26 districts and counties of Anhui Province, with a clustering period of 2011―2013, a radius of 144 km and a log likelihood ratio (LLR) value of 7 803.80. Conclusions Based on the findings, there is a cyclical pattern and declining trend of mumps in Anhui Province. In the future, disease surveillance and early warnings for susceptible populations and hotspots should continue to be strengthened to prevent and control the prevalence of mumps. -

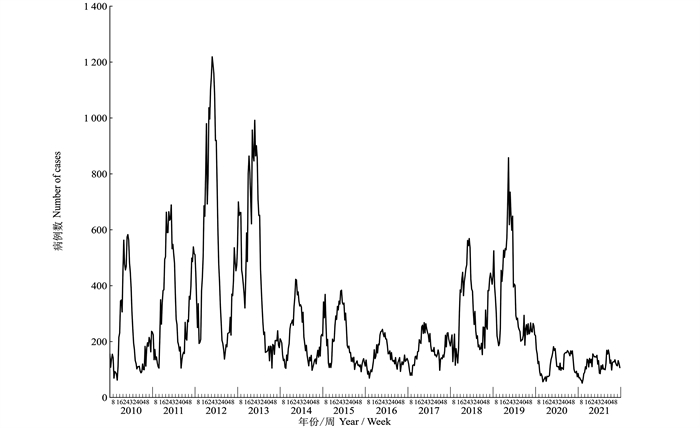
图 1 安徽省2010―2021年流行性腮腺炎报告病例的时间分布图
Figure 1. Temporal distribution of the mumps cases in Anhui Province from 2010 to 2021
表 1 2010―2021年安徽省流行性腮腺炎流行病学特征
Table 1. Epidemiological characteristics of mumps in Anhui Province, 2010-2021
变量 Variable 年均发病率/10万-1
Annual incidence rate /100 000-1占比/%
Proportion /%变量 Variable 年均发病率/10万-1
Annual incidence rate /100 000-1占比/%
Proportion /%性别 Gender 年龄组/岁 Age group/years 男 Male 14.44 62.54 40~ < 45 2.04 0.77 女 Female 8.64 37.46 45~ < 50 1.52 0.59 年龄组/岁 Age group/years ≥50 1.02 1.32 0~ < 5 39.07 12.36 职业 Occupation 5~ < 10 130.39 37.59 幼托儿童 Preschood children ― 12.90 10~ < 15 130.18 31.32 散居儿童 Diaspora children ― 10.81 15~ < 20 34.14 10.70 学生 Students ― 67.89 20~ < 25 5.31 1.82 民工 Migrant workers ― 0.61 25~ < 30 4.67 1.33 农民、牧民及渔民 Farmers, pastoralists, and fishermen ― 4.41 30~ < 35 4.02 1.17 离退人员、家务及待业 Retirees, domestic workers, and non-working ― 1.43 35~ < 40 2.95 1.02 其他 Others ― 1.94 注:“―”表示未获取职业人群的发病率结果。
Note: "―" means the results of prevalence are not available for the occupational group. 下载: 导出CSV
表 2 2010―2021年安徽省流行性腮腺炎病例的地区分布情况
地区 District 发病率/10万-1 Incidence rate /100 000-1 年均发病率/10万-1
Annual incidence rate /100 000-12010年
year2011年
year2012年
year2013年
year2014年
year2015年
year2016年
year2017年
year2018年
year2019年
year2020年
year2021年
year黄山 Huangshan 142.68 77.61 107.15 54.16 34.72 17.40 17.33 34.90 27.22 14.43 18.71 34.72 49.05 铜陵 Tongling 74.04 131.22 62.76 58.25 52.17 13.53 10.62 8.33 11.54 10.85 12.43 52.17 39.95 阜阳 Fuyang 22.88 32.75 24.11 29.07 21.75 27.07 31.59 78.26 45.70 11.43 11.29 21.75 29.17 六安 Lu′an 50.25 51.22 19.86 31.40 46.36 14.35 16.01 20.40 25.16 11.33 10.83 46.36 27.98 淮北 Huaibei 24.07 76.40 44.94 16.44 20.43 19.87 15.27 13.47 13.71 11.73 11.83 20.43 24.05 亳州 Bozhou 19.11 55.38 16.13 6.05 16.31 15.06 23.45 53.86 56.23 10.49 8.65 16.31 23.74 宣城 Xuancheng 34.78 57.43 18.65 11.15 9.30 10.69 7.84 8.95 9.97 7.18 6.96 9.30 23.43 池州 Chizhou 58.40 30.63 68.42 33.52 10.06 8.98 9.56 7.80 8.95 6.87 7.97 10.06 23.10 滁州 Chuzhou 25.85 57.62 85.71 11.00 6.70 6.05 5.19 10.45 17.77 5.21 5.32 6.70 20.70 蚌埠 Bengbu 13.49 64.34 58.83 14.70 8.75 10.21 10.48 10.72 29.72 10.97 8.68 8.75 20.63 安庆 Anqing 22.43 75.24 72.27 12.45 8.98 6.28 4.92 5.79 12.96 7.41 9.34 8.98 20.28 宿州 Suzhou 14.72 21.13 25.76 11.28 7.75 7.49 10.00 25.01 80.68 7.07 5.93 7.75 19.39 合肥 Hefei 19.73 33.98 38.45 14.50 11.11 10.82 16.70 14.31 16.07 11.81 13.54 11.11 17.91 芜湖 Wuhu 40.59 26.95 20.02 10.72 11.71 10.28 10.84 11.58 20.89 11.46 11.69 11.71 17.67 淮南 Huainan 18.04 19.88 50.62 18.54 41.45 4.54 4.98 7.48 6.48 5.19 4.58 41.45 17.56 马鞍山 Maanshan 30.60 30.83 24.23 10.02 10.40 8.35 8.79 13.55 20.84 15.46 11.39 10.40 16.35
下载: 导出CSV
表 3 2010―2021年安徽省流行性腮腺炎全局空间自相关分析
Table 3. Global autocorrelation analysis of mumps in Anhui Province, 2010-2021
年份
Year均值
Mean标准差
Standard deviationMoran′s I Z值
valueP值
value年份
Year均值
Mean标准差
Standard deviationMoran′s I Z值
valueP值
value2010 -0.009 9 0.062 0 0.136 4 2.360 2 0.024 0 2016 -0.009 7 0.067 7 0.288 7 4.396 6 0.002 0 2011 -0.008 4 0.064 8 0.373 5 5.892 0 0.001 0 2017 -0.009 1 0.071 5 0.343 6 4.930 5 0.001 0 2012 -0.007 8 0.067 0 0.093 0 1.503 2 0.065 0 2018 -0.008 6 0.053 7 0.151 2 2.975 8 0.018 0 2013 -0.007 2 0.065 2 0.284 5 4.475 8 0.001 0 2019 -0.007 4 0.068 2 0.334 2 5.008 8 0.004 0 2014 -0.008 0 0.065 4 0.057 1 0.994 4 0.140 0 2020 -0.012 9 0.069 8 0.191 6 2.928 3 0.004 0 2015 -0.007 6 0.051 8 0.018 1 0.496 1 0.208 0 2021 -0.013 3 0.073 5 0.205 3 2.975 0 0.005 0
下载: 导出CSV
表 4 2010―2021年安徽省流行性腮腺炎时空扫描分析
Table 4. Spatiotemporal scan analysis of mumps in Anhui Province from 2010 to 2021
聚集区
Clusters聚集时间/年
Cluster time /Year覆盖区县数量
Number of covered districts/counties半径
Radiu /km实际病例数
Number of actual cases期望病例数
Number of expected casesRR值
valueLLR值
valueP值
value一类 Class one 2011―2013 26 144.00 16 809 5 533.48 3.27 7 803.80 < 0.001 二类 Class two 2018―2019 1 0.00 5 794 638.45 9.37 7 703.96 < 0.001 三类 Class three 2019 3 39.57 4 671 547.40 8.75 5 942.29 < 0.001 四类 Class four 2010―2015 5 64.69 10 589 3 773.85 2.93 4 253.93 < 0.001 五类 Class five 2010 1 0.00 2 292 200.40 11.58 3 506.84 < 0.001 六类 Class six 2016―2021 12 61.00 4 113 10 952.44 0.36 2 958.76 < 0.001 七类 Class seven 2012―2013 3 21.34 2 932 464.19 6.41 2 954.64 < 0.001 八类 Class eight 2016―2021 4 48.96 790 3 814.72 0.20 1 808.63 < 0.001 九类 Class nine 2018―2019 1 0.00 2 360 502.56 4.75 1 803.18 < 0.001 十类 Class ten 2016―2021 7 65.63 3 536 7 987.23 0.43 1 631.61 < 0.001
下载: 导出CSV
-
[1] Grennan D. Mumps [J]. JAMA, 2019, 322(10): 1022. DOI: 10.1001/jama.2019.10982. [2] 李兰娟, 任红. 传染病学[M]. 8版. 北京: 人民卫生出版社, 2013: 73-74.Li LJ, Ren H. Infectious diseases [M]. 8th ed. Beijing: People′s Medical Publishing House, 2013: 73-74. [3] 朱佳佳. 中国流行性腮腺炎时空分布及时间序列模型研究[D]. 长沙: 湖南师范大学, 2019.Zhu JJ. Study on temporal and spatial distribution and time series model of mumps in China [D]. Changsha: Hunan Normal University, 2019. [4] 中华人民共和国卫生部. 流行性腮腺炎诊断标准: WS 270―2007 [S]. 北京: 人民卫生出版社, 2008: 1-2.Ministry of Health of the People′s Republic of China. Diagnostic criteria for mumps: WS 270-2007 [S]. Beijing: People′s Medical Publishing House, 2008: 1-2. [5] 冯军, 吴晓华, 李石柱, 等. 空间统计分析方法及相关软件在传染病研究中的应用[J]. 中国血吸虫病防治杂志, 2011, 23(2): 217-220. DOI: 10.3969/j.issn.1005-6661.2011.02.034.Feng J, Wu XH, Li SZ, et al. Application of spatial statistical analysis methods and related analytic softwares in research of infectious diseases [J]. Chin J Schisto Control, 2011, 23(2): 217-220. DOI: 10.3969/j.issn.1005-6661.2011.02.034. [6] Tang XY, Geater A, McNeil E, et al. Spatial, temporal and spatio-temporal clusters of measles incidence at the county level in Guangxi, China during 2004-2014: flexibly shaped scan statistics [J]. BMC Infect Dis, 2017, 17(1): 243. DOI: 10.1186/s12879-017-2357-1. [7] Tango T, Takahashi K. A flexibly shaped spatial scan statistic for detecting clusters [J]. Int J Health Geogr, 2005, 4: 11. DOI: 10.1186/1476-072X-4-11. [8] 李平, 王富珍, 杨宏, 等. 中国2004―2021年流行性腮腺炎流行病学特征和时空聚集性[J]. 中国疫苗和免疫, 2023, 29(1): 19-24. DOI: 10.19914/j.CJVI.2023004.Li P, Wang FZ, Yang H, et al. Epidemiological characteristics and spatial-temporal clustering of mumps in China, 2004-2021 [J]. Chinese Journal Vaccines and Immunization, 2023, 29(1): 19-24. DOI: 10.19914/j.CJVI.2023004. [9] 李婷婷, 田余红, 齐筱倩, 等. 2005―2012年合肥市蜀山区流行性腮腺炎的流行病学特征分析[J]. 安徽医学, 2013, 34(12): 1843-1846. DOI: 10.3969/j.issn.1000-0399.2013.12.042.Li TT, Tian YH, Qi XQ, et al. Analysis on epidemiological characteristics of mumps in Shushan district of Hefei from 2005 to 2012 [J]. Anhui Medical Journal, 2013, 34(12): 1843-1846. DOI: 10.3969/j.issn.1000-0399.2013.12.042. [10] 蒋蕊鞠, 殷琼洲, 徐明珏, 等. 2004―2018年全国流行性腮腺炎发病特征及重点防控人群分析[J]. 中国当代儿科杂志, 2019, 21(5): 441-444. DOI: 10.7499/j.issn.1008-8830.2019.05.008.Jiang RJ, Yin QZ, Xu MJ, et al. Epidemiological characteristics of mumps in China from 2004 to 2018 and key population for prevention and control [J]. Chin J Contemp Pediatr, 2019, 21(5): 441-444. DOI: 10.7499/j.issn.1008-8830.2019.05.008. [11] Hamami D, Cameron R, Pollock KG, et al. Waning immunity is associated with periodic large outbreaks of mumps: a mathematical modeling study of Scottish data [J]. Front Physiol, 2017, 8: 233. DOI: 10.3389/fphys.2017.00233. [12] Sun X, Tang FY, Hu Y, et al. High risk of mumps infection in children who received one dose of mumps-containing vaccine: waning immunity to mumps in children aged 2-5 years from kindergartens in Jiangsu Province, China [J]. Hum Vaccin Immunother, 2020, 16(7): 1738-1742. DOI: 10.1080/21645515.2019.1708162. [13] Peng Y, Wang P, Kong DG, et al. Epidemiological characteristics and spatiotemporal analysis of mumps at township level in Wuhan, China, 2005-2019 [J]. Epidemiol Infect, 2023, 151: e63. DOI: 10.1017/S0950268823000304. [14] Lin CY, Su SB, Peng CJ, et al. The incidence of mumps in Taiwan and its association with the meteorological parameters: an observational study [J]. Medicine, 2021, 100(37): e27267. DOI: 10.1097/MD.0000000000027267. [15] Yu GQ, Yang RC, Wei Y, et al. Spatial, temporal, and spatiotemporal analysis of mumps in Guangxi Province, China, 2005-2016 [J]. BMC Infect Dis, 2018, 18(1): 360. DOI: 10.1186/s12879-018-3240-4. [16] 李润滋. 山东省流行性腮腺炎时空分布与气象因素关系研究[D]. 济南: 山东大学, 2017.Li RZ. Study on the relationship between temporal and spatial distribution of mumps and meteorological factors in Shandong Province [D]. Jinan: Shandong University, 2017. [17] 崔光辉, 蒋薇薇. 2015―2020年合肥市蜀山区流行性腮腺炎流行特征分析[J]. 公共卫生与预防医学, 2022, 33(5): 114-117. DOI: 10.3969/j.issn.1006-2483.2022.05.027.Cui GH, Jiang WW. Epidemic characteristics of mumps in Shushan District of Hefei City in 2015-2020 [J]. J Pub Health Prev Med, 2022, 33(5): 114-117. DOI: 10.3969/j.issn.1006-2483.2022.05.027. [18] 薛晓嘉. 山东省呼吸道传染病的时空分布特征及其与气象干旱的关系[D]. 泰安: 泰山医学院, 2018.Xue XJ. Temporal and spatial distribution characteristics of respiratory infectious diseases in Shandong Province and its relationship with meteorological drought [D]. Taian: Taishan Medical University, 2018. -

 点击查看大图
计量
- 文章访问数: 421
- HTML全文浏览量: 136
- PDF下载量: 49
- 被引次数: 0