

Relationship between body fat percentage and conventional obesity indicators and its cut-off values in Guangxi Zhuang population
-
摘要:
目的 探讨广西壮族自治区35~<75岁壮族人群体脂率(body fat percentage, BFP)与BMI和腰围(waist circumference, WC)的关系及其肥胖切点值。 方法 基于2018―2019年广西壮族自治区少数民族自然人群慢性病前瞻性队列的基线调查资料,选取12 311名壮族人群作为研究对象。通过曲线拟合确定BFP与BMI、WC的曲线关系,利用多元线性回归模型分析BFP的主要影响因素,分别构建BMI、WC预测BPF回归方程以计算BPF的超重和肥胖切点值,以BMI、WC判定标准为金标准计算BFP相应切点值的灵敏度、特异度和受试者工作特征(receiver operating characteristic, ROC)曲线下面积(area under curve, AUC)评估其诊断价值。 结果 BMI对BFP的预测价值优于WC;基于我国肥胖标准BMI为28 kg/m2计算的BFP肥胖切点值在男性和女性中分别为23.4%和35.6%,AUC分别为0.732和0.847;对应的灵敏度和特异度,男性为0.581和0.882,女性为0.818和0.876。 结论 在广西壮族自治区人群中,基于我国肥胖标准计算BFP切点值应以BMI为参考,计算出来的切点值在男性中低于国际标准,而以BMI≥30 kg/m2时计算所得切点值均高于国际标准,其合理性还需综合考虑阳性预测值和未来肥胖相关疾病风险的研究进一步予以验证。 Abstract:Objective To investigate the association of body fat percentage (BFP) with body mass index (BMI) and waist circumference (WC) in Zhuang people aged 35- < 75 years in Guangxi, and to explore the cut-off values of obesity. Methods A total of 12 311 participants were selected from the baseline survey of the Prospective Cohort study of Chronic Diseases in Natural Minority Populations in Guangxi Zhuang Autonomous Region in 2018-2019. First, the relationship between BFP and BMI and WC was determined by curve fitting. Then, multiple linear regression model was used to analyze the main influencing factors of BFP, and regression equations for BMI and WC to predict BPF were constructed to calculate the overweight and obesity cut-off values of BPF. Finally, using BMI and WC criteria as the gold standard, the sensitivity, specificity and the area under curve (AUC) the receiver operating characteristic (ROC) of BFP corresponding cut-off values were calculated to evaluate its diagnostic value. Results BMI was superior to WC in predicting BFP. Based on the Chinese standard BMI of 28 kg/m2, the BFP obesity cut-off values was 23.4% in men and 35.6% in women, and the AUC was 0.732 and 0.847, respectively. The corresponding sensitivity and specificity were 0.581 and 0.882 in males, and 0.818 and 0.876 in females. Conclusions In Guangxi Zhuang population, the BFP cut-off values calculated based on the Chinese obesity standard should be referred to BMI. The calculated obesity cut-off value for males is lower than the international standard. However, the cut-off values calculated with BMI≥30 kg/m2 are higher than the international standard. The rationality of the BFP cut-off values needs to be further verified by considering the positive predictive value and the risk of obesity-related diseases in the future. -
Key words:
- Body fat percentage /
- Obesity /
- Zhuang ethnicity /
- Cut-off values
-

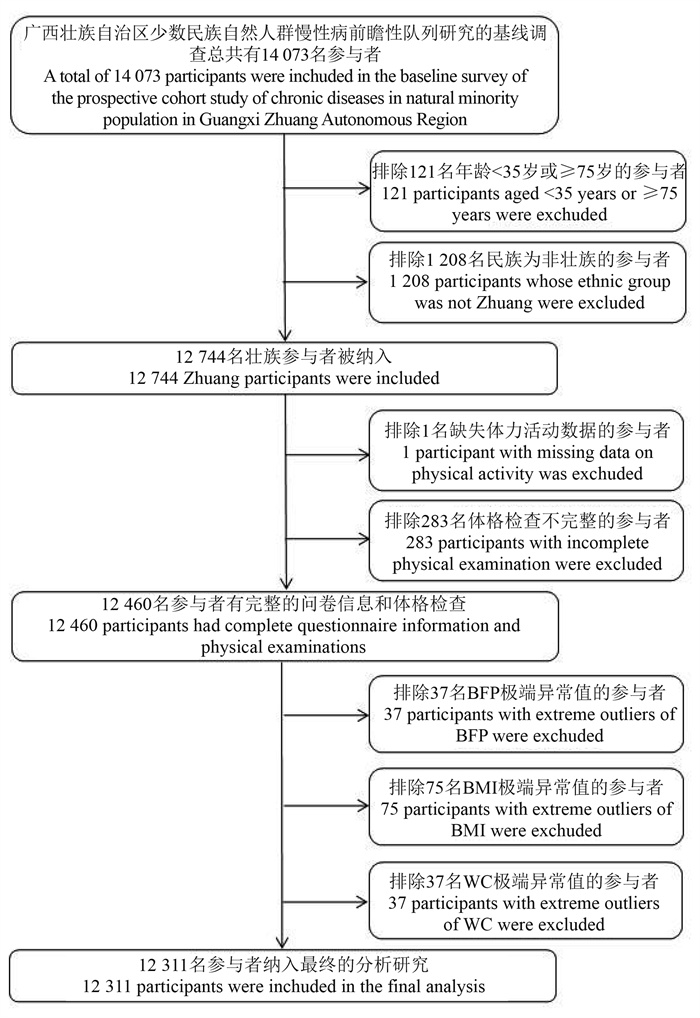
图 1 研究人群筛选流程图
BFP:体脂率;WC:腰围。
Figure 1. Flow chart for screening the study population
BFP: body fat percentage; WC: waist circumference.
表 1 研究对象一般特征及肥胖情况
Table 1. General characteristics and obesity prevalence of the study subjects
特征 Characteristic 总人数 Total ① (n=12 311) 男性 Male ① (n=5 968) 女性 Female ① (n=6 343) χ2值 value P值 value 年龄组/岁Age group/years 187.9 < 0.001 35~<45 2 679(21.8) 1 547(25.9) 1 132(17.8) 45~<55 3 869(31.4) 1 976(33.1) 1 893(29.8) 55~<65 2 992(24.3) 1 252(21.0) 1 740(27.4) 65~<75 2 771(22.5) 1 193(20.0) 1 578(24.9) 受教育水平Level of education 1 689.0 < 0.001 小学及以下Primary school and below 6 257(50.8) 1 934(32.4) 4 323(68.2) 初中Middle school 3 768(30.6) 2 307(38.7) 1 461(23.0) 高中及以上High school and above 2 286(18.6) 1 727(28.9) 559(8.8) 家庭年收入Annual household income/10 000 yuan 303.3 < 0.001 <3 6 535(53.1) 2 727(45.7) 3 808(60.0) 3~<10 4 624(37.6) 2 488(41.7) 2 136(33.7) ≥10 1 152(9.4) 753(12.6) 399(6.3) 职业Career 273.6 < 0.001 农民Farmer 6 467(52.5) 2 677(44.9) 3 790(59.8) 非农Non farmer 5 844(47.5) 3 291(55.1) 2 553(40.2) 婚姻状况Marital status 52.4 < 0.001 未婚和其他Unmarried and others 1 368(11.1) 537(9.0) 831(13.1) 已婚Married 10 943(88.9) 5 431(91.0) 5 512(86.9) 吸烟Smoking 4 458.0 < 0.001 从未Never 9 145(74.3) 2 815(47.2) 6 330(99.8) 戒烟Quit smoking 695(5.6) 693(11.6) 2(0) 当前Current 2 471(20.1) 2 460(41.2) 11(0.2) 饮酒Drinking 943.3 < 0.001 否No 10 179(82.7) 4 290(71.9) 5 889(92.8) 是Yes 2 132(17.3) 1 678(28.1) 454(7.2) 体力活动Physical activity 91.7 < 0.001 不活动Inactive 6 564(53.3) 3 122(52.3) 3 442(54.3) 中等强度Moderate intensity 2 653(21.5) 1 160(19.4) 1 493(23.5) 高强度High strength 1 707(13.9) 993(16.6) 714(11.3) 中等兼有高强度Medium to high intensity 1 387(11.3) 693(11.6) 694(10.9) BFP肥胖BFP obesity 1 978(16.1) 657(11.0) 1 321(20.8) 219.8 < 0.001 BMI肥胖BMI obesity 1 171(9.5) 573(9.6) 598(9.4) 0.1 0.743 WC肥胖WC obesity 3 691(30.0) 1 630(27.3) 2 061(32.5) 39.3 < 0.001 注:BFP, 体脂率;WC, 腰围。
①以人数(占比/%)表示。
Note: BFP, body fat percentage;WC, waist circumference.
① Number of people(proportion/%). 下载: 导出CSV
表 2 BFP与BMI、WC的曲线拟合分析
Table 2. Curve fitting analysis of BFP with BMI and WC
方程 Equation BMI预测BFP BMI prediction for BFP WC预测BFP WC prediction for BFP R2 F R2 F 线性 Linear 0.884 93 969.421 0.862 76 981.040 二次 Secondary 0.890 50 016.741 0.863 38 930.012 三次 Thrice 0.892 34 038.505 0.863 38 930.012 注:WC, 腰围;BFP, 体脂率。
Note: WC, waist circumference; BFP, body fat percentage.
下载: 导出CSV
表 3 BFP主要影响因素筛选
Table 3. Screening of main influencing factors of BFP
模型 Model 决定系数 R2 方程 Equation 性别 Gender 0.371 y= 28.379-11.906×性别 y= 28.379-11.906×gender 性别+职业 Gender+occupation 0.383 y= 27.503-12.23×性别+2.175×职业 y= 27.503-12.23×gender+2.175×occupation 性别+职业+体力活动 Gender+occupation+physical activity 0.388 y= 28.123-12.137×性别+1.94×职业-0.665×体力活动
y= 28.123-12.137×gender+1.94×occupation-0.665×physical activity性别+职业+体力活动+吸烟
Gender+occupation+physical activity+smoking0.389 y= 28.129-11.539×性别+1.942×职业-0.672×体力活动-0.638×吸烟
y= 28.129-11.539×gender+1.942×occupation-0.672×physical activity-0.638×smoking性别+职业+体力活动+吸烟+家庭年收入Gender+occupation+physical activity+smoking+annual family income 0.390 y= 28.009-11.609×性别+1.719×职业-0.689×体力活动-0.633×吸烟+0.485×家庭年收入
y= 28.009-11.609×gender+1.719×occupation-0.689×physical activity-0.633×smoking+0.485×annual family income性别+职业+体力活动+吸烟+家庭年收入+年龄Gender+occupation+physical activity+smoking+annual family income+age 0.391 y=27.485-11.588×性别+1.782×职业-0.671×体力活动-0.633×吸烟+0.538×家庭年收入+0.177×年龄
y=27.485-11.588×gender+1.782×occupation-0.671×physical activity-0.633×smoking+0.538×annual family income+0.177×age注:BFP, 体脂率。
Note: BFP, body fat percentage.
下载: 导出CSV
表 4 BFP预测方程构建
Table 4. Construction of BFP prediction equation
模型 Model 决定系数 R2 方程 Equation BMI 线性 Linear 0.699 y=-9.463-12.198×性别+1.616×BMI y=-9.463-12.198×gender+1.616×BMI 二次 Secondary 0.700 y=-21.83-12.198×性别+2.666×BMI-0.022×BMI2 y=-21.83-12.198×gender+2.666×BMI-0.022×BMI2 三次 Thrice 0.711 y=62.434-12.216×性别+0.437×BMI2-8.246×BMI-0.006BMI3 y=62.434-12.216×gender+0.437×BMI2-8.246×BMI-0.006BMI3 WC 线性 Linear 0.610 y=-12.679-13.729×性别+0.51×WC y=-12.679-13.729×gender+0.51×WC 二次 Secondary 0.611 y=-28.076-13.739×性别+0.888×WC-0.002×WC2 y=-28.076-13.739×gender+0.888×WC-0.002×WC2 三次 Thrice 0.611 y==-23.636-13.74×性别+0.712×WC-0.000009661×WC3 y==-23.636-13.74×gender+0.712×WC-0.000009661×WC3 注:WC, 腰围;BFP, 体脂率。
Note: WC, waist circumference; BFP, body fat percentage.
下载: 导出CSV
表 5 基于BMI、WC超重/肥胖标准计算的BFP切点值及诊断价值
Table 5. Corresponding BFP cut-off values and performance for diagnosing over-weight/obesity based on BMI and WC
肥胖程度判定依据 Basis for determining obesity level BFP(%) 灵敏度 Sensitivity 特异度 Specificity 约登指数 Youden′s index ROC曲线下面积 Area under ROC curve 男性Male 超重/肥胖Overweight/Obesity (BMI≥24 kg/m2) 17.3 0.692 0.759 0.451 0.726 超重/肥胖Overweight/Obesity (BMI≥25 kg/m2) 18.9 0.644 0.789 0.433 0.716 肥胖Obesity (BMI≥28 kg/m2) 23.4 0.581 0.882 0.463 0.732 肥胖Obesity (BMI≥30 kg/m2) 26.2 0.523 0.935 0.458 0.729 肥胖Obesity (WC≥90 cm) 19.5 0.618 0.785 0.403 0.701 女性Female 超重/肥胖Overweight/Obesity (BMI≥24 kg/m2) 29.5 0.822 0.775 0.597 0.798 超重/肥胖Overweight/Obesity (BMI≥25 kg/m2) 31.1 0.807 0.796 0.603 0.801 肥胖Obesity (BMI≥28 kg/m2) 35.6 0.818 0.876 0.694 0.847 肥胖Obesity (BMI≥30 kg/m2) 38.4 0.814 0.928 0.742 0.871 肥胖Obesity (WC≥85 cm) 30.7 0.711 0.740 0.451 0.726 注:WC, 腰围;BFP, 体脂率;ROC, 受试者工作特征。
Note: WC, waist circumference; BFP, body fat percentage; ROC, receiver operating characteristic.
下载: 导出CSV
-
[1] NCD Risk Factor Collaboration (NCD-RisC). Worldwide trends in underweight and obesity from 1990 to 2022: a pooled analysis of 3 663 population-representative studies with 222 million children, adolescents, and adults[J]. Lancet, 2024, 403(10431): 1027-1050. doi: 10.1016/S0140-6736(23)02750-2. [2] 中华人民共和国国家卫生健康委员会. 中国居民营养与慢性病状况报告(2020年) [J]. 营养学报, 2020, 42(6): 521.National Health Commission of the People′s Republic of China. Chinese nutrition and chronic disease status report (2020) [J]. Acta Nutrimenta Sinica, 2020, 42(6): 521. [3] Gupta S, Kapoor S. Body adiposity index: its relevance and validity in assessing body fatness of adults [J]. ISRN Obes, 2014, 2014: 243294. DOI: 10.1155/2014/243294. [4] Oliveros E, Somers VK, Sochor O, et al. The concept of normal weight obesity [J]. Prog Cardiovasc Dis, 2014, 56(4): 426-433. DOI: 10.1016/j.pcad.2013.10.003. [5] Chen KK, Wee SL, Pang BWJ, et al. Relationship between BMI with percentage body fat and obesity in Singaporean adults - The Yishun Study [J]. BMC Public Health, 2021, 21(1): 1030. DOI: 10.1186/s12889-021-11070-7. [6] Deurenberg P, Yap M, van Staveren WA. Body mass index and percent body fat: a meta analysis among different ethnic groups [J]. Int J Obes Relat Metab Disord, 1998, 22(12): 1164-1171. DOI: 10.1038/sj.ijo.0800741. [7] Deurenberg P, Weststrate JA, Seidell JC. Body mass index as a measure of body fatness: age- and sex-specific prediction formulas [J]. Br J Nutr, 1991, 65(2): 105-114. DOI: 10.1079/bjn19910073. [8] Chang CJ, Wu CH, Chang CS, et al. Low body mass index but high percent body fat in Taiwanese subjects: implications of obesity cutoffs [J]. Int J Obes Relat Metab Disord, 2003, 27(2): 253-259. DOI: 10.1038/sj.ijo.802197. [9] Chen YM, Ho SC, Lam SS, et al. Validity of body mass index and waist circumference in the classification of obesity as compared to percent body fat in Chinese middle-aged women [J]. Int J Obes, 2006, 30(6): 918-925. DOI: 10.1038/sj.ijo.0803220. [10] 胡强, 江朝强, 张维森, 等. 广州市中老年人体脂率与常规肥胖指标相关性及其对应值的研究[J]. 中华流行病学杂志, 2016, 37(10): 1341-1344. DOI: 10.3760/cma.j.issn.0254-6450.2016.10.005.Hu Q, Jiang CQ, Zhang WS, et al. Correlation between body fat percentage and general obesity indexes in middle aged and old people in Guangzhou [J]. Chin J Epidemiol, 2016, 37(10): 1341-1344. DOI: 10.3760/cma.j.issn.0254-6450.2016.10.005. [11] 夏敏, 洪明晃, 仇小强, 等. 华南区域自然人群慢性非传染性疾病前瞻性队列研究建设概况[J]. 中华流行病学杂志, 2023, 44(1): 48-53. DOI: 10.3760/cma.j.cn112338-20220929-00831.Xia M, Hong MH, Qiu XQ, et al. Introduction of a prospective cohort study of chronic and non-communicable diseases in general population in southernern China [J]. Chin J Epidemiol, 2023, 44(1): 48-53. DOI: 10.3760/cma.j.cn112338-20220929-00831. [12] Zhang LJ, Zhang JJ, Kubiak RJ, et al. Statistical methods and tool for cut point analysis in immunogenicity assays [J]. J Immunol Methods, 2013, 389(1-2): 79-87. DOI: 10.1016/j.jim.2012.12.008. [13] 中国肥胖问题工作组数据汇总分析协作组. 我国成人体重指数和腰围对相关疾病危险因素异常的预测价值: 适宜体重指数和腰围切点的研究[J]. 中华流行病学杂志, 2002, 23(1): 5-10. DOI: 10.3760/j.issn:0254-6450.2002.01.003.Coorperative Meta-analysis Group of China Obesity Task Force. Predictive values of body mass index and waist circumference to risk factors of related diseases in Chinese adult population [J]. Chin J Epidemiol, 2002, 23(1): 5-10. DOI: 10.3760/j.issn:0254-6450.2002.01.003. [14] 中华人民共和国国家卫生和计划生育委员会. WS/T 428 -2013成人体重判定[S]. 中国标准出版社. 2013: 1-8.National Health and Family Planning Commission of the People′s Republic of China. WS/T 428 -2013 Weight Determination in Adults [S]. Standards press of China, 2013: 1-8. [15] Dickey RA, Bartuska DG, Bray GW, et al. AACE/ACE position statement on the prevention, diagnosis, and treatment of obesity (1998 revision) [J]. Endocr Pract, 1998, 4: 297-350. [16] Chen HY, Chen L, Hao G. Exercise attenuates the association between household pesticide exposure and depressive symptoms: Evidence from NHANES, 2005-2014 [J]. Environ Res, 2020, 188: 109760. DOI: 10.1016/j.envres.2020.109760. [17] Di Renzo L, Itani L, Gualtieri P, et al. New BMI cut-off points for obesity in middle-aged and older adults in clinical nutrition settings in Italy: a cross-sectional study [J]. Nutrients, 2022, 14(22): 4848. DOI: 10.3390/nu14224848. [18] 范丹丹, 苏畅, 杜文雯, 等. 中国三省18~69岁居民体脂率适宜切点值研究[J]. 卫生研究, 2018, 47(2): 228-231. DOI: 10.19813/j.cnki.weishengyanjiu.2018.02.010.Fan DD, Su C, Du WW, et al. The optimal cut-off values of body fat percentage in adults among Chinese three provinces [J]. Journal of Hygiene Research, 2018, 47(2): 228-231. DOI: 10.19813/j.cnki.weishengyanjiu.2018.02.010. [19] 蒋克克. 临沂市≥18岁居民超重肥胖流行特征分析[J]. 中国初级卫生保健, 2023, 37(11): 37-39.Jiang KK. Analysis on the Epidemiological Characteristics of Overweight and Obesity among Adultresidents in Linyi [J]. Chinese Primary Health Care, 2023, 37(11): 37-39. [20] 王鹤璇, 于洁, 李里诗洛, 等. 西昌市社区居民中心性肥胖流行特征与影响因素分析[J]. 现代预防医学, 2022, 49(23): 4241-4245. DOI: 10.20043/j.cnki.MPM.202203175.Wang HX, Yu J, Li L, et al. The prevalence characteristics and influencing factors of central obesity among community residents in Xichang City [J]. Modern Preventive Medicine, 2022, 49(23): 4241-4245. DOI: 10.20043/j.cnki.MPM.202203175. [21] Wang C, Hou XH, Zhang ML, et al. Comparison of body mass index with body fat percentage in the evaluation of obesity in Chinese [J]. Biomed Environ Sci, 2010, 23(3): 173-179. DOI: 10.1016/S0895-3988(10)60049-9. [22] 黄晖明, 王人卫, 李森, 等. 体重指数与体脂率指标评价肥胖: 基于诊断试验的比较研究[J]. 中国运动医学杂志, 2017, 36(3): 218-225. DOI: 10.3969/j.issn.1000-6710.2017.03.006.Huang HM, Wang RW, Li S, et al. Relationship between body mass index and percent body fat in the diagnosis of obesity: based on diagnostic tests [J]. Chin J Sports Med, 2017, 36(3): 218-225. DOI: 10.3969/j.issn.1000-6710.2017.03.006. [23] Segheto W, Coelho FA, Cristina Guimarães da Silva D, et al. Validity of body adiposity index in predicting body fat in Brazilians adults [J]. Am J Hum Biol, 2017, 29(1): 10.1002/ajhb. 22901. DOI: 10.1002/ajhb.22901. [24] 李晓晨, 陈佩. BMI、WC、WHtR和BF%诊断老年肥胖的一致性研究[J]. 哈尔滨体育学院学报, 2022, 40(1): 81-88.Li XC, Chen P. Consistency of BMI, WC, WHtR and BF% in the diagnosis of obesity in the elderly [J]. Journal of Harbin Sport University, 2022, 40(1): 81-88. [25] 张强, 周绍酉, 闫雪皎, 等. 体质指数和体脂肪率评价成年人肥胖的比较[J]. 卫生研究, 2019, 48(4): 573-576. DOI: 10.19813/j.cnki.weishengyanjiu.2019.04.023.Zhang Q, Zhou SY, Yan XJ, et al. Optimum body fat percentage cut-off in evaluation of overweight and obesity among adult people [J]. Journal of Hygiene Research, 2019, 48(4): 573-576. DOI: 10.19813/j.cnki.weishengyanjiu.2019.04.023. [26] Ho-Pham LT, Lai TQ, Nguyen MT, et al. Relationship between body mass index and percent body fat in Vietnamese: implications for the diagnosis of obesity [J]. PLoS One, 2015, 10(5): e0127198. DOI: 10.1371/journal.pone.0127198. [27] Wang J, Thornton JC, Russell M, et al. Asians have lower body mass index (BMI) but higher percent body fat than do whites: comparisons of anthropometric measurements [J]. Am J Clin Nutr, 1994, 60(1): 23-28. DOI: 10.1093/ajcn/60.1.23. [28] Bray GA. Medical consequences of obesity [J]. J Clin Endocrinol Metab, 2004, 89(6): 2583-2589. DOI: 10.1210/jc.2004-0535. [29] WHO Expert Consultation. Appropriate body-mass index for Asian populations and its implications for policy and intervention strategies [J]. Lancet, 2004, 363(9403): 157-163. DOI: 10.1016/S0140-6736(03)15268-3. -

 点击查看大图
计量
- 文章访问数: 402
- HTML全文浏览量: 110
- PDF下载量: 20
- 被引次数: 0