

Construction of air quality health index based on years of life lost in Shijiazhuang
-
摘要:
目的 掌握2017―2020年石家庄市大气污染物对居民寿命损失年(years of life lost, YLL)的影响,构建石家庄市空气质量健康指数(air quality health index, AQHI)。 方法 收集石家庄市2017―2020年大气污染物、气象因素以及居民死亡数据,利用标准寿命表计算每日YLL。采用广义相加模型评估大气污染物与每日YLL的暴露-反应关系,并通过主成分分析法构建大气污染物主成分。应用大气污染物主成分与每日YLL初步构建石家庄市AQHI,并比较AQHI与空气质量指数(air quality index, AQI)对居民YLL的影响。 结果 2017―2020年石家庄市日均非意外YLL值为719.3人年。细颗粒物(fine particulate matter, PM2.5)、可吸入颗粒物(inhalable particles, PM10)、二氧化硫(sulfur dioxide, SO2)、二氧化氮(nitrogen dioxide, NO2)和臭氧(ozone, O3)浓度每升高1 μg/m3,YLL增加量分别为0.270(95% CI: 0.002~0.538)、0.230(95% CI: 0.048~0.413)、2.383(95% CI: 1.068~3.698)、1.135(95% CI: 0.323~1.947)和-0.513(95% CI: -0.959~-0.066)。选取2个主成分(方差贡献率分别为66.61%和16.44%)构建AQHI,AQHI每增加1个四分位数间距,全人群、男性、女性、 < 65岁和≥65岁人群YLL分别增加28.848(95% CI: 9.309~48.386)、20.697(95% CI: 5.940~35.455)、8.150(95% CI: -1.791~18.092)、16.657(95% CI: 2.668~30.646)和12.190(95% CI: 1.455~22.926)人年,均高于AQI的YLL增加量。 结论 2017―2020年石家庄市大气污染物PM2.5、PM10、SO2、NO2和O3均对YLL存在影响。通过大气污染物主成分与每日YLL构建的AQHI可较好地评价空气污染对人群健康的影响。 Abstract:Objective To master the impact of air pollutants on years of life lost (YLL) for residents, and to construct the air quality health index (AQHI) in Shijiazhuang. Methods Air pollutants, meteorological, and resident mortality data were collected from 2017 to 2020 in Shijiazhuang, and the daily YLL were calculated using the standard life table. A generalized additive model was used to assess the exposure-response relationship between air pollutants and daily YLL, and the principal components of air pollutants were constructed by principal component analysis. The main components of air pollutants and daily YLL were used to construct AQHI in Shijiazhuang, and the effects of AQHI and the air quality index (AQI) on YLL were compared. Results From 2017 to 2020, the average daily non-accidental YLL in Shijiazhuang was 719.3 person-years. The YLL increased by 0.270 (95% CI: 0.002-0.538), 0.230 (95% CI: 0.048-0.413), 2.383 (95% CI: 1.068-3.698), 1.135 (95% CI: 0.323-1.947), and -0.513 (95% CI: -0.959-0.066) for each 1 μg/m3 increase in PM2.5, PM10, SO2, NO2, and O3, respectively. Two principal components (66.61% and 16.44% of variance contribution) were selected to construct AQHI. For every 1 IQR increase in AQHI, the YLL of the whole population, male, female, < 65 years old and ≥65 years old increased by 28.848 (95% CI: 9.309-48.386), 20.697 (95% CI: 5.940-35.455), 8.150 (95% CI: -1.791-18.092), 16.657 (95% CI: 2.668-30.646) and 12.190 (95% CI: 1.455-22.926) person-years, respectively, which were higher than the AQI YLL increased. Conclusions The atmospheric pollutants PM2.5, PM10, SO2, NO2 and O3 in Shijiazhuang affect YLL from 2017 to 2020. The AQHI constructed by the principal components of air pollutants and daily YLL can better evaluate the effect of air pollution on population health. -

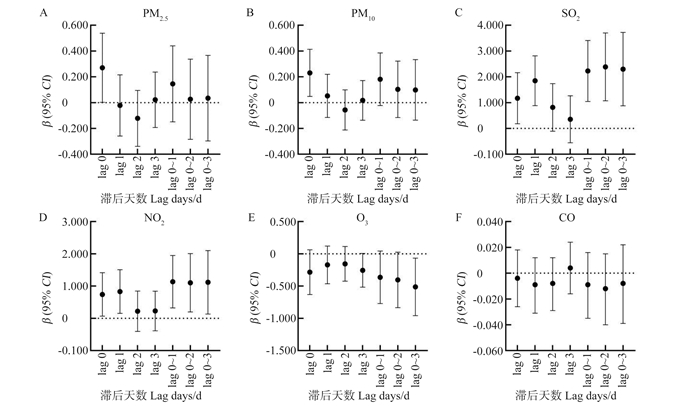
图 1 不同滞后天数大气污染物每上升1 μg/m3非意外YLL增加量
PM10,可吸入颗粒物;PM2.5,细颗粒物;SO2,二氧化硫;NO2,二氧化氮;O3,臭氧;CO,一氧化碳;YLL,寿命损失年。
Figure 1. The generalized additive model was used to evaluate the impact of each 1 μg/m3 increase in different air pollutants on non-accidental YLL in Shijiazhuang from 2017 to 2020
PM10, inhalable particles; PM2.5, fine particulate matter; SO2, sulfur dioxide; NO2, nitrogen dioxide; O3, ozone; CO, carbon monoxide; YLL, years of life lost.
表 1 2017―2020年石家庄市每日YLL、大气污染物及气象数据基本情况
Table 1. The basic situation of daily YLL, air pollutants and meteorological data in Shijiazhuang from 2017 to 2020
指标Index x±s 最小值Min M(P25, P75) 最大值Max 每日YLL/人年YLL per day/person-year 非意外Not accidental 719.3±207.9 185.5 691.7(576.1, 833.0) 2 087.8 男性Male 456.4±150.8 71.5 439.0(350.8, 542.1) 1 351.9 女性Female 262.8±99.5 37.1 252.3(191.8, 320.4) 737.0 < 65岁years 321.6±134.6 0 301.9(224.0, 403.6) 1 025.2 ≥65岁years 397.7±119.2 117.6 382.5(316.7, 466.6) 1 144.2 大气污染物Air pollutants/(μg·m-3) PM10 127.9±78.9 21.0 107.0(74.0, 159.0) 619.0 PM2.5 70.0±56.7 9.0 52.0(34.0, 83.5) 445.0 SO2 21.1±17.3 4.0 16.0(10.0, 25.0) 153.0 NO2 47.6±21.6 7.0 45.0(31.0, 60.0) 144.0 O3 105.0±64.3 4.0 94.0(53.5, 152.0) 310.0 CO 1 160.5±718.4 200.0 1 000.0(800.0, 1 288.0) 8 257.0 气象因素Meteorological factors 日均气温Average daily temperature/℃ 14.8±10.9 -7.4 15.7(4.6, 24.8) 33.7 相对湿度Relative humidity/% 54.8±20.1 7.0 54.0(39.0, 70.0) 100.0 注:YLL,寿命损失年;PM10,可吸入颗粒物;PM2.5,细颗粒物;SO2,二氧化硫;NO2,二氧化氮;O3,臭氧;CO,一氧化碳。
Note: YLL, years of life lost; PM10, inhalable particles; PM2.5, fine particulate matter; SO2, sulfur dioxide; NO2, nitrogen dioxide; O3, ozone; CO, carbon monoxide. 下载: 导出CSV
表 2 2017―2020年石家庄市大气污染物与气象因素间Spearman秩相关系数
Table 2. Spearman-rank correlation coefficient between air pollutants and meteorological factors in Shijiazhuang from 2017 to 2020
指标
IndexPM10/(μg·m-3) PM2.5/(μg·m-3) SO2/(μg·m-3) NO2/(μg·m-3) O3/ (μg·m-3) CO/(μg·m-3) 日均气温
Average daily
temperature/℃相对湿度
Relative
humidity/%PM10/(μg·m-3) 1.00 0.89① 0.65① 0.73① -0.28① 0.69① -0.39① -0.03 PM2.5/(μg·m-3) 1.00 0.52① 0.64① -0.34① 0.76① -0.44① 0.24① SO2/(μg·m-3) 1.00 0.67① -0.14① 0.53① -0.31① -0.41① NO2/(μg·m-3) 1.00 -0.47① 0.61① -0.47① -0.12① O3/ (μg·m-3) 1.00 -0.42① 0.85① -0.04 CO/(μg·m-3) 1.00 -0.53① 0.05 日均气温Average daily temperature/℃ 1.00 0.14① 相对湿度Relative humidity/% 1.00 注:PM10,可吸入颗粒物;PM2.5,细颗粒物;SO2,二氧化硫;NO2,二氧化氮;O3,臭氧;CO,一氧化碳。
① P<0.05。
Note: PM10, inhalable particles; PM2.5, fine particulate matter; SO2, sulfur dioxide; NO2, nitrogen dioxide; O3, ozone; CO, carbon monoxide.
① P<0.05.
下载: 导出CSV
表 3 大气污染物主成分分析成分载荷矩阵及方差贡献率
Table 3. Principal component analysis of air pollutants component load matrix and variance contribution rate
指标Index Dim.1 Dim.2 Dim.3 Dim.4 Dim.5 PM10/(μg·m-3) lag 0 d 0.854 0.045 0.068 0.004 0.028 PM2.5/(μg·m-3) lag 0 d 0.838 0.031 0.061 0.048 0.022 O3/(μg·m-3) lag 0~3 d 0.326 0.633 0.014 0.027 ― NO2/(μg·m-3) lag 0~1 d 0.779 0.020 0.003 0.197 0.002 SO2/(μg·m-3) lag 0~2 d 0.534 0.092 0.372 0.002 ― 方差贡献率
Variance contribution rate/%66.61 16.44 10.35 5.57 1.03 累计方差贡献率
Cumulative variance contribution rate/%66.61 83.05 93.40 98.97 100.00 注:“―”表示数据无法获取。
Note: "―" indicates that the data cannot be obtained.
下载: 导出CSV
表 4 大气污染物主成分的分布特征以及对总人群非意外YLL的影响
Table 4. The minimum, quartile, maximum and YLL increase of principal components 1 and 2 of air pollutants
主成分
Principal component人数
Number of people最小值
MinP25 M P75 最大值
MaxYLL增加量/人年
YLL increases/person-year
(95% CI)Dim.1 1 461 -4.221 0 -1.738 7 -0.631 3 0.986 9 16.610 1 8.840(2.629~15.051)① Dim.2 1 461 -1.032 7 -0.506 2 -0.062 6 0.415 9 1.670 3 -18.374(-57.162~20.413) 注:YLL,寿命损失年。
① P < 0.05。
Note: YLL, years of life lost.
① P < 0.05.
下载: 导出CSV
表 5 石家庄市AQHI的分级标准
Table 5. Grading standards for AQHI in Shijiazhuang
健康风险级别Health risk level AQHI 风险人群People at risk 普通人群The general population 低风险Low risk 0~3 正常参加室外活动
Participate in outdoor activities as normal正常参加室外活动
Participate in outdoor activities as normal中风险Medium risk >3~6 感到不适人群应减少室外活动
People who feel unwell should reduce outdoor activities无需减少日常的室外活动
There is no need to reduce your daily outdoor activities高风险High risk >6~10 老年、儿童和感到不适人群减少室外活动
Older people, children, and people who are feeling unwell reduce outdoor activities若出现咳嗽、喉咙发炎等症状应减少室外活动
If you have symptoms such as cough and throat irritation, reduce outdoor activities极高风险Extremely high risk >10 老年、儿童和感到不适人群停止室外活动
Older people, children, and people who are feeling unwell should stop outdoor activities所有人群避免室外活动
All groups of people avoid outdoor activities注:AQHI,空气质量健康指数。
Note: AQHI, air quality health index.
下载: 导出CSV
表 6 2017―2020年石家庄市AQHI和AQI基本描述
Table 6. Basic description of AQHI and AQI in Shijiazhuang from 2017 to 2020
指数
Index最小值
MinP25 M P75 最大值
MaxIQR 达标天数
Number of days to
meet the standard/d达标率
Attainment
rate/%χ2值
valueP值
valueAQI 0 73 101 140 500 67 724 49.6 4.00 0.045 AQHI 1 3 4 5 14 2 670 45.9 注:达标率,AQHI和AQI中达标天数占总天数的比率;AQHI,空气质量健康指数;AQI,空气质量指数。
Note: Attainment rate, the ratio of the number of days to the total number of days in AQHI and AQI; AQHI, air quality health index; AQI, air quality index.
下载: 导出CSV
表 7 2017―2020年石家庄市AQHI和AQI对不同人群非意外YLL的影响
Table 7. Effects of AQHI and AQI on non-accidental YLL in different populations in Shijiazhuang City from 2017 to 2020
指标Index YLL增加量/人年YLL increases/person-year AQHI R2 AQI R2 全人群The whole population 28.848(9.309 ~ 48.386)① 0.246 9.385(-3.975 ~ 22.744) 0.242 性别Gender 男Male 20.697(5.940 ~ 35.455)① 0.183 9.709(-0.373 ~ 19.790) 0.180 女Female 8.150(-1.791 ~ 18.092) 0.148 -0.324(-7.112 ~ 6.465) 0.147 年龄组/岁Age group/years < 65 16.657(2.668 ~ 30.646)① 0.077 6.538(-3.017 ~ 16.094) 0.075 ≥65 12.190(1.455 ~ 22.926)① 0.307 2.846(-4.489 ~ 10.181) 0.305 注:YLL,寿命损失年;AQHI,空气质量健康指数;AQI,空气质量指数。
① P<0.05。
Note: YLL, years of life lost; AQHI, air quality health index; AQI, air quality index.
① P < 0.05.
下载: 导出CSV
-
[1] Zeng Q, Fan L, Ni Y, et al. Construction of AQHI based on the exposure relationship between air pollution and YLL in northern China[J]. Sci Total Environ, 2020, 710: 136264. DOI: 10.1016/j.scitotenv.2019.136264. [2] Stieb DM, Burnett RT, Smith-Doiron M, et al. A new multipollutant, no-threshold air quality health index based on short-term associations observed in daily time-series analyses[J]. J Air Waste Manag Assoc, 2008, 58(3): 435-450. DOI: 10.3155/1047-3289.58.3.435. [3] Zhou CL, Lyu LS, Jin DH, et al. Temperature change between neighboring days contributes to years of life lost per death from respiratory disease: a multicounty analysis in central China[J]. Int J Environ Res Public Health, 2022, 19(10): 5871. DOI: 10.3390/ijerph19105871. [4] Liu C, Chen R, Sera F, et al. Interactive effects of ambient fine particulate matter and ozone on daily mortality in 372 cities: two stage time series analysis[J]. BMJ, 2023, 383: e075203. DOI: 10.1136/bmj-2023-075203. [5] Chen RJ, Zhou B, Kan HD, et al. Associations of particulate air pollution and daily mortality in 16 Chinese cities: an improved effect estimate after accounting for the indoor exposure to particles of outdoor origin[J]. Environ Pollut, 2013, 182: 278-282. DOI: 10.1016/j.envpol.2013.07.024. [6] GBD 2017 Causes of Death Collaborators. Global, regional, and national age-sex-specific mortality for 282 causes of death in 195 countries and territories, 1980-2017: a systematic analysis for the Global Burden of Disease Study 2017[J]. Lancet, 2018, 392(10159): 1736-1788. DOI: 10.1016/S0140-6736(18)32203-7. [7] Park DI. Development and validation of a knowledge, attitudes and practices questionnaire on COVID-19 (KAP COVID-19)[J]. Int J Environ Res Public Health, 2021, 18(14): 7493. DOI: 10.3390/ijerph18147493. [8] 环境保护部, 国家质量监督检验检疫总局. 环境空气质量标准: GB 3095-2012[S]. 北京: 中国环境科学出版社, 2016: 3.Ministry of Ecology and Environment of the People's Republic of China, General Administration of Quality Supervision, Inspection and Quarantine of the People's Republic of China. Ambient air quality standard: GB 3095-2012[S]. Beijing: China Environmental Science Press, 2016: 3. [9] Orellano P, Reynoso J, Quaranta N, et al. Short-term exposure to particulate matter (PM10 and PM2.5), nitrogen dioxide (NO2), and ozone (O3) and all-cause and cause-specific mortality: Systematic review and meta-analysis[J]. Environ Int, 2020, 142: 105876. DOI: 10.1016/j.envint.2020.105876. [10] He T, Yang Z, Liu T, et al. Ambient air pollution and years of life lost in Ningbo, China[J]. Sci Rep, 2016, 6(1): 22485. DOI: 10.1038/srep22485. [11] Guo Y, Li S, Tian Z, et al. The burden of air pollution on years of life lost in Beijing, China, 2004-08: retrospective regression analysis of daily deaths[J]. BMJ, 2013, 347: f7139. DOI: 10.1136/bmj.f7139. [12] Ni Y, Song W, Bai Y, et al. Years of life lost (YLL) due to short-term exposure to ambient air pollution in China: a systematic review and meta-analysis[J]. Int J Environ Res Public Health, 2021, 18(21): 11467. DOI: 10.3390/ijerph182111467. [13] Zeng Q, Bai Y, Zhang M, et al. The construction and validity assessment of the respiratory air quality health index (AQHI) based on the analytic hierarchy process in Tianjin, China[J]. BMC Public Health, 2024, 24(1): 2895. DOI: 10.1186/s12889-024-20399-8. [14] Chen MJ, Leon Guo Y, Lin P, et al. Air quality health index (AQHI) based on multiple air pollutants and mortality risks in Taiwan: Construction and validation[J]. Environ Res, 2023, 231(2): 116214. DOI: 10.1016/j.envres.2023.116214. [15] Cao R, Wang YX, Huang J, et al. The construction of the air quality health index (AQHI) and a validity comparison based on three different methods[J]. Environ Res, 2021, 197: 110987. DOI: 10.1016/j.envres.2021.110987. -

 点击查看大图
计量
- 文章访问数: 103
- HTML全文浏览量: 52
- PDF下载量: 13
- 被引次数: 0