

Association between triglyceride glucose-body mass index and new-onset non-alcoholic fatty liver disease in coal miners: a retrospective cohort study
-
摘要:
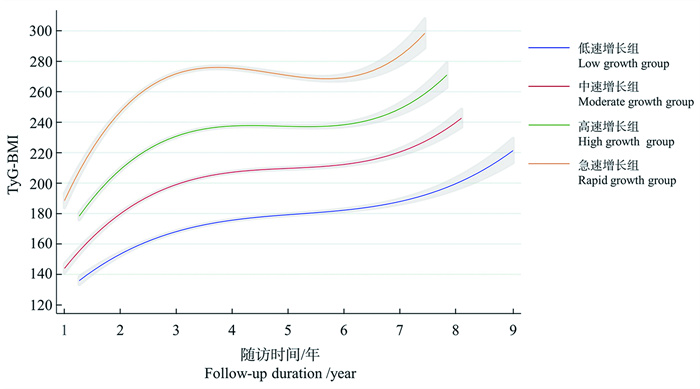
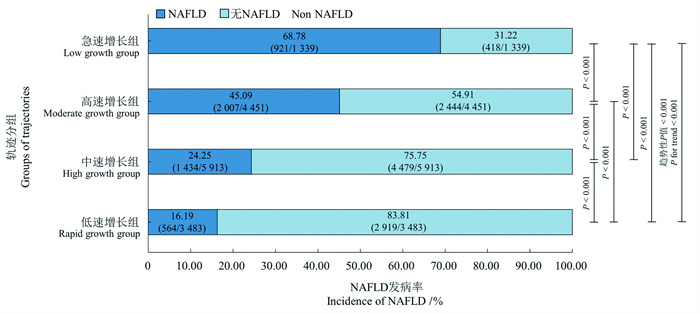
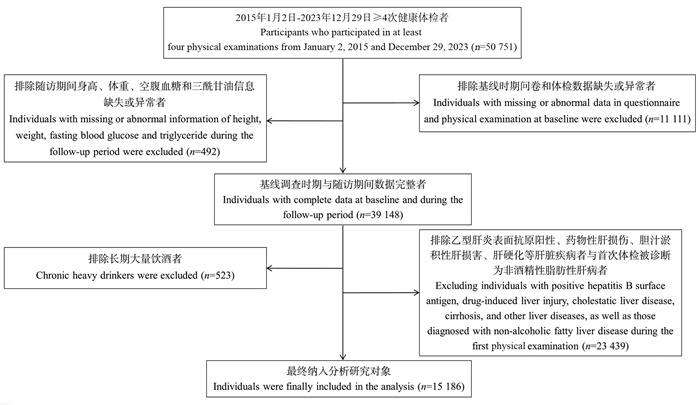
目的 探讨煤矿工人三酰甘油葡萄糖-体质量指数(triglyceride glucose-body mass index, TyG-BMI)变化轨迹与新发非酒精性脂肪性肝病(non-alcoholic fatty liver disease, NAFLD)的关联。 方法 作为回顾性队列研究,连续选取2015年1月2日―2023年12月29日在山西省某煤矿集团先后参与≥4次健康体检的15 186名职业人群作为研究对象,收集其人口学信息、人体测量数据和生化指标等信息。采用群组化轨迹模型构建4个不同的TyG-BMI轨迹组,采用Log-rank比较各轨迹组间NAFLD累积风险的差异,采用Cox比例风险回归模型分析TyG-BMI各轨迹与NAFLD发病风险的相关性。 结果 在(5.56±1.96)年随访期间,总人群NAFLD的累积发病率为32.44%。TyG-BMI低速增长组、中速增长组、高速增长组和急速增长组人群NAFLD的累积发病率分别为16.19%、24.25%、45.09%和68.78%,差异均有统计学意义(均P<0.001)。与低速增长组相比,中速增长组、高速增长组和急速增长组的NAFLD风险分别增加了0.435(HR=1.435, 95% CI:1.299~1.584)、1.895倍(HR=2.895, 95% CI:2.621~3.197)和4.451倍(HR=5.451, 95% CI:4.849~6.127)(均P<0.001)。亚组分析中,在年龄<40岁、文员和无高血压的TyG-BMI水平急速增长人群中观察到更高的NAFLD风险。 结论 TyG-BMI轨迹水平升高与NAFLD的发病风险呈正相关,TyG-BMI水平急速上升可能是NAFLD发生的危险因素。长期监测TyG-BMI水平,并对急速增长的人群进行及时干预,对早期预防NAFLD具有积极作用。 -
关键词:
- 三酰甘油葡萄糖-体质量指数 /
- 非酒精性脂肪性肝病 /
- 轨迹 /
- 回顾性队列研究 /
- 煤矿工人
Abstract:Objective To explore the association between the trajectory of triglyceride glucose-body mass index (TyG-BMI) variations and the incidence of non-alcoholic fatty liver disease (NAFLD) in the coal miners. Methods We conducted a retrospective cohort study of 15 186 coal miners from Shanxi, China, who underwent at least four health check-ups between January 2, 2015 and December 29, 2023. The demographic, anthropometric, and biochemical data were collected. The group-based trajectory model was employed to identify four distinct TyG-BMI trajectory groups. The cumulative incidence of NAFLD across trajectory groups was compared using the Log-rank test, and Cox proportional hazards regression models were used to assess the association between TyG-BMI trajectories and NAFLD risk, adjusting for potential confounders. Results During the follow-up period of (5.56±1.96) years, the cumulative incidence of NAFLD in the overall population was 32.44%. The cumulative incidence of NAFLD in the low growth, moderate growth, high growth, and rapid growth TyG-BMI trajectory groups was 16.19%, 24.25%, 45.09%, and 68.78%, respectively, with significant statistical differences (all P < 0.001). Compared with the low growth group, the NAFLD risk in the moderate growth rate, high growth rate, and rapid growth rate groups increased by 0.435 times (HR=1.435, 95% CI: 1.299-1.584), 1.895 times (HR=2.895, 95% CI: 2.621-3.197), and 4.451 times (HR=5.451, 95% CI: 4.849-6.127), respectively (all P < 0.001). Subgroup analyses revealed a heightened risk of NAFLD among individuals under 40 years old, clerical staff, and those without hypertension exhibited rapid increases in TyG-BMI levels. Conclusions The trajectory of TyG-BMI levels is positively correlated with the risk of NAFLD, and a rapid increase in TyG-BMI serving as a significant risk factor for the disease′s onset. Continuous monitoring of TyG-BMI levels and timely interventions for individuals experiencing rapid increases may facilitate early prevention of NAFLD. -

图 2 2015年1月2日―2023年12月29日TyG-BMI轨迹分组
TyG-BMI:三酰甘油葡萄糖-体质量指数。
Figure 2. TyG-BMI trajectory groups during from January 2, 2015 and December 29, 2023
TyG-BMI: triglyceride glucose-body mass index.

图 3 不同TyG-BMI轨迹组NAFLD发生率
TyG-BMI:三酰甘油葡萄糖-体质量指数;NAFLD:非酒精性脂肪性肝病。
Figure 3. Incidence of NAFLD among different TyG-BMI trajectory groups
TyG-BMI: triglyceride glucose-body mass index; NAFLD: non-alcoholic fatty liver disease.
表 1 不同TyG-BMI轨迹组研究对象的基线特征
Table 1. Baseline characteristics of participants among different TyG-BMI trajectory groups
变量Variable 总人群Total population① (n=15 186) 低速增长组Low growth group① (n=3 483) 中速增长组Moderate growth group① (n=5 913) 高速增长组High growth group① (n=4 451) 急速增长组Rapid growth group① (n=1 339) F/χ2/H值value P值value 一般特征General characteristics 年龄/岁Age/years 40.00(29.00, 44.00) 39.00(31.00, 45.00) 37.00(30.00, 45.00) 33.00(28.00, 43.00) 31.00(27.00, 41.00) 457.760 <0.001② 工龄/年Length of service/year 11.00(7.00, 21.00) 12.00(8.00, 23.00) 11.00(7.00, 21.00) 9.00(6.00, 19.00) 9.00(5.00, 16.00) 216.500 <0.001② 性别Gender 190.840 <0.001③ 女Female 1 077(7.09) 399(11.46) 449(7.59) 186(4.18) 43(3.21) 男Male 14 109(92.91) 3 084(88.54) 5 464(92.41) 4 265(95.82) 1 296(96.79) 工种Job category 1.885 0.930③ 文员Clerical staff 1 466(9.65) 345(9.91) 569(9.62) 429(9.64) 123(9.19) 其他工种Other job categories 3 340(21.99) 780(22.39) 1 287(21.77) 967(21.73) 306(22.85) 特种作业Special occupations 10 380(68.35) 2 358(67.70) 4 057(68.61) 3 055(68.64) 910(67.96) 吸烟Smoking 31.709 <0.001③ 否No 5 870(38.65) 1 239(35.57) 2 377(40.20) 1 786(40.13) 468(34.95) 是Yes 9 316(61.35) 2 244(64.43) 3 536(59.80) 2 665(59.87) 871(65.05) 饮酒Drinking 20.717 <0.001③ 否No 7 249(47.73) 1 707(49.01) 2 911(49.23) 2 038(45.79) 593(44.29) 是Yes 7 937(52.27) 1 776(50.99) 3 002(50.77) 2 413(54.21) 746(55.71) 基础疾病Pre-existing conditions 贫血Anaemia 50.931 <0.001③ 无No 14 918(98.24) 3 379(97.01) 5 806(98.19) 4 404(98.94) 1 329(99.25) 有Yes 268(1.76) 104(2.99) 107(1.81) 47(1.06) 10(0.75) 高尿酸血症Hyperuricemia 554.272 <0.001③ 无No 13 106(86.30) 3 268(93.83) 5 274(89.19) 3 602(80.93) 962(71.84) 有Yes 2 080(13.70) 215(6.17) 639(10.81) 849(19.07) 377(28.16) 高血压Hypertension 135.940 <0.001③ 无No 12 232(80.55) 2 971(85.30) 4 823(81.57) 3 476(78.09) 962(71.84) 有Yes 2 954(19.45) 512(14.70) 1 090(18.43) 975(21.91) 377(28.16) 体检数据Physical examination data TC/(mmol·L-1) 4.13±0.84 3.97±0.75 4.10±0.81 4.22±0.85 4.40±0.98 301.361 <0.001④ HDL-C/(mmol·L-1) 1.29±0.28 1.40±0.30 1.31±0.28 1.23±0.25 1.16±0.25 1 078.409 <0.001④ 体检数据Physical examination data LDL-C/(mmol·L-1) 2.46±0.72 2.29±0.65 2.44±0.69 2.55±0.73 2.66±0.83 377.384 <0.001④ HGB/(g·L-1) 154.00(147.00, 161.00) 152.00(144.00, 158.00) 154.00(147.00, 160.00) 156.00(149.00, 162.00) 157.00(150.00, 164.00) 457.924 <0.001② PLT/(109·L-1) 209.90±46.88 206.41±47.16 208.34±46.35 212.38±46.65 217.60±48.02 231.784 <0.001⑤ WBC/(109·L-1) 6.08±1.49 5.77±1.48 6.02±1.47 6.24±1.46 6.62±1.50 132.392 <0.001⑤ SUA/(μmol·L-1) 329.52±81.82 298.05±73.24 321.99±75.98 350.09±81.67 376.19±88.88 1 266.084 <0.001④ SCr/(μmol·L-1) 73.93±14.49 72.12±14.14 73.54±14.14 75.40±15.02 75.48±14.55 40.304 <0.001⑤ eGFR/[mL·(min·1.73 m2)-1] 109.80±14.66 109.42±13.98 109.69±14.42 109.84±15.15 111.12±15.71 16.720 <0.001④ SBP/mmHg 120.96±15.26 117.37±15.05 120.69±14.97 122.56±15.01 126.23±15.65 436.372 <0.001④ DBP/mmHg 79.18±11.66 77.07±11.11 78.91±11.41 80.33±11.82 82.09±12.53 231.784 <0.001④ 注:TyG-BMI,三酰甘油葡萄糖-体质量指数;TC,总胆固醇;HDL-C,高密度脂蛋白胆固醇;LDL-C,低密度脂蛋白胆固醇;HGB,血红蛋白;PLT,血小板计数;WBC,白细胞计数;SUA,血清尿酸;SCr,血清肌酐;eGFR,估算肾小球过滤率;SBP,收缩压;DBP,舒张压。
①以人数(占比/%)或x±s或M(P25, P75)表示;②采用Kruskal-Wallis检验;③采用χ2检验;④变量不满足方差齐性假设,采用Kruskal-Wallis检验;⑤采用单因素方差分析。
Note:TyG-BMI, triglyceride glucose-body mass index; TC, total cholesterol; HDL-C, high-density lipoprotein cholesterol; LDL-C, low-density lipoprotein cholesterol; HGB, hemoglobin; PLT, platelet count; WBC, white blood cell count; SUA, serum uric acid; SCr, serum creatinine; eGFR, estimate glomerular filtration rate; SBP, systolic blood pressure; DBP, diastolic blood pressure.
① Number of people (proportion/%) or x±s or M(P25, P75); ② The Kruskal-Wallis test was used; ③ The χ2 test was used; ④ As the variable did not meet the assumption of homogeneity of variance, the Kruskal-Wallis test was used; ⑤ One-way analysis of variance (ANOVA) was used. 下载: 导出CSV
表 2 TyG-BMI轨迹与NAFLD风险的关系
Table 2. Relationship between TyG-BMI trajectory and NAFLD risk
模型Model β值value sx Wald χ2值value HR值value(95% CI) P值value 模型1 Model 1 低速增长组Low growth group 1.000 中速增长组Moderate growth group 0.437 0.050 77.331 1.548(1.404~1.707) < 0.001 高速增长组High growth group 1.203 0.048 636.778 3.331(3.034~3.657) < 0.001 急速增长组Rapid growth group 1.894 0.054 1 247.437 6.648(5.985~7.385) < 0.001 模型2 Model 2 低速增长组Low growth group 1.000 中速增长组Moderate growth group 0.361 0.050 51.077 1.435(1.299~1.584) < 0.001 高速增长组High growth group 1.063 0.051 440.962 2.895(2.621~3.197) < 0.001 急速增长组Rapid growth group 1.696 0.060 806.782 5.451(4.849~6.127) < 0.001 注:TyG-BMI,三酰甘油葡萄糖-体质量指数;NAFLD,非酒精性脂肪性肝病。
模型1未经调整;模型2在模型1的基础上调整了年龄、工龄、性别、工种、吸烟、饮酒、总胆固醇、高密度脂蛋白胆固醇、低密度脂蛋白胆固醇、血红蛋白、血小板计数、白细胞计数、血清尿酸、血清肌酐、估算肾小球过滤率、收缩压和舒张压进行调整。
Note: TyG-BMI, triglyceride glucose-body mass index; NAFLD, non-alcoholic fatty liver disease.
Model 1 unadjusted; Model 2 adjusting for age, length of service, gender, job category, smoking, drinking, total cholesterol, high-density lipoprotein cholesterol, low-density lipoprotein cholesterol, hemoglobin, platelet count, white blood cell count, serum uric acid, serum creatinine, estimate glomerular filtration rate, systolic blood pressure, diastolic blood pressure.
下载: 导出CSV
表 3 TyG-BMI轨迹与NAFLD风险关联的亚组分析
Table 3. Subgroup analyses for the association between TyG-BMI trajectories and NALFD risk
变量Variable 低速增长组Low growth group 中速增长组Moderate growth group① 高速增长组High growth group① 急速增长组Rapid growth group① P趋势值Ptrend value P交互值Pinteraction value 性别Gender 0.408 男Male(n=14 109) 1.000 1.457(1.315~1.613) 2.880(2.600~3.192) 5.383(4.771~6.075) < 0.001 女Female(n=1 077) 1.000 1.440(1.045~1.985) 4.366(3.032~6.285) ― < 0.001 年龄组/岁Age group/years < 0.001 < 40(n=9 097) 1.000 1.881(1.635~2.165) 4.381(3.805~5.044) 8.627(7.328~10.155) < 0.001 ≥40(n=6 089) 1.000 1.141(0.976~1.332) 1.762(1.509~2.058) 3.034(2.531~3.636) < 0.001 工种Job category 0.478 文员Clerical staff(n=1 466) 1.000 1.619(1.204~2.176) 3.009(2.210~4.096) 6.229(4.288~9.047) < 0.001 其他工种Other job categories(n=3 340) 1.000 1.284(1.040~1.584) 2.638(2.139~3.255) 5.884(4.599~7.527) < 0.001 特种作业Special occupations(n=10 380) 1.000 1.425(1.263,1.606) 2.864(2.539~3.231) 5.236(4.543~6.034) < 0.001 高血压Hypertension 0.010 无No(n=12 232) 1.000 3.062(2.744~3.418) 1.468(1.315~1.638) 5.749(5.048~6.544) < 0.001 有Yes(n=2 954) 1.000 1.202(0.959~1.506) 2.049(1.641~2.558) 4.135(3.215~5.319) < 0.001 LDL-C/(mmol·L-1) 0.182 < 3.6(n=14 379) 1.000 1.379(1.245~1.528) 2.771(2.501~3.070) 5.395(4.785~6.082) < 0.001 ≥3.6(n=807) 1.000 1.880(1.261~2.802) 3.099(2.068~4.644) 5.066(3.192~8.040) < 0.001 注:TyG-BMI,三酰甘油葡萄糖-体质量指数;NAFLD,非酒精性脂肪性肝病;LDL-C,低密度脂蛋白胆固醇;“―”为按性别分层后女性急速增长组人数不足5%,因此仅对女性低速增长组、中速增长组和高速增长组人群进行分析;所有分析均调整了年龄、工龄、性别、工种、吸烟、饮酒、总胆固醇、高密度脂蛋白胆固醇、低密度脂蛋白胆固醇、血红蛋白、血小板计数、白细胞计数、血清尿酸、血清肌酐、估算肾小球过滤率、收缩压和舒张压。
①以HR值(95% CI)表示。
Note: TyG-BMI, triglyceride glucose-body mass index; NAFLD, non-alcoholic fatty liver disease; LDL-C, low density lipoprotein cholestero; "―" due to the proportion of females in the rapid growth group being less than 5% after stratification by gender, analysis was conducted only in females in the low growth, moderate growth, and high growth groups; All analyses were adjusted for age, length of service, gender, job category, smoking, drinking, total cholesterol, high-density lipoprotein cholesterol, low-density lipoprotein cholesterol, hemoglobin, platelet count, white blood cell count, serum uric acid, serum creatinine, estimate glomerular filtration rate, systolic blood pressure, diastolic blood pressure.
① HR value(95% CI).
下载: 导出CSV
-
[1] Loomba R, Friedman SL, Shulman GI. Mechanisms and disease consequences of nonalcoholic fatty liver disease [J]. Cell, 2021, 184(10): 2537-2564. DOI: 10.1016/j.cell.2021.04.015. [2] Bilson J, Sethi JK, Byrne CD. Non-alcoholic fatty liver disease: a multi-system disease influenced by ageing and sex, and affected by adipose tissue and intestinal function [J]. Proc Nutr Soc, 2022, 81(2): 146-161. DOI: 10.1017/S0029665121003815. [3] Younossi ZM, Golabi P, Paik JM, et al. The global epidemiology of nonalcoholic fatty liver disease (NAFLD) and nonalcoholic steatohepatitis (NASH): a systematic review [J]. Hepatology, 2023, 77(4): 1335-1347. DOI: 10.1097/HEP.0000000000000004. [4] Xue R, Yang RX, Fan JG. Epidemiological trends and clinical characteristic of NAFLD/MAFLD in Asia [J]. J Dig Dis, 2022, 23(7): 354-357. DOI: 10.1111/1751-2980.13117. [5] Kim K, Lee YJ, Kwon SC, et al. Correlation between shift work and non-alcoholic fatty liver disease among male workers in the steel manufacturing company of Korea: a cross-sectional study [J]. Ann Occup Environ Med, 2022, 34: e33. DOI: 10.35371/aoem.2022.34.e33. [6] Tang FC, Li RH, Huang JH. Unraveling the connection between fatty liver severity with gender, lifestyle, and health risks among workers [J]. Nutrients, 2023, 15(22): 4765. DOI: 10.3390/nu15224765. [7] Zhang ZL, Zhao L, Lu YT, et al. Association between non-insulin-based insulin resistance indices and cardiovascular events in patients undergoing percutaneous coronary intervention: a retrospective study [J]. Cardiovasc Diabetol, 2023, 22(1): 161. DOI: 10.1186/s12933-023-01898-1. [8] Fritz J, Bjørge T, Nagel G, et al. The triglyceride-glucose index as a measure of insulin resistance and risk of obesity-related cancers [J]. Int J Epidemiol, 2020, 49(1): 193-204. DOI: 10.1093/ije/dyz053. [9] Sheng GT, Lu S, Xie QY et al. The usefulness of obesity and lipid-related indices to predict the presence of non-alcoholic fatty liver disease [J]. Lipids Health Dis, 2021, 20(1): 134. DOI: 10.1186/s12944-021-01561-2. [10] Lu S, Robyak K, Zhu YS. The CKD-EPI 2021 equation and other creatinine-based race-independent eGFR equations in chronic kidney disease diagnosis and staging [J]. J Appl Lab Med, 2023, 8(5): 952-961. DOI: 10.1093/jalm/jfad047. [11] 中华医学会肝病学分会脂肪肝和酒精性肝病学组, 中国医师协会脂肪性肝病专家委员会. 非酒精性脂肪性肝病防治指南(2018更新版) [J]. 中华肝脏病杂志, 2018, 26(3): 195-203. DOI: 10.3760/cma.j.issn.1007-3418.2018.03.008.National Workshop on Fatty Liver and Alcoholic Liver Disease, Chinese Society of Hepatology, Chinese Medical Association; Fatty Liver Expert Committee, Chinese Medical Doctor Association. Guidelines of prevention and treatment for nonalcoholic fatty liver disease: a 2018 update [J]. Chin J Hepatol, 2018, 26(3): 195-203. DOI: 10.3760/cma.j.issn.1007-3418.2018.03.008. [12] Nagin DS, Odgers CL. Group-based trajectory modeling in clinical research [J]. Annu Rev Clin Psychol, 2010, 6: 109-138. DOI: 10.1146/annurev.clinpsy.121208.131413. [13] Li GR, Peng YY, Chen Z, et al. Bidirectional association between hypertension and NAFLD: a systematic review and Meta-analysis of observational studies [J]. Int J Endocrinol, 2022, 2022: 8463640. DOI: 10.1155/2022/8463640. [14] Huang HK, Xie JR, Hou LX, et al. Estimated small dense low-density lipoprotein cholesterol and nonalcoholic fatty liver disease in nonobese populations [J]. J Diabetes Investig, 2024, 15(4): 491-499. DOI: 10.1111/jdi.14133. [15] Liu HS, Chen JF, Qin Q, et al. Association between TyG index trajectory and new-onset lean NAFLD: a longitudinal study [J]. Front Endocrinol, 2024, 15: 1321922. DOI: 10.3389/fendo.2024.1321922. [16] Boccardi V, Mancinetti F, Baroni M, et al. Metabolic score for insulin resistance (METS-IR) and circulating cytokines in older persons: the role of gender and body mass index [J]. Nutrients, 2022, 14(15): 3228. DOI: 10.3390/nu14153228. [17] Guo YB, Yang J, Ma RL, et al. Metabolic dysfunction-associated fatty liver disease is associated with the risk of incident cardiovascular disease: a prospective cohort study in Xinjiang [J]. Nutrients, 2022, 14(12): 2361. DOI: 10.3390/nu14122361. [18] Cho JY, Sohn W. Synergistic preventive effect of aerobic and resistance exercises on nonalcoholic fatty liver disease [J]. Gut Liver, 2023, 17(4): 487-488. DOI: 10.5009/gnl230232. -

 点击查看大图
计量
- 文章访问数: 2
- HTML全文浏览量: 2
- PDF下载量: 1
- 被引次数: 0