

The association between air quality index of air pollutants and influenza pandemic risk in 48 countries/regions from 2014 to 2019
-
摘要:
目的 采用两阶段时间序列分析方法评估2014–2019年48个国家/地区的周均空气污染物空气质量指数(air quality index, AQI)与周累计流行性感冒(简称流感)病例数的关联。 方法 纳入48个国家/地区的2014–2019年的空气污染物AQI数据和流感监测数据,在校正气温、降水量、季节性和国家/地区人口密度等潜在混杂因素的基础上,分析空气污染物AQI与流感病例的关联。在第1阶段建立每个国家/地区的关联模型,在第2阶段荟萃五大洲和气候带分区的合并风险。 结果 48个国家/地区周累计流感病例与气温、降水量和臭氧(zone, O3)的AQI呈反比,而与细颗粒物(fine particles, PM2.5)、可吸入颗粒物(inhalable particles, PM10)、二氧化硫、二氧化氮和一氧化碳的AQI波动趋势大体呈反比。亚组分层中,在滞后1周内,空气污染物AQI每增加10个单位,PM2.5与北美地区(RR=1.010 4, 95% CI: 1.004 7~1.016 1)和热带干旱带温带(ABC)地区(RR=1.027 9, 95% CI: 1.005 6~1.050 6)的流感传播风险升高有关;PM10与热带干旱带温带(ABC)地区的流感传播风险(RR=1.018 3, 95% CI: 1.003 7~1.033 1)升高有关;O3与亚洲(RR=0.957 5, 95% CI: 0.917 1~0.999 7)和欧洲(RR=0.887 0,95% CI: 0.854 1~0.921 2)的流感传播风险降低有关,并与热带(A)、热带干旱带温带3种组合(ABC)、温带(C)和寒带(D)地区的流感传播风险分别降低4.25%、7.79%、12.12%、7.88%有关。 结论 PM2.5、PM10的AQI与欧洲和亚洲及其气候带地区的流感传播风险上升有关,而O3的AQI为流感的保护因素。 Abstract:Objective To evaluate the short-term association between weekly average air quality index (AQI) of air pollutants and weekly cumulative influenza cases across 48 countries/regions using a two-stage time-series analysis. Methods Data on air pollutant air quality index(AQI) and influenza surveillance from 48 countries/regions between 2014 and 2019 were analyzed. After adjusting for temperature, precipitation, seasonality, and national population density, the association between AQI and influenza cases was assessed. Country-specific time-series regression models were established in the first stage, followed by a meta-analysis stratified by continents and climate zones in the second stage to pool relative risks. Results Cumulative weekly influenza cases in 48 countries/regions was inversely associated with AQIs for temperature, precipitation and ozone (O3), and inversely associated with temperature, precipitation and ozone (O3) AQI and the fluctuation trends of AQI for fine particles (PM2.5), inhalable particles (PM10), sulfur dioxide (SO2), nitrogen dioxide (NO2) and carbon monoxide (CO) were also roughly inversely proportional. In subgroup analyses, for each10-unit increase in pollutant AQI within a 1-week lag, PM2.5 increased the risk of influenza in North America (RR=1.010 4, 95% CI: 1.004 7-1.016 1) and the three combinations of tropical arid temperate (ABC) (RR=1.027 9, 95% CI: 1.005 6-1.050 6); PM10 increased the risk of influenza in the 3 combinations of tropical arid temperate (ABC) zones (RR=1.018 3, 95% CI: 1.003 7-1.033 1); O3 reduced the risk of influenza in Asia (RR=0.957 5, 95% CI: 0.917 1-0.999 7) and Europe (RR=0.887 0, 95% CI: 0.854 1-0.921 2), and reduced the risk of influenza epidemics in tropical (A), arid temperate cold zone 3 combination (ABC), temperate (C), and cold (D) zones by 4.25%, 7.79%, 12.12%, and 7.88%, respectively. Conclusions PM2.5 AQI and PM10 AQI may elevate influenza risks in Europe, Asia and their respective climate zones, while O3 AQI acts as a protective factor against influenza. -
Key words:
- Influenza /
- Air pollutants /
- Air quality index /
- Generalized linear model
-

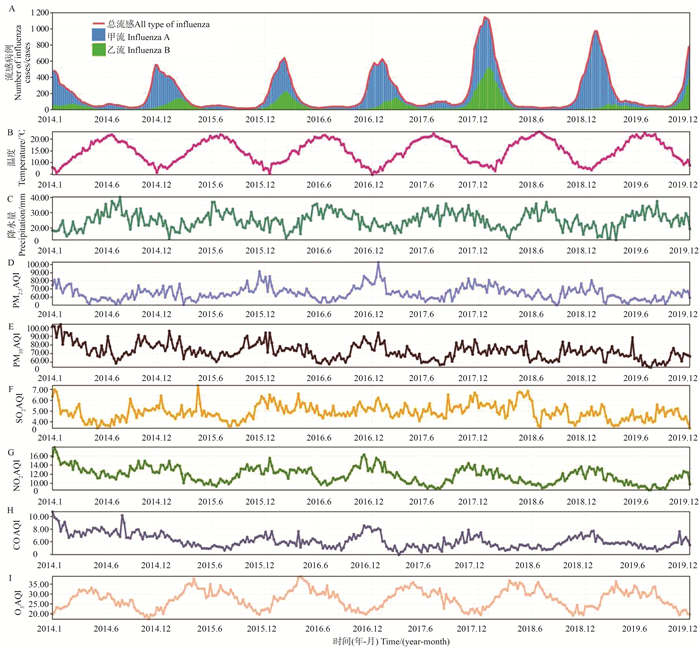
图 1 周均流行性感冒病例数与气象因素、空气污染物AQI的时序图
PM2.5:细颗粒物;PM10:可吸入颗粒物;SO2:二氧化硫;NO2:二氧化氮;CO:一氧化碳;O3:臭氧; AQI,空气质量指数。
Figure 1. Time series plot of weekly mean influenza cases and meteorological factors, air pollutant AQIs
PM2.5: fine particles; PM10: inhalable particles; SO2: sulfur dioxide; NO2: nitrogen dioxide; CO: carbon monoxide; O3: ozone; AQI: air quality index.

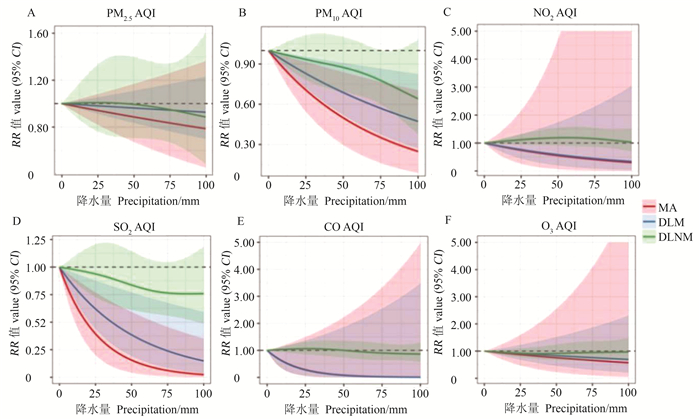
图 2 3种模型拟合的空气污染物AQI与流行性感冒传播风险的暴露-反应曲线
PM2.5:细颗粒物;PM10:可吸入颗粒物;SO2:二氧化硫;NO2:二氧化氮;CO:一氧化碳;O3:臭氧;AQI:空气质量指数;MA:移动平均模型;DLM:分布滞后线性模型;DLNM:分布滞后非线性模型。
Figure 2. Exposure-response curves of air pollutant AQI and influenza risk fitted by three models
PM2.5: fine particles; PM10: inhalable particles; SO2: sulfur dioxide; NO2: nitrogen dioxide; CO: carbon monoxide; O3: ozone; AQI: air quality index; MA: moving average model; DLM: distributed lag linear model; DLNM: distributed lag nonlinear model.
表 1 空气污染物的浓度与AQI的详细数量转化
Table 1. Detailed quantitative transformations of air pollutant concentrations to the AQI
O3/ppm
8 h①PM2.5/(μg·m-3)
24 h①PM10/(μg·m-3)
24 h①CO/ppm
8 h①SO2/ppb
1 h①NO2/ppb
1 h①AQI范围
AQI scope①危害水平
Hazard level0.000~0.054 0.0~12.0 0~54 0.0~4.4 0~35 0~53 0~50 良好Good 0.055~0.070 12.1~35.4 55~154 4.5~9.4 36~75 54~100 51~100 轻度Mild 0.071~0.085 35.5~55.4 155~254 9.5~12.4 76~185 101~360 101~150 对敏感人群不利Unhealthy for sensitive groups 0.086~0.105 (55.5~150.4)3 255~354 12.5~15.4 (186~304)3 361~649 151~200 不健康Unhealthy 0.106~0.200 (150.5~250.4)3 355~424 15.5~30.4 (305~604)4 650~1 249 201~300 非常不健康Very unhealthy (250.5~500.4)3 425~604 30.5~50.4 (605~1 004)4 1 250~2 049 301~500 严重危害Hazardous 注:PM2.5, 细颗粒物; PM10, 可吸入颗粒物; SO2, 二氧化硫; NO2, 二氧化氮;CO, 一氧化碳; O3, 臭氧; AQI, 空气质量指数。
Note: PM2.5, fine particles; PM10, inhalable particles; SO2, sulfur dioxide; NO2, nitrogen dioxide; CO, carbon monoxide; O3, ozone; AQI, air quality index. 下载: 导出CSV
表 2 2014–2019年48个国家/地区的流行性感冒病例数与气象因素、空气污染物的AQI基线情况
Table 2. Influenza cases and meteorological factors, air pollutant AQI baseline descriptors for 48 countries/regions, 2014-2019
国家/地区
Country/regions总病例数
All cases流行性感冒病例
Influenza cases①气温
Temperature/℃②累计降水量
Precipitation/mm②合计Total 2 713 733 4(0, 24) 14.33±10.13 24.70±24.83 亚洲Asia 印度India 21 674 4(1, 16) 26.44±3.76 58.90±33.40 以色列Israel 8 560 6(1, 33) 17.28±4.41 8.70±16.33 日本Japan 53 293 18(3, 97) 15.06±7.61 36.00±23.77 科威特Kuwait 12 139 12(3, 54) 27.33±9.38 9.90±13.09 中国大陆Chinese mainland 398 979 304(68, 1 061) 11.77±9.56 40.80±16.42 菲律宾Philippines 1 870 1(0, 5) 27.04±1.20 67.20±42.42 韩国Korea 10 282 2(0, 23) 14.01±8.89 53.70±43.40 新加坡Singapore 6 185 6(2, 13) 28.17±0.90 31.40±36.71 泰国Thailand 5 921 9(1, 28) 28.03±1.76 60.70±27.18 土耳其Türkiye 16 367 6(1, 16) 11.51±6.86 16.80±11.38 越南Vietnam 3 227 4(1, 9) 25.63±3.32 37.80±32.79 欧洲Europe 奥地利Austria 17 367 4(0, 52) 2.20±4.52 18.70±14.81 比利时Belgium 2 078 0(0, 1) 10.56±5.48 15.60±13.72 保加利亚Bulgaria 1 631 0(0, 0) 13.35±8.10 11.90±13.34 克罗地亚Croatia 12 337 3(0, 26) 9.54±5.26 21.90±19.91 捷克Czech Republic 2 486 1(0, 10) 4.56±5.29 17.20±23.36 丹麦Denmark 35 167 3(1, 21) 9.05±5.19 15.40±10.82 芬兰Finland 1 034 0(0, 2) 4.17±8.58 12.20±8.63 法国France 103 196 18(4, 276) 9.29±3.71 16.10±10.81 德国Germany 8 365 0(0, 5) 10.87±6.93 14.00±9.74 匈牙利Hungary 3 268 0(0, 7) 7.13±5.86 10.20±10.45 意大利Italy 21 019 19(2, 101) 8.95±3.19 14.30±12.38 立陶宛Lithuania 5 061 0(0, 4) 8.01±7.91 15.00±12.75 卢森堡Luxembourg 1 601 0(0, 9) 6.28±4.60 14.20±14.64 马耳他Malta 2 714 0(0, 3) 18.49±5.23 10.60±17.36 荷兰Netherlands 18 618 2(0, 13) 11.07±5.63 15.90±13.41 挪威Norway 115 289 21(3, 191) 4.93±6.09 25.10±15.06 波兰Poland 9 648 0(0, 2) 9.59±7.60 11.70±9.29 葡萄牙Portugal 17 105 1(0, 19) 16.49±3.45 22.90±16.73 罗马尼亚Romania 6 786 0(0, 12) 9.60±8.06 11.80±11.04 俄罗斯Russia 81 625 10(1, 83) 2.41±11.94 10.90±4.67 塞尔维亚Serbia 3 690 0(0, 6) 11.38±7.97 12.50±13.37 斯洛伐克Slovakia 1 975 0(0, 1) 10.58±8.16 14.40±11.86 斯洛文尼亚Slovenia 16 716 1(0, 21) 6.31±6.94 27.10±26.48 瑞典Sweden 63 365 7(2, 67) 6.29±7.31 12.40±8.08 瑞士Switzerland 47 419 18(2, 157) 3.93±4.17 25.00±21.37 英国Britain 136 093 27(4, 173) 9.95±4.08 18.90±11.16 北美洲North America 加拿大Canada 268 427 63(10, 324) 2.57±11.07 16.90±5.45 萨尔瓦多El Salvador 1 061 0(0, 1) 27.43±1.02 44.20±24.55 墨西哥Mexico 37 280 17(5, 45) 22.83±2.93 14.40±13.69 美国America 1 031 862 315(133, 1 271) 8.84±7.49 21.10±7.40 大洋洲Oceania 澳大利亚Australia 42 557 15(5, 55) 19.21±4.13 12.80±8.08 南美洲South America 玻利维亚Bolivia 4 488 1(0, 7) 23.92±2.34 54.40±25.71 巴西Brazil 21 890 15(7, 30) 25.04±1.61 48.90±21.41 智利Chile 21 698 11(3, 35) 14.03±3.36 10.20±10.55 哥伦比亚Colombia 4 912 4(1, 11) 25.33±0.65 35.10±16.51 厄尔瓜多Ecuador 2 594 1(0, 4) 22.48±1.78 49.70±24.80 秘鲁Peru 2 814 1(0, 5) 22.18±1.14 45.70±22.20 合计Total 65.31±45.61 31.48±31.31 4.93±5.25 11.95±7.14 6.16±5.67 27.36±17.67 亚洲Asia 印度India 186.96±65.24 163.86±82.33 9.57±4.88 30.66±11.93 13.40±6.44 37.13±20.48 以色列Israel 69.42±13.34 45.61±24.21 2.36±1.42 21.05±4.32 3.63±2.54 35.43±7.92 日本Japan 49.75±9.50 16.84±4.33 3.74±0.73 9.46±2.49 3.03±0.76 33.78±8.70 科威特Kuwait 117.91±25.66 – – – – – 中国大陆Chinese mainland 116.64±25.53 66.75±18.26 11.79±6.04 16.62±4.49 14.19±12.09 42.21±13.61 菲律宾Philippines 59.67±24.61 20.37±8.59 1.28±0.48 6.79±3.06 – 25.34±8.55 韩国Korea 71.80±17.23 37.03±10.72 6.21±1.40 22.87±6.01 5.72±1.14 31.83±11.78 新加坡Singapore 56.65±19.20 27.12±9.33 5.51±2.70 10.94±3.37 4.47±1.51 17.09±4.87 泰国Thailand 85.15±24.53 43.78±13.62 3.21±2.49 10.64±4.73 7.82±2.51 20.92±11.15 土耳其Türkiye 107.10±60.69 43.89±13.40 8.59±7.59 12.57±7.01 6.74±4.17 22.10±6.01 越南Vietnam 74.65±30.80 24.96±23.68 16.13±11.31 13.91±5.15 14.81±7.98 44.57±28.89 欧洲Europe 奥地利Austria 57.87±21.79 21.30±8.89 2.30±0.91 12.72±2.81 – – 比利时Belgium 38.34±16.89 14.47±6.11 1.01±0.06 5.80±2.22 – 26.80±8.21 保加利亚Bulgaria 79.58±33.47 28.11±15.78 7.37±1.60 11.01±5.38 – 25.01±10.11 克罗地亚Croatia 62.80±20.25 19.66±6.50 4.17±1.58 8.16±3.06 – 24.17±8.63 捷克Czech Republic 64.07±23.33 23.92±9.90 3.51±1.17 8.84±2.60 – 24.38±8.55 丹麦Denmark 41.02±14.02 18.48±4.97 1.24±0.39 9.35±2.55 1.61±0.46 26.49±6.65 芬兰Finland 24.38±7.82 10.25±3.91 1.63±1.06 5.87±1.63 – 25.65±5.54 法国France 48.00±13.70 18.63±5.43 – 10.61±3.08 – 24.96±9.17 德国Germany 49.31±18.33 17.79±8.97 7.33±6.37 8.50±4.70 1.68±0.72 27.70±11.58 匈牙利Hungary 60.70±22.27 23.37±9.55 3.07±1.14 7.03±1.84 4.61±1.55 21.93±7.77 意大利Italy 76.59±22.60 30.83±9.72 1.40±0.63 25.73±5.15 – 16.68±8.52 立陶宛Lithuania 53.55±18.70 29.14±8.22 1.58±1.37 – – 21.41±6.93 卢森堡Luxembourg 44.40±14.51 18.22±4.92 1.15±0.36 10.26±2.08 2.27±0.61 21.52±8.40 马耳他Malta 44.44±13.49 28.72±28.70 1.81±2.76 7.39±4.01 – 31.80±8.16 荷兰Netherlands 46.68±17.29 20.02±6.19 1.12±0.29 13.30±4.03 2.08±0.68 24.60±9.86 挪威Norway 30.26±9.81 16.59±7.27 1.68±3.82 12.33±4.90 – 24.36±6.08 波兰Poland 70.94±27.20 30.09±13.58 3.13±1.88 13.79±3.54 4.78±2.05 27.81±10.83 葡萄牙Portugal 35.60±26.02 17.78±5.31 5.40±4.80 3.79±1.60 – 29.62±5.26 罗马尼亚Romania 100.88±60.42 22.52±11.45 2.78±0.76 12.34±5.53 – 26.96±9.11 俄罗斯Russia 43.97±13.88 22.21±9.34 1.80±0.91 14.77±4.10 3.03±1.06 21.69±11.79 塞尔维亚Serbia 73.28±36.33 28.89±15.83 8.86±4.25 9.63±3.21 8.15±5.14 27.06±9.29 斯洛伐克Slovakia 60.00±22.18 25.01±12.54 2.78±1.92 11.19±3.99 3.92±2.24 – 斯洛文尼亚Slovenia – 27.56±12.55 2.21±1.51 10.00±3.50 – 24.61±10.69 瑞典Sweden 28.27±14.42 17.41±7.72 – 12.13±3.69 – 24.16±6.22 瑞士Switzerland – 8.45±4.13 2.50±2.12 7.14±1.61 – 28.25±5.73 英国Britain 41.56±14.63 17.23±5.21 4.43±4.31 11.53±3.42 – 23.95±6.05 北美洲North America 加拿大Canada 29.61±9.29 14.00±8.22 5.40±2.36 7.62±2.77 2.69±0.81 20.20±4.50 萨尔瓦多El Salvador 79.19±24.37 – – – – – 墨西哥Mexico 78.77±19.71 51.00±13.17 9.11±4.59 16.88±5.03 10.55±4.01 34.54±9.44 美国America 171.45±89.81 27.14±19.14 1.43±2.55 10.50±3.84 3.22±1.13 91.33±38.26 大洋洲Oceania 澳大利亚Australia 29.53±9.20 15.49±4.44 2.75±2.81 4.97±5.39 3.20±3.66 14.37±7.33 南美洲South America 玻利维亚Bolivia – 33.84±10.72 – 9.43±8.30 – 15.72±15.34 巴西Brazil 53.22±13.45 35.43±11.18 5.34±2.23 15.64±3.98 4.31±2.23 25.36±8.20 智利Chile 73.25±24.33 52.48±11.23 5.83±2.00 15.55±6.76 11.53±5.38 20.78±7.44 哥伦比亚Colombia 58.69±18.57 32.97±9.64 1.41±0.90 7.26±2.67 6.35±2.39 8.03±3.26 厄尔瓜多Ecuador 56.66±9.60 32.57±7.59 6.55±3.08 22.05±4.14 6.92±1.32 33.42±7.73 南美洲South America 秘鲁Peru 75.37±17.11 59.45±21.19 11.61±10.62 12.83±7.21 8.95±5.44 11.68±8.73 注:PM2.5, 细颗粒物; PM10, 可吸入颗粒物; SO2, 二氧化硫; NO2, 二氧化氮;CO, 一氧化碳; O3, 臭氧; AQI, 空气质量指数;“–”表示数据无法获取。
①以M(P25, P75)表示;②以x±s表示。
Note: PM2.5, fine particles; PM10, inhalable particles; SO2, sulfur dioxide; NO2, nitrogen dioxide; CO, carbon monoxide; O3, ozone; AQI, air quality index; "–" indicates that the data cannot be obtained.
① M(P25, P75); ② x±s.
下载: 导出CSV
表 3 五大洲空气污染物AQI每增加10个单位对48个国家/地区的流行性感冒传播风险的荟萃风险值和95% CI
Table 3. Regional pooled RR and 95% CIs for influenza risk for 48 countries/regions for each 10-unit increase in air pollutant AQI in five continents
国家/地区
Country/regionsRR值value (95% CI) PM2.5 AQI PM10 AQI SO2 AQI 亚洲Asia 印度India 1.023 2(0.985 9~1.061 9) 1.002 6(0.966 4~1.040 2) 1.009 0(0.498 7~2.041 4) 以色列Israel 0.993 4(0.944 6~1.044 7) 1.002 6(0.966 4~1.040 2) 1.226 3(0.496 1~3.031 3) 日本Japan 1.091 2(1.024 2~1.162 6) 1.002 6(0.966 4~1.040 2) 14.626 4(4.384 1~48.796 9) 科威特Kuwait 1.016 8(0.963 4~1.073 2) – – 中国大陆Chinese mainland 0.968 1(0.930 9~1.006 8) 0.991 2(0.963 9~1.019 4) 1.219 0(0.627 1~2.369 5) 菲律宾Philippines – 0.997 5(0.961 6~1.034 6) – 韩国Republic of Korea 0.973 9(0.930 4~1.019 4) 0.985 5(0.952 3~1.019 8) 0.433 6(0.193 8~0.970 1) 新加坡Singapore 0.989 7(0.944 6~1.036 8) 0.991 2(0.956 9~1.026 7) 0.994 4(0.488 7~2.023 4) 泰国Thailand – 0.994 2(0.959 7~1.029 8) 1.029 0(0.528 9~2.001 9) 土耳其Türkiye – 0.993 1(0.959 7~1.027 6) 0.985 6(0.507 6~1.913 5) 越南Vietnam 1.010 2(0.968 2~1.054 0) 1.006 2(0.975 6~1.037 7) 0.932 3(0.490 6~1.771 9) 合并Pooled 1.007 7(0.976 4~1.039 9) 0.996 5(0.978 3~1.015 1) 1.276 4(0.675 5~2.411 9) 欧洲Europe 奥地利Austria 0.985 6(0.950 8~1.021 7) 0.993 3(0.906 3~1.088 7) 0.851 0(0.492 2~1.471 5) 比利时Belgium 1.002 9(0.970 5~1.036 4) 0.983 6(0.903 1~1.071 2) – 保加利亚Bulgaria 0.996 2(0.961 0~1.032 6) 0.976 6(0.902 6~1.056 6) – 克罗地亚Croatia 1.007 3(0.969 5~1.046 6) 0.991 0(0.897 1~1.094 8) 0.959 3(0.649 3~1.417 4) 捷克Czech Republic 1.012 0(0.976 6~1.048 6) 1.010 2(0.926 7~1.101 2) 1.067 0(0.616 2~1.847 4) 丹麦Denmark 1.013 4(0.981 1~1.046 8) 1.022 7(0.939 0~1.113 9) – 芬兰Finland 1.007 6(0.963 2~1.054 0) 0.981 4(0.877 8~1.097 3) 1.100 6(0.611 0~1.982 7) 法国France 1.004 2(0.976 7~1.032 5) 1.002 4(0.937 4~1.071 9) – 德国Germany – 1.040 1(0.958 6~1.128 5) 0.920 8(0.732 8~1.157 1) 匈牙利Hungary 1.010 0(0.969 3~1.052 4) 1.022 0(0.918 2~1.137 6) 2.398 4(1.347 1~4.270 2) 意大利Italy 1.001 6(0.970 3~1.033 9) 0.996 4(0.923 2~1.075 3) 0.987 9(0.608 2~1.604 6) 立陶宛Lithuania 1.000 0(0.964 2~1.037 0) 0.976 2(0.893 3~1.066 9) 0.810 1(0.520 8~1.260 0) 卢森堡Luxembourg 1.007 5(0.963 4~1.053 7) 1.013 4(0.905 8~1.133 8) – 马耳他Malta 1.026 9(0.983 5~1.072 3) 1.059 5(0.972 4~1.154 4) – 荷兰Netherlands 1.034 9(1.005 8~1.064 8) 1.068 3(0.993 0~1.149 2) 0.875 1(0.455 9~1.679 5) 挪威Norway 1.015 5(0.986 5~1.045 3) 1.007 5(0.958 5~1.059 0) – 波兰Poland 0.961 5(0.932 1~0.991 8) 0.876 0(0.826 6~0.928 5) 0.688 1(0.477 2~0.992 0) 葡萄牙Portugal 0.979 0(0.958 6~0.999 8) 1.000 4(0.937 1~1.067 9) 0.934 8(0.753 0~1.160 5) 罗马尼亚Romania – 1.011 7(0.917 5~1.115 5) 0.708 7(0.445 2~1.128 2) 俄罗斯Russia 1.014 6(0.977 9~1.052 7) 0.999 4(0.928 3~1.076 0) 1.002 9(0.664 1~1.514 4) 塞尔维亚Serbia 1.023 1(0.983 8~1.064 0) 1.009 6(0.923 2~1.104 0) 1.415 4(0.963 0~2.080 2) 斯洛伐克Slovakia 1.015 6(0.976 7~1.056 1) 0.974 6(0.893 5~1.063 0) 1.051 9(0.731 7~1.512 2) 斯洛文尼亚Slovenia – 1.027 8(0.968 5~1.090 8) 0.853 4(0.601 5~1.210 8) 瑞典Sweden 1.020 3(0.992 0~1.049 4) 1.102 2(1.030 1~1.179 2) – 瑞士Switzerland – 1.014 6(0.910 6~1.130 5) – 英国Britain 0.999 1(0.973 5~1.025 5) 0.961 5(0.897 9~1.029 7) 1.012 0(0.810 9~1.263 0) 合并Pooled 1.006 2(0.992 2~1.020 3) 1.003 9(0.973 4~1.035 4) 0.991 9(0.806 8~1.219 6) 北美洲North America 加拿大Canada 1.003 2(0.997 9~1.008 6) 1.007 5(0.983 8~1.031 7) 1.084 1(0.909 9~1.291 6) 萨尔瓦多El Salvador 1.003 2(0.997 9~1.008 6) – – 墨西哥Mexico 1.003 2(0.997 9~1.008 6) 0.981 3(0.957 8~1.005 4) 0.901 0(0.750 9~1.081 2) 美国America 1.003 2(0.997 9~1.008 6) 1.002 1(0.981 6~1.022 9) – 合并Pooled 1.003 2(0.997 9~1.008 6) 0.996 9(0.977 2~1.017 0) 0.988 3(0.840 7~1.161 9) 大洋洲Oceania 澳大利亚Australia 0.993 1(0.936 4~1.053 2) 1.013 9(0.903 8~1.137 4) 1.013 7(0.877 2~1.171 6) 南美洲South America 玻利维亚Bolivia – 0.935 7(0.874 9~1.000 7) – 巴西Brazil 0.965 9(0.929 9~1.003 2) 0.951 7(0.899 8~1.006 5) 0.977 2(0.706 1~1.352 4) 智利Chile 0.950 5(0.915 6~0.986 7) 0.987 9(0.934 9~1.043 9) 0.766 4(0.573 0~1.024 9) 哥伦比亚Colombia 1.023 1(0.977 5~1.070 9) 1.022 7(0.952 4~1.098 2) 0.453 2(0.267 9~0.766 9) 厄尔瓜多Ecuador 0.966 0(0.927 4~1.006 3) – 1.103 3(0.749 8~1.623 4) 秘鲁Peru 0.958 0(0.920 1~0.997 6) 0.953 6(0.897 8~1.012 8) 1.053 2(0.785 9~1.411 5) 合并Pooled 0.960 1(0.930 0~0.991 1) 0.957 0(0.913 5~1.002 6) 0.965 8(0.765 3~1.219 0) 国家/地区
Country/regionsRR值value (95% CI) NO2 AQI CO AQI O3 AQI 亚洲Asia 印度India 0.994 8(0.745 0~1.328 4) 1.094 2(0.418 5~2.860 9) 0.966 5(0.905 5~1.031 6) 以色列Israel 1.244 7(0.865 6~1.789 9) 0.836 3(0.309 3~2.261 3) 0.959 4(0.881 0~1.044 8) 日本Japan 3.678 3(2.461 3~5.497 1) 23.821 5(5.561 4~102.035 5) 0.965 2(0.885 9~1.051 7) 科威特Kuwait – – – 中国大陆Chinese mainland 1.027 4(0.769 5~1.371 6) 0.869 8(0.337 1~2.244 2) 0.912 4(0.854 5~0.974 1) 菲律宾Philippines 0.986 5(0.632 6~1.538 2) – 0.933 2(0.856 9~1.016 3) 韩国Republic of Korea 0.788 4(0.579 0~1.073 7) 0.422 8(0.127 3~1.404 0) 0.948 7(0.872 3~1.031 9) 新加坡Singapore 1.157 9(0.840 7~1.594 8) 0.973 6(0.340 2~2.786 8) 0.952 1(0.880 4~1.029 7) 泰国Thailand 0.987 4(0.648 3~1.503 8) – 0.964 6(0.885 3~1.051 0) 土耳其Türkiye 1.299 2(0.934 2~1.806 7) 1.076 7(0.416 3~2.784 4) 0.966 8(0.886 5~1.054 4) 越南Vietnam 1.062 8(0.783 6~1.441 3) – 1.009 4(0.960 4~1.060 9) 合并Pooled 1.191 1(0.910 9~1.557 4) 1.355 4(0.527 5~3.482 8) 0.957 5(0.917 1~0.999 7)① 欧洲Europe 奥地利Austria 1.064 9(0.918 0~1.235 4) – – 比利时Belgium 0.987 8(0.848 0~1.150 8) – 0.894 9(0.826 5~0.968 8) 保加利亚Bulgaria 0.925 6(0.814 5~1.051 9) – 0.865 0(0.797 1~0.938 6) 克罗地亚Croatia 0.955 8(0.814 5~1.121 6) – 0.881 2(0.811 6~0.956 6) 捷克Czech Republic 1.025 2(0.872 2~1.205 1) – 0.877 3(0.807 9~0.952 7) 丹麦Denmark 1.051 7(0.911 8~1.212 9) 1.811 2(0.841 3~3.898 9) 0.882 9(0.817 4~0.953 7) 芬兰Finland 1.047 0(0.877 7~1.249 1) – 0.888 3(0.818 1~0.964 6) 法国France 1.059 0(0.940 6~1.192 3) – 0.899 1(0.837 2~0.965 5) 德国Germany 1.053 6(0.929 5~1.194 4) – 0.881 3(0.814 3~0.953 7) 匈牙利Hungary 0.952 2(0.797 9~1.136 5) 1.095 8(0.436 4~2.751 5) 0.894 4(0.823 2~0.971 8) 意大利Italy 1.007 3(0.893 5~1.135 6) – 0.883 0(0.817 7~0.953 6) 立陶宛Lithuania – – 0.891 8(0.825 1~0.963 9) 卢森堡Luxembourg – – 0.872 6(0.803 9~0.947 1) 马耳他Malta 0.929 6(0.790 1~1.093 7) – 0.863 1(0.795 2~0.936 7) 荷兰Netherlands 1.033 0(0.923 9~1.155 0) 1.442 5(0.686 6~3.030 6) 0.898 3(0.833 6~0.968 1) 挪威Norway 1.060 7(0.967 2~1.163 4) – 0.881 0(0.826 3~0.939 2) 波兰Poland 0.997 3(0.863 0~1.152 5) 0.755 8(0.411 2~1.389 1) 0.913 1(0.842 4~0.989 7) 葡萄牙Portugal 1.049 4(0.912 1~1.207 5) – 0.873 5(0.808 2~0.944 0) 罗马尼亚Romania 1.043 8(0.900 1~1.210 5) – 0.890 0(0.822 2~0.963 5) 俄罗斯Russia 1.074 3(0.947 8~1.217 7) 1.751 5(0.908 8~3.375 7) 0.904 1(0.841 0~0.971 8) 塞尔维亚Serbia 1.187 8(1.013 8~1.391 7) 1.361 7(0.795 6~2.330 4) 0.905 7(0.834 3~0.983 2) 斯洛伐克Slovakia 0.991 0(0.838 2~1.171 6) 2.385 5(1.028 9~5.530 5) – 斯洛文尼亚Slovenia 1.032 8(0.909 5~1.172 9) – 0.892 0(0.827 3~0.961 8) 瑞典Sweden 1.028 0(0.909 7~1.161 5) – 0.860 3(0.799 3~0.925 9) 瑞士Switzerland 0.887 0(0.753 2~1.044 7) – 0.898 2(0.827 5~0.975 1) 英国Britain 1.008 1(0.902 6~1.125 9) – 0.899 5(0.837 6~0.965 9) 合并Pooled 1.017 1(0.957 5~1.080 4) 1.431 4(0.910 2~2.251 1) 0.887 0(0.854 1~0.921 2)① 北美洲North America 加拿大Canada 1.073 4(0.964 3~1.194 8) 1.658 8(0.996 9~2.760 1) 1.029 8(0.969 2~1.094 2) 萨尔瓦多El Salvador – – – 墨西哥Mexico 1.037 4(0.935 6~1.150 3) 0.954 7(0.593 2~1.536 7) 1.029 8(0.969 2~1.094 2) 美国America – – – 合并Pooled 1.055 2(0.958 7~1.161 5) 1.258 5(0.802 8~1.972 6) 1.029 8(0.969 2~1.094 2) 大洋洲Oceania 澳大利亚Australia 0.972 8(0.898 1~1.053 7) 0.976 1(0.908 8~1.048 4) 1.013 1(0.955 5~1.074 2) 南美洲South America 玻利维亚Bolivia 0.940 5(0.851 9~1.038 4) – 1.035 7(0.945 4~1.134 6) 巴西Brazil 0.966 6(0.876 9~1.065 4) 0.954 6(0.847 5~1.075 3) 0.982 7(0.892 7~1.081 8) 智利Chile 0.978 7(0.888 5~1.078 0) 0.954 6(0.847 5~1.075 3) 1.015 4(0.914 7~1.127 3) 哥伦比亚Colombia 1.238 7(0.972 1~1.578 4) 1.048 0(0.818 7~1.341 5) 0.980 7(0.812 4~1.183 9) 厄尔瓜多Ecuador – 0.954 6(0.847 5~1.075 3) 1.064 7(0.954 2~1.187 9) 秘鲁Peru 0.970 3(0.878 6~1.071 5) 0.954 6(0.847 5~1.075 3) 1.072 8(0.957 2~1.202 4) 合并Pooled 0.963 9(0.876 2~1.060 4) 0.954 6(0.847 5~1.075 3) 1.033 7(0.961 5~1.111 4) 注:PM2.5, 细颗粒物; PM10, 可吸入颗粒物; SO2, 二氧化硫; NO2, 二氧化氮;CO, 一氧化碳; O3, 臭氧; AQI,空气质量指数; “–”表示数据无法获取。
① P<0.05。
Note: PM2.5, fine particles; PM10, inhalable particles; SO2, sulfur dioxide; NO2, nitrogen dioxide; CO, carbon monoxide; O3, ozone; AQI, air quality index; "–" indicates that the data cannot be obtained.
① P<0.05.
下载: 导出CSV
表 4 48个国家/地区的柯本气候带的划分
Table 4. Details of climatic breakdown of influenza transmission patterns for 48 countries/regions
区域Zone 国家/地区Country/regions A (6) 巴西、哥伦比亚、萨尔瓦多、菲律宾、新加坡、泰国Brazil, Colombia, El Salvador, Philippines, Singapore, Thailand AB (1) 玻利维亚Bolivia ABC (3) 厄瓜多尔、印度、秘鲁Ecuador, India, Peru AC (1) 越南Vietnam B (3) 澳大利亚、科威特、墨西哥Australia, Kuwait, Mexico BC (1) 以色列Israel BCD (4) 智利、中国大陆、土耳其、美国Chile, Chinses mainland, Türkiye, America C (10) 比利时、丹麦、法国、德国、意大利、卢森堡、马耳他、荷兰、葡萄牙、英国Belgium, Denmark, France, Germany, Italy, Luxembourg, Malta, Netherlands, Portugal, Britain CD (7) 保加利亚、克罗地亚、匈牙利、日本、塞尔维亚、斯洛文尼亚、瑞士Bulgaria, Croatia, Hungary, Japan, Serbia, Slovenia, Switzerland D (12) 奥地利、加拿大、捷克、芬兰、立陶宛、挪威、波兰、韩国、罗马尼亚、俄罗斯、斯洛伐克、瑞典
Austria, Canada, Czech Republic, Finland, Lithuania, Norway, Poland, Republic of Korea, Romania, Russia, Slovakia, Sweden注:A,热带;B,干旱带;C,温带;D,寒带。
Note: A, tropical; B, arid zone; C, temperate zone; D, cold zone.
下载: 导出CSV
表 5 空气污染物AQI每增加10个单位对48个国家/地区的流行性感冒传播风险的气候带分区的荟萃风险值和95% CI
Table 5. Regional pooled RR and 95% CIs for influenza risk for 48 countries/regions for each 10-unit increase in air pollutant AQI in climate zones
国家/地区
Country/regionsRR值value (95% CI) PM2.5 AQI PM10 AQI SO2 AQI A 巴西Brazil 0.989 5(0.960 7~1.019 1) 0.970 6(0.930 1~1.012 9) 0.947 6(0.821 7~1.092 7) 哥伦比亚Colombia 0.996 3(0.967 3~1.026 3) 0.982 9(0.941 6~1.026 0) 0.947 6(0.821 7~1.092 7) 萨尔瓦多El Salvador 0.988 8(0.959 4~1.019 1) – – 菲律宾Philippines – 0.977 9(0.936 0~1.021 6) – 新加坡Singapore 0.989 0(0.960 0~1.018 8) 0.975 1(0.933 7~1.018 2) 0.947 6(0.821 7~1.092 7) 泰国Thailand 0.976 1(0.934 7~1.019 3) 0.947 6(0.821 7~1.092 7) 合并Pooled 0.990 9(0.965 5~1.016 9) 0.976 5(0.941 1~1.013 3) 0.947 6(0.821 7~1.092 7) AB 玻利维亚Bolivia – 0.860 5(0.718 3~1.030 8) – ABC 厄尔瓜多Ecuador 1.034 1(1.010 3~1.058 5) – 1.149 9(0.952 8~1.387 8) 印度India 1.027 1(1.004 7~1.049 9) 1.018 3(1.003 7~1.033 1) 1.049 7(0.874 5~1.260 0) 秘鲁Peru 1.022 5(0.999 0~1.046 5) 1.018 3(1.003 7~1.033 1) 1.118 2(0.933 6~1.339 4) 合并Pooled 1.027 9(1.005 6~1.050 6)① 1.018 3(1.003 7~1.033 1)① 1.105 2(0.926 7~1.317 9) AC 越南Vietnam 1.002 5(0.970 6~1.035 5) 1.020 8(0.981 6~1.061 7) 0.927 5(0.850 5~1.011 4) B 澳大利亚Australia 1.001 8(0.977 0~1.027 2) 0.983 7(0.945 5~1.023 4) 0.998 7(0.873 7~1.141 5) 科威特Kuwait 1.00 18(0.977 0~1.027 2) – – 墨西哥Mexico 1.001 8(0.977 0~1.027 2) 0.983 7(0.945 5~1.023 4) 0.901 6(0.788 8~1.030 5) 合并Pooled 1.001 8(0.977 0~1.027 2) 0.983 7(0.945 5~1.023 4) 0.948 9(0.841 5~1.069 9) BC 以色列Israel 0.988 8(0.937 3~1.043 2) 0.978 8(0.948 0~1.010 6) 1.095 1(0.526 8~2.276 5) BCD 智利Chile 0.948 0(0.904 5~0.993 7) 0.997 2(0.985 0~1.009 5) 0.749 9(0.545 7~1.030 5) 中国大陆Chinese mainland 0.964 7(0.924 8~1.006 3) 0.997 2(0.985 0~1.009 5) 1.228 3(0.907 6~1.662 4) 土耳其Türkiye – 0.997 2(0.985 0~1.009 5) 0.938 9(0.700 7~1.257 9) 美国America 1.010 6(0.974 6~1.048 0) 0.997 2(0.985 0~1.009 5) – 合并Pooled 0.974 1(0.939 7~1.009 7) 0.997 2(0.985 0~1.009 5) 0.952 7(0.728 7~1.245 7) C 比利时Belgium 1.005 0(0.972 3~1.038 7) 0.999 3(0.929 8~1.074 0) – 丹麦Denmark 1.014 3(0.981 9~1.078 0) 1.012 9(0.945 0~1.085 7) – 法国France 1.004 8(0.976 0~1.034 5) 1.024 2(0.965 0~1.087 0) – 德国Germany – 1.065 1(0.997 4~1.137 3) 0.966 3(0.878 1~1.063 4) 意大利Italy 1.003 6(0.971 9~1.036 4) 1.006 0(0.944 5~1.071 6) 0.965 4(0.873 3~1.067 3) 卢森堡Luxembourg 1.009 1(0.96 82~1.051 6) 1.035 6(0.952 9~1.125 5) – 马耳他Malta 1.024 3(0.983 8~1.066 4) 1.056 4(0.987 4~1.130 1) – 荷兰Netherlands 1.033 6(1.003 4~1.064 7) 1.047 0(0.982 2~1.116 0) 0.964 4(0.872 3~1.066 3) 葡萄牙Portugal 0.980 6(0.958 1~1.003 7) 1.009 5(0.952 6~1.069 9) 0.942 8(0.860 0~1.033 5) 英国Britain 1.001 9(0.974 4~1.030 1) 0.972 3(0.915 8~1.032 3) 0.986 2(0.898 1~1.083 0) 合并Pooled 1.008 5(0.990 1~1.027 2) 1.022 5(0.983 7~1.062 8) 0.964 9(0.896 1~1.039 0) CD 保加利亚Bulgaria 1.002 7(0.942 8~1.066 3) 0.974 7(0.912 5~1.041 1) – 克罗地亚Croatia 1.001 9(0.940 0~1.068 0) 1.013 3(0.938 4~1.094 1) 1.160 2(0.255 8~5.263 0) 匈牙利Hungary 0.986 4(0.915 1~1.063 2) 0.997 2(0.918 3~1.082 8) 11.687 5(1.852 3~73.747 1) 日本Japan 1.136 4(1.052 5~1.227 0) 1.104 8(1.016 0~1.201 5) 27.288 0(4.525 8~164.532 8) 塞尔维亚Serbia 1.018 2(0.950 0~1.091 4) 1.020 5(0.950 2~1.095 9) 1.135 5(0.252 5~5.105 8) 斯洛文尼亚Slovenia – 1.049 8(0.986 9~1.116 8) 0.822 2(0.197 7~3.419 5) 瑞士Switzerland – 0.988 6(0.908 0~1.076 4) – 合并Pooled 1.027 7(0.970 7~1.088 1) 1.020 5(0.963 4~1.080 9) 3.218 7(0.815 1~12.710 7) D 奥地利Austria 0.987 8(0.946 8~1.030 6) 0.962 9(0.866 4~1.070 2) 0.984 3(0.486 5~1.991 6) 加拿大Canada 1.010 4(0.970 7~1.051 8) 1.022 1(0.960 8~1.087 3) 1.088 1(0.777 3~1.523 0) 捷克Czech Republic 1.009 1(0.967 7~1.052 3) 1.008 8(0.914 6~1.112 6) 0.756 0(0.377 5~1.514 2) 芬兰Finland 1.003 5(0.951 2~1.058 6) 0.950 0(0.828 9~1.088 7) 0.862 9(0.423 1~1.760 1) 立陶宛Lithuania 0.995 9(0.954 0~1.039 6) 0.963 7(0.872 4~1.064 6) 0.852 3(0.493 6~1.471 8) 挪威Norway 1.016 3(0.981 8~1.052 1) 1.005 3(0.944 6~1.070 0) – 波兰Poland 0.954 9(0.920 6~0.990 5) 0.868 4(0.810 3~0.930 6) 0.527 9(0.313 1~0.889 8) 韩国Republic of Korea 0.981 2(0.945 9~1.017 9) 0.949 7(0.882 4~1.022 0) 0.518 5(0.308 4~0.871 9) 罗马尼亚Romania – 0.991 7(0.885 2~1.111 0) 0.974 6(0.526 1~1.805 6) 俄罗斯Russia 1.015 5(0.972 8~1.060 0) 0.992 0(0.910 5~1.080 7) 0.772 2(0.439 1~1.357 7) 斯洛伐克Slovakia 1.009 9(0.964 4~1.057 5) 0.977 0(0.886 3~1.077 0) 1.040 1(0.600 2~1.802 2) 瑞典Sweden 1.023 8(0.989 8~1.059 0) 1.116 9(1.032 6~1.208 0) – 合并Pooled 1.000 6(0.979 3~1.022 3) 0.982 5(0.935 9~1.031 4) 0.813 9(0.594 5~1.114 3) 国家/地区
Country/regionsRR值value (95% CI) NO2 AQI CO AQI O3 AQI A 巴西Brazil 1.079 1(0.971 9~1.198 1) 1.024 8(0.863 9~1.215 7) 0.934 6(0.879 6~0.993 0) 哥伦比亚Colombia 1.079 1(0.971 9~1.198 1) 1.024 8(0.863 9~1.215 7) 0.934 6(0.879 6~0.993 0) 萨尔瓦多El Salvador – – – 菲律宾Philippines 1.079 1(0.971 9~1.198 1) – 0.934 6(0.879 6~0.993 0) 新加坡Singapore 1.079 1(0.971 9~1.198 1) 1.024 8(0.863 9~1.215 7) 0.934 6(0.879 6~0.993 0) 泰国Thailand 1.079 1(0.971 9~1.198 1) – 0.934 6(0.879 6~0.993 0) 合并Pooled 1.079 1(0.971 9~1.198 1) 1.024 8(0.863 9~1.215 7) 0.934 6(0.879 6~0.993 0)① AB 玻利维亚Bolivia 0.936 7(0.742 9~1.181 0) – 1.043 2(0.966 3~1.126 3) ABC 厄尔瓜多Ecuador 0.812 9(0.401 0~1.647 9) 1.094 7(0.931 0~1.287 3) 印度India 0.964 3(0.866 5~1.073 2) 1.164 2(0.698 1~1.941 6) 0.984 5(0.863 5~1.122 5) 秘鲁Peru 0.964 3(0.866 5~1.073 2) 0.587 7(0.313 8~1.100 5) 1.127 0(0.948 7~1.338 7) 合并Pooled 0.964 3(0.866 5~1.073 2) 0.822 4(0.508 0~1.331 3) 1.067 0(0.946 1~1.203 3) AC 越南Vietnam 1.052 2(0.905 2~1.223 1) – 1.014 6(0.987 9~1.042 0)① 澳大利亚Australia 0.987 1(0.927 8~1.050 1) 0.970 1(0.906 4~1.038 2) 1.016 2(0.973 2~1.061 1) 科威特Kuwait – – – 墨西哥Mexico 0.987 1(0.927 8~1.050 1) 0.970 1(0.906 4~1.038 2) 1.016 2(0.973 2~1.061 1) 合并Pooled 0.987 1(0.927 8~1.050 1) 0.970 1(0.906 4~1.038 2) 1.016 2(0.973 2~1.061 1) BC 以色列Israel 1.288 7(0.983 7~1.688 2) 0.836 9(0.608 7~1.150 7) 0.966 7(0.806 1~1.159 4) BCD 智利Chile 1.042 0(0.909 7~1.193 6) 0.967 3(0.838 0~1.116 4) 0.930 9(0.856 0~1.012 2) 中国大陆Chinese mainland 1.047 4(0.919 2~1.193 4) 0.888 7(0.781 0~1.011 3) 0.907 0(0.838 0~0.981 6) 土耳其Türkiye 1.128 9(0.976 7~1.304 7) 1.020 6(0.890 0~1.170 4) – 美国America – – 0.928 7(0.853 2~1.010 9) 合并Pooled 1.072 0(0.965 4~1.190 4) 0.957 3(0.861 8~1.063 5) 0.922 1(0.861 4~0.987 1)① C 比利时Belgium 1.023 7(0.938 8~1.116 2) – 0.882 1(0.826 0~0.942 0) 丹麦Denmark 1.062 7(0.976 8~1.156 2) 2.025 5(1.068 2~3.840 6) 0.878 8(0.823 3~0.938 1) 法国France 1.045 3(0.965 7~1.131 5) – 0.887 1(0.833 0~0.944 7) 德国Germany 0.990 9(0.913 4~1.074 9) – 0.871 5(0.816 1~0.930 5) 意大利Italy 1.016 6(0.941 0~1.098 3) – 0.880 5(0.825 1~0.939 6) 卢森堡Luxembourg – – 0.878 4(0.822 1~0.938 6) 马耳他Malta 1.032 3(0.942 5~1.130 6) 0.869 6(0.813 9~0.929 1) 荷兰Netherlands 0.982 1(0.909 8~1.060 2) 2.025 5(1.068 2~3.840 6) 0.880 7(0.825 5~0.939 5) 葡萄牙Portugal 1.037 5(0.953 3~1.129 2) – 0.870 4(0.815 4~0.929 1) 英国Britain 1.028 2(0.952 5~1.109 8) – 0.889 1(0.834 3~0.947 5) 合并Pooled 1.024 1(0.960 0~1.092 4) 2.025 5(1.068 2~3.840 6) 0.878 8(0.835 7~0.924 1)① CD 保加利亚Bulgaria 0.886 8(0.508 6~1.546 2) – 0.669 8(0.486 6~0.921 9) 克罗地亚Croatia 0.768 6(0.396 8~1.488 9) – 0.856 4(0.614 0~1.194 5) 匈牙利Hungary 0.739 9(0.310 7~1.762 4) 0.179 2(0.007 5~4.282 2) 1.176 3(0.794 2~1.742 1) 日本Japan 4.001 3(2.189 4~7.312 6) 41.846 7(2.171 0~806.614 1) 0.952 2(0.727 8~1.245 9) 塞尔维亚Serbia 2.505 0(1.323 4~4.741 7) 1.300 7(0.083 7~20.220 7) 1.256 7(0.893 2~1.768 1) 斯洛文尼亚Slovenia 1.091 1(0.630 4~1.888 6) – 0.911 8(0.717 8~1.158 2) 瑞士Switzerland 0.698 2(0.358 5~1.359 9) – 1.084 5(0.777 5~1.512 8) 合并Pooled 1.212 4(0.719 9~2.042 0) 2.136 6(0.139 3~32.775 5) 0.968 3(0.786 9~1.191 6) D 奥地利Austria 1.073 8(0.875 0~1.317 8) – – 加拿大Canada 1.083 5(0.920 9~1.274 9) 1.704 8(0.796 1~3.650 7) 1.010 1(0.887 4~1.149 8) 捷克Czech Republic 1.053 6(0.851 2~1.304 1) – 0.867 4(0.744 6~1.010 4) 芬兰Finland 0.994 3(0.795 8~1.242 3) – 0.937 1(0.803 6~1.092 8) 立陶宛Lithuania – – 0.916 2(0.803 3~1.045 0) 挪威Norway 1.058 2(0.935 6~1.196 8) – 0.885 0(0.807 0~0.970 5) 波兰Poland 0.945 2(0.778 0~1.148 2) 0.694 2(0.300 7~1.602 4) 0.965 8(0.839 8~1.110 8) 韩国Republic of Korea 0.859 2(0.735 4~1.003 9) 0.536 4(0.216 1~1.331 4) 0.964 2(0.848 2~1.096 0) 罗马尼亚Romania 0.987 6(0.810 3~1.203 8) – 0.904 1(0.792 5~1.031 5) 俄罗斯Russia 1.081 7(0.917 1~1.275 8) 1.925 0(0.792 7~4.674 8) 0.934 5(0.838 7~1.041 3) 斯洛伐克Slovakia 1.047 3(0.845 8~1.296 7) 3.032 8(0.948 9~9.693 6) – 瑞典Sweden 1.026 6(0.874 0~1.205 8) – 0.840 2(0.751 2~0.939 7) 合并Pooled 1.016 9(0.922 9~1.120 5) 1.299 5(0.644 6~2.619 6) 0.921 2(0.858 1~0.988 9)① 注:PM2.5, 细颗粒物; PM10, 可吸入颗粒物; SO2, 二氧化硫; NO2, 二氧化氮;CO, 一氧化碳; O3, 臭氧; AQI,空气质量指数; A,热带;B,干旱带;C,温带;D,寒带; “–”表示数据无法获取。
① P<0.05。
Note: PM2.5, fine particles; PM10, inhalable particles; SO2, sulfur dioxide; NO2, nitrogen dioxide; CO, carbon monoxide; O3, ozone; AQI, air quality index; A, tropical; B, arid zone; C, temperate zone; D, cold zone; "–" indicates that the data cannot be obtained.
① P<0.05.
下载: 导出CSV
-
[1] Uyeki TM, Hui DS, Zambon M, et al. Influenza[J]. Lancet, 2022, 400(10353): 693-706. DOI: 10.1016/S0140-6736(22)00982-5. [2] World Health Organization. Influenza (seasonal)[EB/OL]. (2025-02-28)[2025-03-24]. https://www.who.int/news-room/fact-sheets/detail/influenza-(seasonal) .[3] Liang YL, Sun ZB, Hua W, et al. Spatiotemporal effects of meteorological conditions on global influenza peaks[J]. Environ Res, 2023, 231(Pt 2): 116171. DOI: 10.1016/j.envres.2023.116171. [4] Neumann G, Kawaoka Y. Seasonality of influenza and other respiratory viruses[J]. EMBO Mol Med, 2022, 14(4): e15352. DOI: 10.15252/emmm.202115352. [5] Hamidou Soumana I, Carlsten C. Air pollution and the respiratory microbiome[J]. J Allergy Clin Immunol, 2021, 148(1): 67-69. DOI: 10.1016/j.jaci.2021.05.013. [6] Yang J, Yang Z, Qi L, et al. Influence of air pollution on influenza-like illness in China: a nationwide time-series analysis[J]. EBioMedicine, 2023, 87: 104421. DOI: 10.1016/j.ebiom.2022.104421. [7] Glencross DA, Ho TR, Camiña N, et al. Air pollution and its effects on the immune system[J]. Free Radic Biol Med, 2020, 151: 56-68. DOI: 10.1016/j.freeradbiomed.2020.01.179. [8] Wikimedia Foundation. Air quality index[EB/OL]. (2024-10-10)[2024-10-20]. https://en.wikipedia.org/w/index.phptitle=Air_quality_index&oldid=1250463831 .[9] Yu LJ, Li XL, Wang YH, et al. Short-term exposure to ambient air pollution and influenza: a multicity study in China[J]. Environ Health Perspect, 2023, 131(12): 127010. DOI: 10.1289/EHP12146. [10] Luo CY, Qian J, Liu YQ, et al. Long-term air pollution levels modify the relationships between short-term exposure to meteorological factors, air pollution and the incidence of hand, foot and mouth disease in children: a DLNM-based multicity time series study in Sichuan Province, China[J]. BMC Public Health, 2022, 22(1): 1484. DOI: 10.1186/s12889-022-13890-7. [11] Sera F, Gasparrini A. Extended two-stage designs for environmental research[J]. Environ Health, 2022, 21(1): 41. DOI: 10.1186/s12940-022-00853-z. [12] Qiu JQ, Wang HM, Hu L, et al. Spatial transmission network construction of influenza-like illness using dynamic Bayesian network and vector-autoregressive moving average model[J]. BMC Infect Dis, 2021, 21(1): 164. DOI: 10.1186/s12879-021-05769-6. [13] Shimmei K, Nakamura T, Ng CFS, et al. Association between seasonal influenza and absolute humidity: time-series analysis with daily surveillance data in Japan[J]. Sci Rep, 2020, 10(1): 7764. DOI: 10.1038/s41598-020-63712-2. [14] Ma P, Zhou N, Wang XZ, et al. Stronger susceptibilities to air pollutants of influenza A than B were identified in subtropical Shenzhen, China[J]. Environ Res, 2023, 219: 115100. DOI: 10.1016/j.envres.2022.115100. [15] Beck HE, McVicar TR, Vergopolan N, et al. High-resolution (1 km) Köppen-Geiger maps for 1901-2099 based on constrained CMIP6 projections[J]. Sci Data, 2023, 10(1): 724. DOI: 10.1038/s41597-023-02549-6. [16] 王小磊, 黄超洋, 孙倩莱, 等. 湖南省2014–2023年流行性感冒哨点监测数据分析[J]. 中国感染控制杂志, 2024, 23(11): 1413-1420. DOI: 10.12138/j.issn.1671-9638.20246535.Wang XL, Huang CY, Sun QL, et al. Analysis of influenza sentinel surveillance data in Hunan Province, 2014-2023[J]. Chin J Infect Control, 2024, 23(11): 1413-1420. DOI: 10.12138/j.issn.1671-9638.20246535. [17] Zhou LL, Yang HP, Pan W, et al. Association between meteorological factors and the epidemics of influenza (sub)types in a subtropical basin of Southwest China[J]. Epidemics, 2022, 41: 100650. DOI: 10.1016/j.epidem.2022.100650. [18] Guo F, Zhang P, Do V, et al. Ozone as an environmental driver of influenza[J]. Nat Commun, 2024, 15(1): 3763. DOI: 10.1038/s41467-024-48199-z. [19] Wang YB, Zhang R, Yang FY, et al. Potential mechanisms mediating PM2.5-induced alterations of H3N2 influenza virus infection and cytokine production in human bronchial epithelial cells[J]. Ecotoxicol Environ Saf, 2023, 259: 115069. DOI: 10.1016/j.ecoenv.2023.115069. [20] Yang J, Zhang T, Yang LY, et al. Association between ozone and influenza transmissibility in China[J]. BMC Infect Dis, 2023, 23(1): 763. DOI: 10.1186/s12879-023-08769-w. [21] Horn SA, Dasgupta PK. The Air Quality Index (AQI) in historical and analytical perspective a tutorial review[J]. Talanta, 2024, 267: 125260. DOI: 10.1016/j.talanta.2023.125260. [22] Wang SY, Ren Y, Xia BS. Estimation of urban AQI based on interpretable machine learning[J]. Environ Sci Pollut Res Int, 2023, 30(42): 96562-96574. DOI: 10.1007/s11356-023-29336-5. [23] 段肖肖, 刘思秀. PM2.5致病机制的研究进展[J]. 复旦学报(医学版), 2020, 47(4): 605-614. DOI: 10.3969/j.issn.1672-8467.2020.04.023.Duan XX, Liu SX. Research progress on pathogenic mechanism of PM2.5 [J]. Fudan Univ J Med Sci, 2020, 47(4): 605-614. DOI: 10.3969/j.issn.1672-8467.2020.04.023. [24] Wang ZF, Fu HX, Bian M, et al. Variation characteristics of ozone concentration and analysis of meteorological influencing factors in Jinan City, 2019-2022[J]. China Environmental Monitoring, 2025: 1-13. [25] Choudhary I, Vo T, Paudel K, et al. Postnatal ozone exposure disrupts alveolar development, exaggerates mucoinflammatory responses, and suppresses bacterial clearance in developing Scnn1b-tg+ mice lungs[J]. J Immunol, 2021, 207(4): 1165-1179. DOI: 10.4049/jimmunol.2001286. [26] Caldera F, Mercer M, Samson SI, et al. Influenza vaccination in immunocompromised populations: strategies to improve immunogenicity[J]. Vaccine, 2021, 39(Suppl 1): A15-A23. DOI: 10.1016/j.vaccine.2020.11.037. -

 点击查看大图
计量
- 文章访问数: 2
- HTML全文浏览量: 2
- PDF下载量: 1
- 被引次数: 0