

-
摘要:
目的 探讨多金属联合暴露对血脂异常风险的作用,为制定更精准的公共卫生策略提供依据。 方法 采用方便抽样抽取2015―2023年广西壮族自治区柳州市两乡镇1 905名20~75岁常住居民作为研究对象,利用问卷调查、体格检查和生理生化检测收集一般人口学信息、生活行为习惯和生化指标。通过电感耦合等离子体质谱检测尿中26种金属元素的浓度,使用最小绝对收缩和选择算子回归、多因素非条件logistic回归分析模型,筛选血脂异常主要效应金属并探讨单一金属暴露的影响。使用贝叶斯核机器回归(Bayesian kernel machine regression, BKMR)模型评估尿金属联合暴露效应,在分位数g-运算(quantile g-computation, Qgcomp)中验证并排序。 结果 金属锌、钛、铀、铅和钡是导致血脂异常的主要效应金属,多因素非条件logistic回归分析结果显示,锌和铅均与血脂异常风险有关联,与第一分位数浓度相比,两者在第三分位数浓度时血脂异常风险分别增加76%(OR=1.76, 95% CI: 1.36~2.29)和29%(OR=1.29, 95% CI: 1.01~1.66)。BKMR模型表明,金属混合物暴露水平与血脂异常风险之间存在协同效应,其中锌具有显著正向驱动作用,钛与血脂异常风险存在负向关联。Qgcomp模型验证了BKMR的结果,仅有钛(100.0%)提供负向权重,正向权重排序依次为锌(58.2%)、铅(25.1%)、铀(13.3%)和钡(3.4%)。 结论 锌、钛、铀、铅和钡的联合暴露可增加血脂异常风险,低水平钛和高水平锌暴露可能是血脂异常风险增加的重要因素。 Abstract:Objective Investigate the effect of co-exposure to multiple metals on the risk of dyslipidemia to inform the development of more precise public health strategies. Methods A total of 1 905 permanent residents aged 20-75 years were recruited using a convenience sampling method from two townships in Liuzhou, Guangxi, from 2015 to 2023. Data on demographic characteristics, lifestyle behaviors, and biochemical indicators were collected through questionnaire surveys, physical examinations, and laboratory tests. The concentrations of 26 urinary metal elements were measured using inductively coupled plasma mass spectrometry. Least absolute shrinkage and selection operator regression and multivariable unconditional logistic regression were used to identify key metals associated with dyslipidemia and to assess the effects of individual metal exposures.The Bayesian kernel machine regression (BKMR) model was used to evaluate the combined effects of urinary metal co-exposure, and the results were validated and ranked using quantile g-computation (Qgcomp). Results Zinc (Zn), titanium (Ti), uranium (U), lead (Pb), and barium (Ba) were identified as key metals associated with dyslipidemia. A multivariable unconditional logistic regression model indicated that Zn and Pb were positively associated with an increased risk of dyslipidemia. At the third quartile concentration, Zn was associated with a 76% increase in risk (OR=1.76, 95% CI: 1.36-2.29), and Pb with a 29% increase (OR=1.29, 95% CI: 1.01-1.66), compared to the first quartile. The BKMR model revealed a synergistic effect of metal mixtures on dyslipidemia risk, with Zn showing a strong positive association and Ti showing a negative association. Qgcomp results validated the BKMR findings, identifying Ti (100.0%) as the only metal with a negative weight, while Zn (58.2%), Pb (25.1%), U (13.3%), and Ba (3.4%) exhibit positive weights in descending order. Conclusions Combined exposure to Zn, Ti, U, Pb, and Ba was significantly associated with dyslipidemia risk. Low-level Ti and high-level Zn exposure may be important risk factors for dyslipidemia. -
Key words:
- Dyslipidemia /
- Metals /
- Combined exposure /
- Bayesian kernel machine regression
-

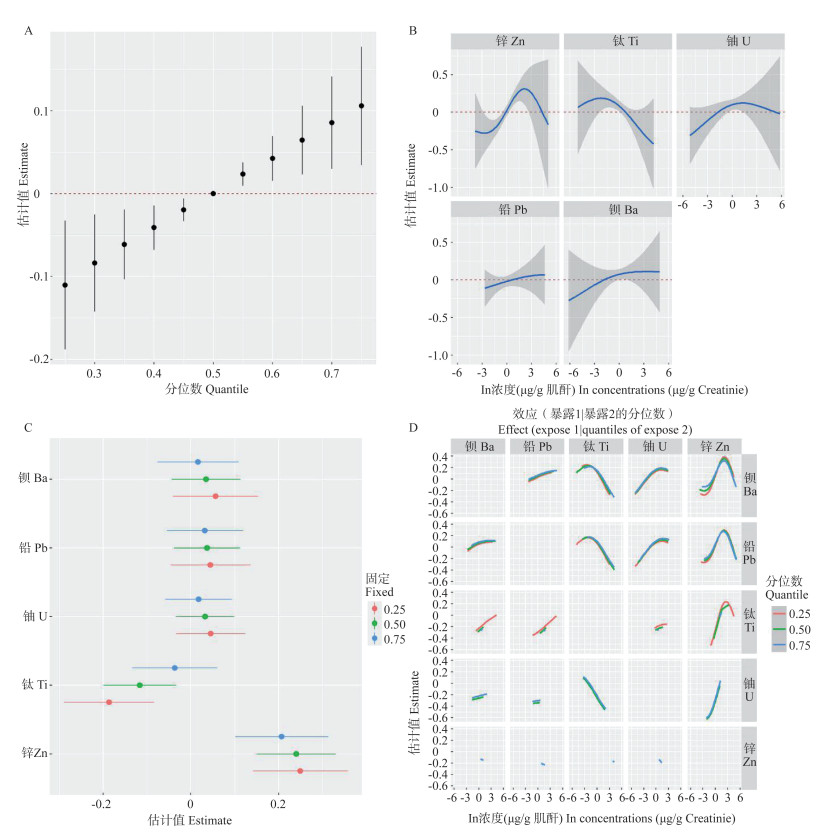
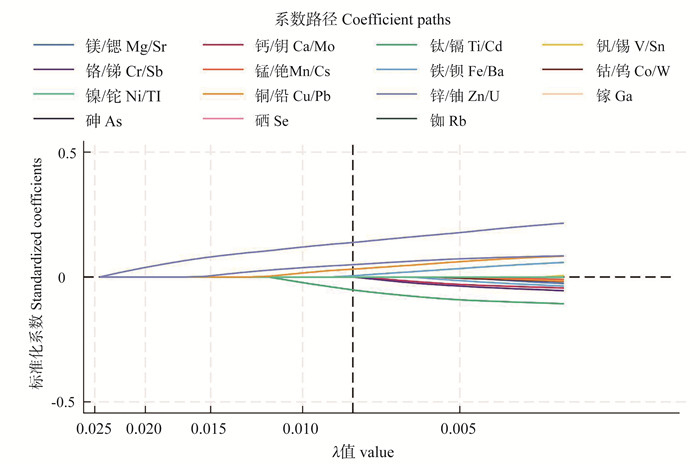
图 1 最小绝对收缩和选择算子回归筛选血脂异常风险的主要效应金属
Figure 1. Least absolute shrinkage and selection operator regression screening for risk of dyslipidemia main effect metals

图 2 贝叶斯核机器回归模型评估尿金属联合暴露效应
A为联合效应图;B为单变量暴露-反应曲线图;C为单金属效应图;D为双变量交互曲线图。
Figure 2. Bayesian kernel machine regression modelling to assess combined urinary metal exposure effects
A is the combined effect plot; B is the univariate exposure-response curve; C is the single-metal effect plot; D is the bivariate interaction curve.

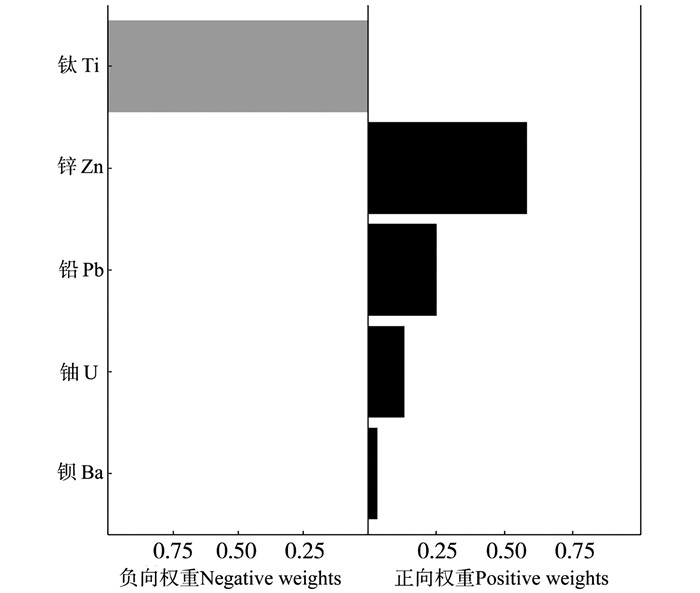
图 3 分位数g-运算模型评估尿金属联合暴露效应
Figure 3. Quantile g-computation modelling to assess combined urinary metal exposure effects
表 1 1 905名研究对象的基本情况
Table 1. Basic characteristics of the 1 905 participants
特征
Characteristics全人群
Total population① (n=1 905)血脂正常
Normal blood lipid① (n=637)血脂异常
Dyslipidemia① (n=1 268)χ2/Z/
t值
valueP值
value年龄/岁Age/years 0.010 0.921 < 60 1 244(65.3) 415(65.2) 829(65.4) ≥60 661(34.7) 222(34.8) 439(34.6) 性别Gender 1.354 0.245 男Male 647(34.0) 205(32.2) 442(34.9) 女Female 1 258(66.0) 432(67.8) 826(65.1) 受教育程度Education level 1.004 0.316 初中以下Below middle school 1 282(67.3) 419(65.8) 863(68.1) 初中及以上Middle school and above 623(32.7) 218(34.2) 405(31.9) 吸烟状态Smoking status 1.702 0.089 从不吸烟Never smoking 1 454(76.3) 501(78.7) 953(75.1) 既往吸烟Former smoking 166(8.7) 51(8.0) 115(9.1) 当前吸烟Current smoking 285(15.0) 85(13.3) 200(15.8) 饮酒状态Drinking status 0.744 0.457 从不饮酒Never drinking 904(47.4) 299(46.9) 605(47.7) 既往饮酒Former drinking 255(13.4) 77(12.1) 178(14.0) 当前饮酒Current drinking 746(39.2) 261(41.0) 485(38.3) 体力活动Physical activity 0.577 0.564 低Low 69(3.6) 29(4.5) 40(3.2) 中Moderate 196(15.6) 87(13.7) 209(16.5) 高High 1 540(80.8) 521(81.8) 1 019(80.3) 糖尿病Diabetes 33.351 < 0.001 是Yes 162(8.5) 21(3.3) 141(11.1) 否No 1 743(91.5) 616(96.7) 1 127(88.9) BMI/(kg·m-2) 23.4±3.4 22.3±3.2 24.0±3.4 -10.288 < 0.001 eGFR/(ml·min-1·1.73m-2) 98.4(86.8, 108.5) 102.5(91.8, 114.0) 96.7(84.9, 106.2) 7.886 < 0.001 TG/(mg·dL-1) 119.6(82.4, 177.1) 84.1(65.5, 108.1) 153.7(103.6, 210.4) -23.298 < 0.001 TC/(mg·dL-1) 202.0(178.7, 229.7) 176.0(159.7, 187.9) 219.9(202.2, 240.9) -28.268 < 0.001 HDL-C/(mg·dL-1) 55.7(47.6, 66.5) 57.6(50.7, 66.5) 54.9(45.6, 66.5) 4.016 < 0.001 LDL-C/(mg·dL-1) 112.9(92.4, 136.1) 93.6(80.8, 105.2) 127.6(107.2, 145.4) -23.621 < 0.001 注:BMI,体质量指数;eGFR,估算的肾小球滤过率;TG,三酰甘油;TC,总胆固醇;HDL-C,高密度脂蛋白胆固醇;LDL-C,低密度脂蛋白胆固醇。
①以人数(占比/%)或x±s或M(P25, P75)表示。
Note: BMI, body mass index; eGFR, estimated glomerular filtration rate; TG, triglyceride; TC, total cholesterol; HDL-C, high-density lipoprotein cholesterol; LDL-C, low-density lipoprotein cholesterol.
① Number of people (proportion/%) or x±s or M(P25, P75). 下载: 导出CSV
表 2 研究对象的尿液金属水平
Table 2. Urinary metal levels of the participants
金属
Metals/(μg·g-1)全人群
Total population① (n=1 905)血脂正常
Normal blood lipid① (n=637)血脂异常
Dyslipidemia① (n=1 268)Z值
valueP值
value锌 Zn 272.202 7(190.801 7, 382.250 1) 247.479 8(170.725 6, 336.561 7) 287.133 7(205.186 0, 405.627 6) -6.303 < 0.001 钛 Ti 23.048 9(16.684 3, 30.332 2) 23.505 6(17.326 3, 31.086 0) 22.765 7(16.432 8, 30.245 5) 1.331 0.183 铀 U 0.004 8(0.002 9, 0.008 4) 0.004 8(0.002 9, 0.008 6) 0.004 8(0.002 9, 0.008 3) 0.053 0.958 铅 Pb 2.060 7(1.221 2, 4.002 9) 1.938 0(1.182 1, 3.971 5) 2.155 7(1.238 6, 4.004 9) -1.491 0.136 钡 Ba 1.167 0(0.631 4, 2.201 2) 1.163 9(0.586 7, 2.129 5) 1.167 1(0.650 6, 2.233 0) -1.056 0.291 注:①以M(P25, P75)表示。
Note: ① M(P25, P75).
下载: 导出CSV
表 3 单金属暴露与血脂异常风险的关联
Table 3. Association of monometallic exposure with risk of dyslipidemia
金属 Metals 模型1 Model 1 模型2 Model 2 模型3 Model 3 OR值value
(95% CI)P值
valueOR值value
(95% CI)P值
valueOR值value
(95% CI)P值
value锌Zn T1 1.00 1.00 1.00 T2 1.32(1.05~1.67) 0.017 1.19(0.93~1.51) 0.165 1.17(0.92~1.49) 0.198 T3 2.10(1.64~2.67) < 0.001 1.93(1.49~2.49) < 0.001 1.76(1.36~2.29) < 0.001 P趋势 Ptrend < 0.001 < 0.001 < 0.001 钛Ti T1 1.00 1.00 1.00 T2 0.96(0.76~1.22) 0.732 0.97(0.76~1.24) 0.807 0.96(0.75~1.24) 0.762 T3 0.89(0.70~1.13) 0.339 0.92(0.72~1.18) 0.519 0.90(0.70~1.15) 0.400 P趋势 Ptrend 0.344 0.522 0.405 铀U T1 1.00 1.00 1.00 T2 1.01(0.80~1.28) 0.940 1.07(0.84~1.37) 0.579 1.08(0.84~1.38) 0.542 T3 1.00(0.79~1.27) 0.969 1.25(0.97~1.60) 0.080 1.24(0.96~1.59) 0.096 P趋势 Ptrend 0.944 0.256 0.255 铅Pb T1 1.00 1.00 1.00 T2 1.14(0.90~1.44) 0.281 1.16(0.91~1.49) 0.229 1.17(0.91~1.49) 0.218 T3 1.13(0.89~1.43) 0.315 1.27(0.99~1.62) 0.060 1.29(1.01~1.66) 0.042 P趋势 Ptrend 0.364 0.069 0.048 钡Ba T1 1.00 1.00 1.00 T2 1.24(0.98~1.57) 0.076 1.25(0.97~1.59) 0.081 1.23(0.96~1.58) 0.101 T3 1.09(0.86~1.38) 0.473 1.14(0.90~1.46) 0.280 1.13(0.89~1.45) 0.320 P趋势 Ptrend 0.478 0.286 0.326 注:模型1调整年龄、性别;模型2在模型1的基础上调整受教育程度、吸烟状态、饮酒状态、体力活动、体质量指数、估算的肾小球滤过率;模型3在模型2的基础上继续调整糖尿病。
Note: Model 1 adjusts age and gender; Model 2 adjusts the educational level, smoking status, drinking status, physical activity, body mass index and estimated glomerular filtration rate based on model 1. Model 3 continues to adjust the diabetes based on model 2.
下载: 导出CSV
-
[1] Pirillo A, Casula M, Olmastroni E, et al. Global epidemiology of dyslipidaemias[J]. Nat Rev Cardiol, 2021, 18(10): 689-700. DOI: 10.1038/s41569-021-00541-4. [2] Nasab H, Rajabi S, Eghbalian M, et al. Association of As, Pb, Cr, and Zn urinary heavy metals levels with predictive indicators of cardiovascular disease and obesity in children and adolescents[J]. Chemosphere, 2022, 294: 133664. DOI: 10.1016/j.chemosphere.2022.133664. [3] Yu YJ, Chen RN, Li ZC, et al. Associations of urinary zinc exposure with blood lipid profiles and dyslipidemia: mediating effect of serum uric acid[J]. Sci Total Environ, 2024, 912: 168951. DOI: 10.1016/j.scitotenv.2023.168951. [4] 王增武, 刘静, 李建军, 等. 中国血脂管理指南(2023年)[J]. 中国循环杂志, 2023, 38(3): 237-271. DOI: 10.3969/j.issn.1000-3614.2023.03.001.Wang ZW, Liu J, Li JJ, et al. Chinese guidelines for lipid management (2023)[J]. Chin Circ J, 2023, 38(3): 237-271. DOI: 10.3969/j.issn.1000-3614.2023.03.001. [5] Czoli CD, White CM, Reid JL, et al. Awareness and interest in IQOS heated tobacco products among youth in Canada, England and the USA[J]. Tob Control, 2020, 29(1): 89-95. DOI: 10.1136/tobaccocontrol-2018-054654. [6] Huang MM, Jiao JJ, Zhuang P, et al. Serum polyfluoroalkyl chemicals are associated with risk of cardiovascular diseases in national US population[J]. Environ Int, 2018, 119: 37-46. DOI: 10.1016/j.envint.2018.05.051. [7] 樊萌语, 吕筠, 何平平. 国际体力活动问卷中体力活动水平的计算方法[J]. 中华流行病学杂志, 2014, 35(8): 961-964. DOI: 10.3760/cma.j.issn.0254-6450.2014.08.019.Fan MY, Lyu J, He PP. Chinese guidelines for data processing and analysis concerning the international physical activity questionnaire[J]. Chin J Epidemiol, 2014, 35(8): 961-964. DOI: 10.3760/cma.j.issn.0254-6450.2014.08.019. [8] 《中国老年2型糖尿病防治临床指南》编写组. 中国老年2型糖尿病防治临床指南(2022年版)[J]. 中国糖尿病杂志, 2022, 30(1): 2-51. DOI: 10.3969/j.issn.1006-6187.2022.01.002.Clinical Guidelines for the Prevention and Treatment of Type 2 Diabetes in the Elderly in China. Clinical guidelines for the prevention and treatment of type 2 diabetes mellitus in the elderly in China (2022 edition)[J]. Chin J Diabetes, 2022, 30(1): 2-51. DOI: 10.3969/j.issn.1006-6187.2022.01.002. [9] Cakmak S, Mitchell K, Lukina A, et al. Do blood metals influence lipid profiles? Findings of a cross-sectional population-based survey[J]. Environ Res, 2023, 231(Pt 2): 116107. DOI: 10.1016/j.envres.2023.116107. [10] Wang GS, Fang LL, Chen YT, et al. Association between exposure to mixture of heavy metals and hyperlipidemia risk among U.S. adults: a cross-sectional study[J]. Chemosphere, 2023, 344: 140334. DOI: 10.1016/j.chemosphere.2023.140334. [11] Huang XH, Jiang DD, Zhu YG, et al. Chronic high dose zinc supplementation induces visceral adipose tissue hypertrophy without altering body weight in mice[J]. Nutrients, 2017, 9(10): 1138. DOI: 10.3390/nu9101138. [12] Hussain S, Khan M, Sheikh TMM, et al. Zinc essentiality, toxicity, and its bacterial bioremediation: a comprehensive insight[J]. Front Microbiol, 2022, 13: 900740. DOI: 10.3389/fmicb.2022.900740. [13] Ma JX, Zhou Y, Wang DM, et al. Associations between essential metals exposure and metabolic syndrome (MetS): exploring the mediating role of systemic inflammation in a general Chinese population[J]. Environ Int, 2020, 140: 105802. DOI: 10.1016/j.envint.2020.105802. [14] Musial J, Krakowiak R, Mlynarczyk DT, et al. Titanium dioxide nanoparticles in food and personal care products-what do we know about their safety?[J]. Nanomaterials, 2020, 10(6): 1110. DOI: 10.3390/nano10061110. [15] Lee J, Jeong JS, Kim SY, et al. Titanium dioxide nanoparticles oral exposure to pregnant rats and its distribution[J]. Part Fibre Toxicol, 2019, 16(1): 31. DOI: 10.1186/s12989-019-0313-5. [16] Golasik M, Herman M, Piekoszewski W. Toxicological aspects of soluble titanium - a review of in vitro and in vivo studies[J]. Metallomics, 2016, 8(12): 1227-1242. DOI: 10.1039/c6mt00110f. -

 点击查看大图
计量
- 文章访问数: 9
- HTML全文浏览量: 1
- PDF下载量: 0
- 被引次数: 0