

Study on the influence of compound heat and precipitation extremes on mortality risk in the elderly
-
摘要:
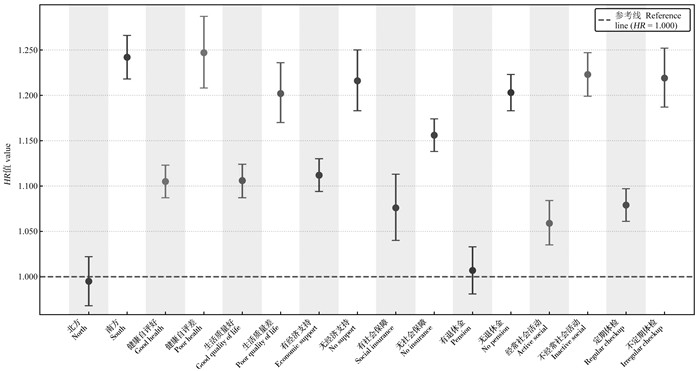
目的 探究复合极端高温-降水事件(compound heat and precipitation extremes, CHPEs)相关的老年人死亡风险,为降低老年人群死亡风险、提升老年人的气候适应水平提供依据。 方法 基于2008―2018年中国老年健康影响因素跟踪调查数据,采用Cox比例风险回归模型分析CHPEs对老年人死亡风险的影响,并探究生病照料和社区服务与CHPEs的交互作用。 结果 CHPEs会增加老年人的死亡风险(HR=1.136, 95% CI: 1.120~1.152),对生活在南方(HR=1.242, 95% CI: 1.218~1.266)、健康自评差(HR=1.247, 95% CI: 1.208~1.287)、生活质量差(HR=1.202, 95% CI: 1.170~1.236)、无经济支持(HR=1.216, 95% CI: 1.183~1.250)、无社会保障(HR=1.156, 95% CI: 1.138~1.174)、无退休金(HR=1.203, 95% CI: 1.183~1.223)、不经常参加社会活动(HR=1.223, 95% CI: 1.199~1.247)和不定期体检(HR=1.219, 95% CI: 1.187~1.252)的老年人死亡风险的影响更大(均P<0.05)。CHPEs与生病照料和社区服务之间存在相乘交互作用(均P<0.05)。对于总人群,CHPEs与生病照料之间存在相加交互作用,进一步分析发现CHPEs对女性、居住在乡村的老年人同样具有相加交互作用。 结论 CHPEs会增加老年人的死亡风险,特别是生活在南方、健康自评差、生活质量差、无经济支持、无社会保障、无退休金、不经常参加社会活动和不定期体检的老年人,而生病照料和社区服务可缓解CHPEs给老年人带来的死亡风险。应建立高危人群定向预警系统及社区防护联动机制,以提高他们对极端气候的适应能力。 -
关键词:
- 复合极端高温-降水事件 /
- 老年人 /
- 死亡风险 /
- 交互作用
Abstract:Objective This study aimed to explore the effects of compound heat and precipitation extremes (CHPEs) on the mortality risk among the elderly, and to provide a basis for reducing the mortality risk of the elderly and improving the climate adaptation level of the elderly. Methods Based on the data of China Longitudinal Healthy Longevity Survey from 2008 to 2018, the Cox proportional-hazards model was used to analyze the impact of CHPEs on the risk of death in the elderly, and to explore the interaction of CHPEs with both sick care and community service. Results CHPEs increased the risk of death among the elderly (HR=1.136, 95% CI: 1.120-1.152); CHPEs had a greater impact on the mortality risk of the elderly in the south (HR==1.242, 95% CI: 1.218-1.266), poor self-rated health (HR=1.247, 95% CI: 1.208-1.287), poor quality of life (HR=1.202, 95% CI: 1.170-1.236), no economic support (HR=1.216, 95% CI: 1.183-1.250), no social insurance (HR=1.156, 95% CI: 1.138-1.174), no pension (HR=1.203, 95% CI: 1.183-1.223), no regular participation in social activities (HR=1.223, 95% CI: 1.199-1.247) and no physical examination (HR=1.219, 95% CI: 1.187-1.252) (all P < 0.05). CHPEs have a multiplicative interaction with sick care and community service (all P < 0.05). For the overall population, there was an additive interaction between CHPEs and sick care. Further analysis reveals that this additive interaction also exists for both women and for elderly people living in rural areas. Conclusions CHPEs significantly increase the risk of death among the elderly, especially for those living in the south, with poor self-rated health, poor quality of life, no economic support, no social insurance, no pension, and no regular participation in social activities and no physical examination. Sick care and community services can alleviate the risk of death caused by CHPEs to the elderly. Targeted early warning systems for high-risk groups and community protection linkage mechanisms should be established to improve their ability to adapt to extreme climates. -
Key words:
- Compound heat and precipitation extremes /
- The elderly /
- Mortality risk /
- Interaction
-

图 1 复合极端高温-降水事件对不同老年人群死亡风险的影响
Figure 1. Effects of compound heat and precipitation extremes on the mortality risk among the elderly population
表 1 14 000名研究对象的基线特征及2007―2017年气象数据描述性统计
Table 1. Baseline characteristics of the 14 000 participants and descriptive statistics of meteorological data from 2007 to 2017
指标
Index人数或最大值(最小值)
Number of people or max (min)构成比或M(P25, P75)
Proportion/% or M(P25, P75)指标
Index人数或最大值(最小值)
Number of people or max (min)构成比或M(P25, P75)
Proportion/% or M(P25, P75)性别Gender 社会保障Social security 男Male 5 979 42.71 是Yes 1 643 11.74 女Female 8 021 57.29 否No 12 357 88.26 年龄/岁Age /years 医疗保障Medical insurance 65~ < 75 1 973 14.09 是Yes 9 948 71.06 75~ < 85 2 937 20.98 否No 4 052 28.94 85~ < 95 4 938 35.27 退休金Pension ≥95 4 152 29.66 是Yes 2 049 14.64 居住地Residence 否No 11 951 85.36 城市Urban 3 494 24.96 高血压Hypertensive 乡村Rural 10 506 75.04 是Yes 2 660 19.00 配偶Spouse 否No 11 340 81.00 有Yes 4 612 32.94 糖尿病Diabetes 无No 9 388 67.06 是Yes 316 2.26 吸烟Smoking 否No 13 684 97.74 是Yes 2 516 17.97 心脏病Heart disease 否No 11 484 82.03 是Yes 1 181 8.44 饮酒Drinking 否No 12 819 91.56 是Yes 2 511 17.94 卒中及脑血管疾病Stroke and cerebrovascular disease 否No 11 489 82.06 是Yes 810 5.79 锻炼Exercise 否No 13 190 94.21 是Yes 3 781 27.01 日常生活活动能力Activities of daily living 否No 10 219 72.99 残障Disabled 1 536 10.97 经济支持Financial support 自理Self-care 12 464 89.03 是Yes 10 736 76.69 复合极端高温-降水事件Compound heat and precipitation extremes 13.000(0) 4.000(3.000, 5.000) 否No 3 264 23.31 平均日照时数Average sunshine hours/h 8.629(3.605) 5.744(5.204, 6.151) 与子女同住Living with children 平均相对湿度Average relative humidity/% 83.965(58.924) 74.817(72.134, 77.692) 是Yes 8 622 61.59 平均风速Average wind speed/(m·s-1) 3.335(1.065) 2.050(1.659, 2.418) 否No 5 378 38.41  下载: 导出CSV
表 2 复合极端高温-降水事件与老年人死亡风险的关联
Table 2. The association between compound heat and precipitation extremes and mortality risk among the elderly
模型Model 未调整模型Unadjusted model 模型1 Model 1 模型2 Model 2 HR值value (95% CI) P值value HR值value(95% CI) P值value HR值value (95% CI) P值value 主模型Main model 1.223(1.209~1.238) < 0.001 1.137(1.122~1.152) < 0.001 1.136(1.120~1.152) < 0.001 敏感性分析Sensitivity analysis① 1.632(1.585~1.680) < 0.001 1.399(1.355~1.445) < 0.001 1.428(1.378~1.479) < 0.001 敏感性分析Sensitivity analysis② 1.237(1.222~1.252) < 0.001 1.145(1.129~1.162) < 0.001 1.143(1.126~1.161) < 0.001 注:模型1调整了一般人口学特征(性别、居住地、配偶、居住方式、经济支持)、生活方式(吸烟、饮酒、锻炼)、社会支持(社会保障、医疗保障、退休金),以及健康状况(高血压、糖尿病、心脏病、卒中及脑血管疾病、日常生活活动能力);模型2在模型1的基础上调整了平均日照时数、平均相对湿度、平均风速。
①对极端高温和极端降水的定义进行了调整,使用了观察期内日最高气温(降水)超过参考期内所有日最高气温(降水)的第95百分位值的数据重新计算CHPEs;②去除城镇老年人样本重新进行分析。
Note: Model 1, adjusted for general demographic characteristics (gender, residence, spouse, living with children, financial support), lifestyle (smoking, drinking, exercise), social support (social insurance, medical insurance, pension) and health status (hypertension, diabetes, heart disease, stroke and cerebrovascular disease, activities of daily living); Model 2, average sunshine hours, average relative humidity and average wind speed were added to model 2.
① The definition of extreme high temperature and extreme precipitation was adjusted, and the CHPEs were recalculated using the data that the daily maximum temperature (precipitation) during the observation period exceeded the 95th percentile of all daily maximum temperatures (precipitation) during the reference period. ② The samples of urban elderly were removed for re-analysis.
下载: 导出CSV
表 3 CHPEs与生病照料和社区服务的相乘交互作用
Table 3. The multiplicative interactions between CHPEs and sick care and community services
特征
CharacteristicsCHPEs与生病照料的相乘交互作用
The multiplicative interaction between CHPEs and sick careCHPEs与社区服务的相乘交互作用
The multiplicative interaction between CHPEs and community servicesHR值value(95% CI) P值
valueHR值value(95% CI) P值
value有生病照料
Sick care无生病照料
No sick care有生病照料
Sick care无生病照料
No sick care总人群Total 1.130(1.113~1.147) 1.178(1.115~1.245) < 0.001 1.093(1.068~1.118) 1.172(1.151~1.194) < 0.001 男Male 1.094(1.069~1.119) 1.157(1.062~1.261) < 0.001 1.071(1.035~1.108) 1.134(1.099~1.169) < 0.001 女Female 1.148(1.126~1.171) 1.201(1.112~1.297) < 0.001 1.107(1.072~1.144) 1.187(1.160~1.216) < 0.001 城镇Urban 1.088(1.040~1.137) 1.240(1.102~1.396) 0.003 1.003(0.942~1.068) 1.199(1.135~1.267) < 0.001 乡村Rural 1.138(1.120~1.156) 1.175(1.100~1.255) < 0.001 1.102(1.075~1.130) 1.178(1.155~1.201) < 0.001 注:CHPEs,复合极端高温-降水事件。
Note: CHPEs, compound heat and precipitation extremes.
下载: 导出CSV
表 4 CHPEs与生病照料和社区服务的相加交互作用
Table 4. The additive interactions between CHPEs and sick care and community services
特征
CharacteristicsCHPEs与生病照料相加交互作用
The additive interaction between CHPEs and sick care (95% CI)CHPEs与社区服务的相加交互作用
The additive interaction between CHPEs and community services(95% CI)RERI AP SI RERI AP SI 总体Total 0.892(0.435~1.349) 0.267(0.123~0.411) 1.617(1.028~2.205) 0.834(0.385~1.284) 0.185(0.055~0.316) 1.313(0.992~1.634) 男Male 0.680(-0.310~1.669) 0.240(-0.118~0.598) 1.592(0.136~3.048) 0.662(0.152~1.171) 0.217(-0.009~0.442) 1.476(0.614~2.338) 女Female 0.964(0.513~1.414) 0.251(0.119~0.382) 1.513(1.045~1.981) 1.057(0.223~1.891) 0.159(0.005~0.313) 1.231(0.937~1.525) 城镇Urban -0.475(-2.123~1.173) -0.170(-0.676~0.337) 0.791(0.331~1.252) 1.513(0.379~2.646) 0.350(0.027~0.673) 1.836(0.062~3.610) 乡村Rural 1.520(1.088~1.951) 0.408(0.310~0.507) 2.265(1.401~3.129) 0.723(0.216~1.229) 0.159(0.017~0.301) 1.256(0.943~1.569) 注:CHPEs,复合极端高温-降水事件;RERI, 相对超额危险度;AP, 交互作用归因比;SI, 交互作用指数。
Note: CHPEs, compound heat and precipitation extremes; RERI, relative excess risk due to interaction; AP, attributable proportion due to interaction; SI, synergy index.
下载: 导出CSV
-
[1] Miao LJ, Ju L, Sun S, et al. Unveiling the dynamics of sequential extreme precipitation-heatwave compounds in China[J]. NPJ Clim Atmos Sci, 2024, 7: 67. DOI: 10.1038/s41612-024-00613-5. [2] Wang QF, Qi JY, Wu H, et al. Freeze-Thaw cycle representation alters response of watershed hydrology to future climate change[J]. Catena, 2020, 195: 104767. DOI: 10.1016/j.catena.2020.104767. [3] Qi ZX, Sun L, Cai YP, et al. Spatial-temporal dynamics of population exposure to compound extreme heat-precipitation events under multiple scenarios for Pearl River Basin, China[J]. Clim Serv, 2024, 34: 100477. DOI: 10.1016/j.cliser.2024.100477. [4] Wu SJ, Chan TO, Zhang W, et al. Increasing compound heat and precipitation extremes elevated by urbanization in South China[J]. Front Earth Sci, 2021, 9: 636777. DOI: 10.3389/feart.2021.636777. [5] Ebi KL, Capon A, Berry P, et al. Hot weather and heat extremes: health risks[J]. Lancet, 2021, 398(10301): 698-708. DOI: 10.1016/S0140-6736(21)01208-3. [6] Khatana SAM, Werner RM, Groeneveld PW. Association of extreme heat with all-cause mortality in the contiguous US, 2008-2017[J]. JAMA Netw Open, 2022, 5(5): e2212957. DOI: 10.1001/jamanetworkopen.2022.12957. [7] Lüthi S, Fairless C, Fischer EM, et al. Rapid increase in the risk of heat-related mortality[J]. Nat Commun, 2023, 14(1): 4894. DOI: 10.1038/s41467-023-40599-x. [8] Zhou WS, Wang Q, Li R, et al. Combined effects of heatwaves and air pollution, green space and blue space on the incidence of hypertension: a national cohort study[J]. Sci Total Environ, 2023, 867: 161560. DOI: 10.1016/j.scitotenv.2023.161560. [9] 易福金, 余露芸, 周天昊, 等. 高温与认知能力: 基于中老年群体的实证研究[J]. 经济学(季刊), 2023, 23(1): 389-408. DOI: 10.13821/j.cnki.ceq.2023.01.23.Yi FJ, Yu LY, Zhou TH, et al. How does heat stress affect the cognitive abilities of middle-aged and elderly cohorts?[J]. China Economic Quarterly, 2023, 23(1): 389-408. DOI: 10.13821/j.cnki.ceq.2023.01.23. [10] 范西莹, 李晶晶. 气候要素影响下老年人死亡风险表现及适应水平差异分析[J]. 人口研究, 2023, 47(5): 115-128.Fan XY, Li JJ. Influence of climate factors on mortality risk of older adults in China[J]. Population Research, 2023, 47(5): 115-128. [11] Xi D, Liu L, Zhang M, et al. Risk factors associated with heatwave mortality in Chinese adults over 65 years[J]. Nat Med, 2024, 30(5): 1489-1498. DOI: 10.1038/s41591-024-02880-4. [12] Liu JT, Yu WP, Pan RB, et al. Association between sequential extreme precipitation-heatwaves events and hospitalizations for schizophrenia: the damage amplification effects of sequential extremes[J]. Environ Res, 2022, 214(Pt 4): 114143. DOI: 10.1016/j.envres.2022.114143. [13] Zhang X, Chen FL, Chen ZF, et al. Temperature exposure and health inequality[J]. J Asian Econ, 2024, 92: 101748. DOI: 10.1016/j.asieco.2024.101748. [14] 江生忠, 郭修琪, 严舒寒, 等. 社会养老保险对老年人身心健康的影响研究[J]. 江西财经大学学报, 2024, (2): 41-55. DOI: 10.13676/j.cnki.cn36-1224/f.2024.02.006.Jiang SZ, Guo XQ, Yan SH, et al. A study on the impact of social pension insurance on the physical and mental health of the elderly[J]. Journal of Jiangxi University of Finance and Economics, 2024, (2): 41-55. DOI: 10.13676/j.cnki.cn36-1224/f.2024.02.006. [15] Sun QF, Yu DM, Fan JN, et al. Healthy lifestyle and life expectancy at age 30 years in the Chinese population: an observational study[J]. Lancet Public Health, 2022, 7(12): e994-e1004. DOI: 10.1016/S2468-2667(22)00110-4. [16] 孙鹃娟, 孙可心. 子代支持和社区环境对老年人心理健康的影响[J]. 人口与发展, 2024, 30(5): 15-26.Sun JJ, Sun KX. The effect of support from adult children and community environment on the mental health of older people[J]. Population and Development, 2024, 30(5): 15-26. -

 点击查看大图
计量
- 文章访问数: 2
- HTML全文浏览量: 1
- PDF下载量: 0
- 被引次数: 0